"Hot" Targets for Northern Observers (observations needed)
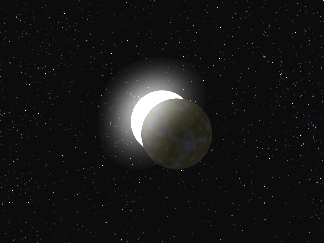
Large aperture observers (14 inches +), choose the faintest star in the hot list. Exception: Tonight NH observers please observe the debris disk star (artistic animation).
WD Name RA DE Vucac3 B-V r' Total LC Cvr Finder
"Hot" Targets for Sothern Observers (observations needed)
Key for above table: Star (*) indicates current highest priority. r' = CMC14 r'-band mag. Total LC = # hours observed. Cvr = period coverage % (desc'n).
"Cold" Target List (no more observations needed)
0050-332 00:53:17.4 -32:59:56 13.44 -0.25 12.8 hrs 66%
0208+396 02:11:17(?)+39:55:34 14.51 +0.31 21.5 hrs 69% Debris disk
0117+383 01:20:39.7 +38:39:34 19.14 -0.29 19.39 04.8 hrs 38% Very very faint
0048-207 00:51:10.2 -20:27:49 17.19 +0.97 13.0 hrs 62% Very faint
0035+152 00:38:01.2 +15:28:38 17.70 -0.17 17.90 27.0 hrs 77% Very faint
2149+021 21:52:25.4 +02:23:16 12.73 -0.01 12.97 28.9 hrs 77% Debris disk (animation)
0046+051 00:49:10.9 +05:22:47 12.39 +0.52 12.56 20.0 hrs 83%
2326+049 23:28:47.3 +05:14:51 12.81 +0.16 13.20 18.8 hrs 78% Debris disk, ZZ Ceti variable
0023+479' 00:23:13.7 +47:52:59 15.30 -0.14 15.56 51.6 hrs 94%
0148+467 01:52:03.0 +47:00:08 12.50 +0.17 12.70 45.9 hrs 91%
2331-475 23:34:02.2 -47:14:27 13.54 -0.31 25.9 hrs 75%
2248+293 22:51:24.1 +29:39:46 15.53 +0.63 13.92 41.4 hrs 86%
0115+159 01:18:00.1 +16:10:20 13.53 +0.11 13.92 56.5 hrs 89%
0000-345 00:02:40.2 -34:13:48 14.94 +0.46 19.3 hrs 76%
0050+357 00:53:40.5 +36:01:17 14.31 -0.1 14.71 51.3 hrs 84%
0134+833 01:41:30.1 +83:34:57 13.1 -0.23 7.3 hrs 52%
2309+105 23:12:21.6 +10:47:04 13.27 -0.32 13.34 25.2 hrs 84%
2211-495 22:14:11.9 -49:19:28 11.7 26.3 hrs 84%
0005+511 00:08:18.2 +51:23:17 13.21 -0.30 63.5 hrs 86%
0004+330 00:07:32.2 +33:17:27 13.83 14.06 42.7 hrs 86%
2111+498 21:12:44.2 +50:06:18 13.01 13.32 57.7 hrs 86%
2359-434 00:02:10.7 -43:09:54 13.3 +0.07 49.0 hrs 90% 2.693-hr sinusoidal variation!
2329+407 23:31:35.9 +41:01:29 14.14 14.09 25.8 hrs 74%
2341+322 23:43:50.7 +32:32:47 13.08 13.08 41.0 hrs 93%
2246+223 22:49:06.0 +22:36:33 14.4 +0.20 14.52 61.4 hrs 86%
2229-311' 22:28:58.1 -31:05:54 15.4 +0.18 46.9 hrs 88% 5.36-minute variations
2256+313 22:58:41.2 +31:33:17 14.0 16.19 36.9 hrs 89%
2148+286 21:51:11.0 +28:51:50 10.5 -0.34 10.73 39.5 hrs 91%
2256+249 22:58:48.1 +25:15:44 13.6 +0.00 13.96 37.8 hrs 69%
2207-303 22:10:27.7 -30:04:52 14.0 -0.20 45.9 hrs 83%
2147+280 21:49:54.6 +28:17:00 14.7 -0.01 14.72 57.6 hrs 90%
2140+207 21:42:42.0 +20:59:46 13.2 +0.13 12.28 22.4 hrs 80%
2151+306' 21:50:40.6 +30:35:34 16.1 +?.?? 16.18 33.2 hrs 87%
2111+261 21:13:45.9 +26:21:33 14.7 +0.24 14.72 107.6 hrs 95%
2134+293' 21:34:05.6 +29:20:02 16.7 16.51 79.3 hrs 96%
2050-301 20:49:30.8 -30 05 03 15.5 +0.10 27.9 hrs 77%
2130-271' 21:30:11.8 -27:04:26 16.9 16.94 25.0 hrs 77%
2049-222 20:52:16.8 -22:06:33 15.0 +0.17 15.02 23.8 hrs 83%
2048+263 20:50:20.7 +26:30:41 15.4 +0.95 15.05 26.3 hrs 83%
2047+372 20:49:06.7 +37:28:14 12.9 +0.14 13.22 49.2 hrs 87%
1904+470' 19:03:56.0 +46:57:35 16.9 17.19 23.5 hrs 79%
2113-294 21:12:40.6 -29:22:18 14.9 +0.12 15.24 29.4 hrs 81%
1822+410 18:23:37.0 +41:04:01 14.4 -0.19 14.38 36.2 hrs 94%
2013+067 20:13:55.5 +06:42:40 15.7 +0.42 15.62 27.3 hrs 84%
1917+449 19 17 20.5 +44 52 39 16.0 +0.05 15.95 20.6 hrs 77%
1809+284 18:11:40.9 +28:29:37 15.1 +0.02 15.43 27.3 hrs 86%
0032-175 00:35:17.4 -17:18:52 14.79 -0.17 14.98 00.0 hrs 00% Debris disk
0004-096 00:07:33.1 -09:21:21 19.93 -0.17 20.12 00.0 hrs 00% Very faint
Note: WD names ending with ' are from Rowell & Hambly catalog, and name used on this web site is not officialy recognized.
Consideration When Selecting a Target
The ideal observing strategy is to observe the same source on the same date by 4 observers (2 in Europe and 2 in USA). This is a way to obtain continuous coverage for up to 18 hours while providing corroboration of any feature seen in one light curve. A second-best strategy is to observe in pairs, either with someone nearby or at a much different longitude. The close-by pairing allows for corroboration of interesting features, and the wide-longitude pairing allows for a longer continuous monitoring. The third strategy is to observe a target without coordinating with anyone else. This may be appropriate if your aperture is especially small (observing a bright WD) or very large (observing a faint WD).
Here's a graph that provides an approximate relationship between telescope aperture and a "matching" white dwarf V-mag, where "matching" means that the SNR produces a good enough quality light curve to detect the transit depths that we're looking for.
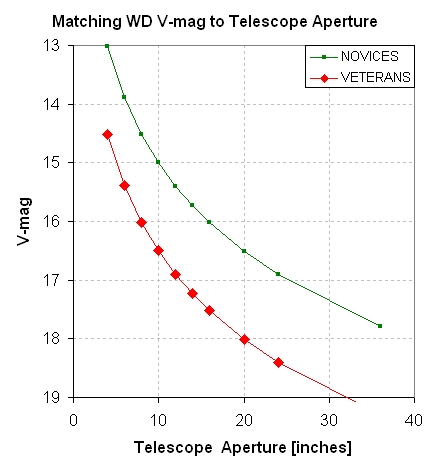
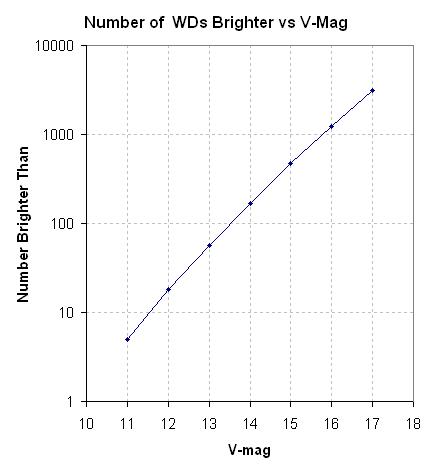
Figure 1a. Left panel: Matching telescope aperture to WD magnitude for producing light curve that's useable for detecting an Earth-like central transit.
Figure 1b. Right panel: Number of known WDs versus brightness. For info supporting the left panel go to link
Data Submission Format
You may submit either a data file or a light curve graph. The format standards for each are given next.
Data File
Data files should be text (ASCII, i.e., file extension of either txt or csv or dat). The first few lines of every data file should be a "header" with information about the start time date (UT), target, etc. Here's an example:
StartDate : 20110801
Object : WD1822+410
Observer : Garlitz, Joe (GJP)
E-mail : garlitzj@eoni.com
Country/State : Oregon
Latitude : +45.5728
ELongitude : -117.9208
Aperture : 12-inch
Filter : C
Exposure : 60 sec
ClockCorrn : 0 sec
Comment : 5 ref stars. Clr, no moon, seeing normal.
Comment : Column headings are JD & Instrumental Magnitude
Following the header is a blank line, which is followed by the photometry measurement data. The data lines consist of two entries per image: JD and magnitude. The magnitude can have any offset, i.e., it can be "instrumental magnitude." Here's and example:
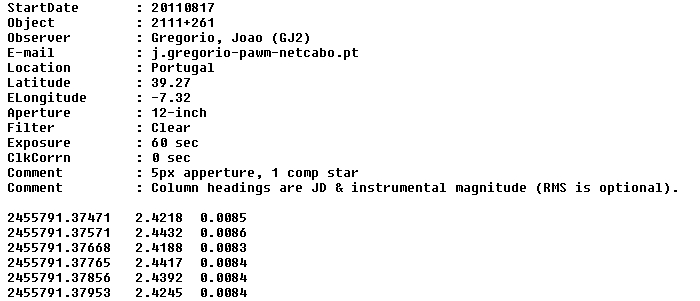
Figure 2. Example of header with data lines, to be attached to an e-mail sent to Bruce Gary at the PAWM e-mail address: 
The JD and magnitude entries may be separated by spaces, commas or tabs. The filename convention is date (YYYYMMDD), target, Observer code, "raw.txt" - with spaces between, as illustrated by the following: raw data filename
20110801 WD1822+410 GJP raw.txt
After this "raw" data file has been processed, to produce a graph (as illusted below), a new data file will be created and linked to below the web page graph. The new file is called "spo" because it includes the following columns (after a header): JD (4-char ahead of decimal), magnitudes that include systematic effects (systematics consist of temporal trend and air mass curvature), magnitudes with systematics removed, magnitudes with systematics removed and also with the average magnitude subtracted (also thought of as having the OOT model subtracted), and RMSi for the previous 3 magnitude values. The term "spo" stands for Systematics present, Pro format (since all professionals publish light curves with systematic removed), OOT model subtracted. The OOT magnitudes are useful for phase folding analyses.
Graph
If a graph is submitted instead of a data file then it should have a magnitude range of 0.7 magnitude and a time span of at least 8 hours. The graph title should include target name, observing session start date (UT), telescope aperture [inches], filter (in parentheses), and observer name (location in parenthses). The JD range should appear somewhere, and the number of references stars used (also called "comp" stars by old timers) should also appear somewhere. Here's an example:
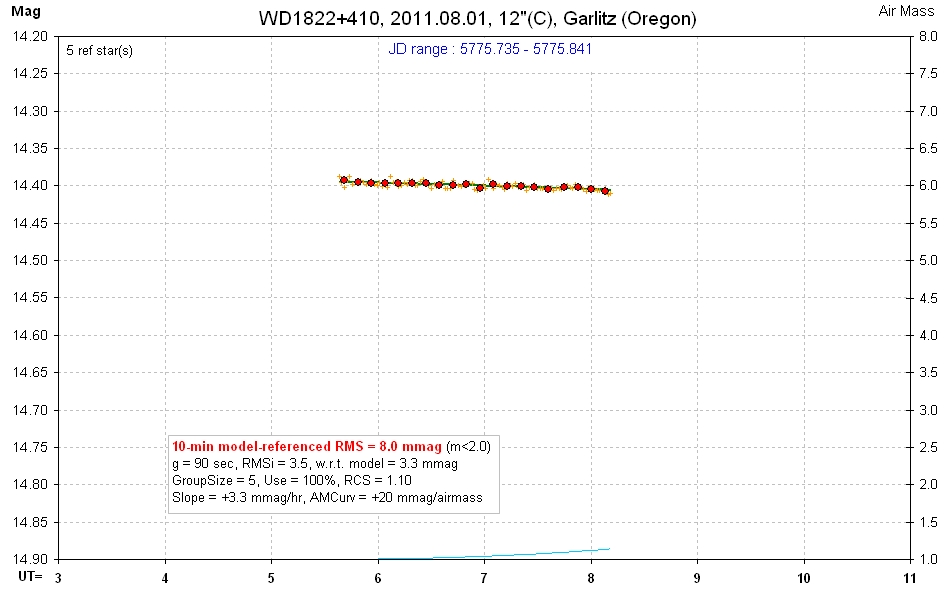
Figure 3. Example of light curve format.
Note that if you choose to submit a light curve please offset the magnitudes so that they correspond to the approximate correct V-mag value. For example, in the "cold" targets list, above, this target is listed as having V-mag = 14.4; in creating the light curve graph an offset was used that produced mganitudes with approximately this value. The information box doesn't have to include the same items shown, but I'll describe them in case you want to include them. The parameter "10-minute-referenced RMS" is based on the individual image RMS value and the number of images acquired per 10 minutes. Exposure time is called "g" (gate time, an engineering term). Individual image RMS, called RMSi, can be calculated by comparing a magnitude with the avearge or median of several nearest neighbors. "RMSi w.r.t. model" is translated as "RMS with respect to a model fit." If the model fit is good then the two RMSi values should be about the same. "GroupSize" (also sometimes called "AvgGrpSize") is the number of individual image magnitudes averaged to produce the large red circle symbols. "Use" should be 100%, indicating that all data were accepted for plotting (no outlier exclusions). "RCS" means "reduced chi-square", and it should be ~1.0 if the model adequately fits the data and the data noise is Gaussian. "Slope" is temporal slope for the model fit. "AMCurv" refers to "air mass curvature", caused by the target star having a different color than the reference star(s).
To summarize file format conventions:
20110806 WD1822+410 MQZ raw.txt This is what observers submit to PAWM as an e-mail attachment. Send to:
Note: all e-mails on this web site have "@" replaced by "-pawm-"
(That's why I used a graphic for my e-mail address, above.)
20110806 WD1822+410 MQZ sys.jpg This is the light curve created by PAWM and displayed on the target's web page
20110806 WD1822+410 MQZ spo.txt This is the data file created by PAWM & containing JD, SYSmag, PROmag, OOTmag, RMSi
Return to PAWM home page.

WebMaster: B.Gary. This site opened: 2011.07.15.  Last Update:  2011.10.04