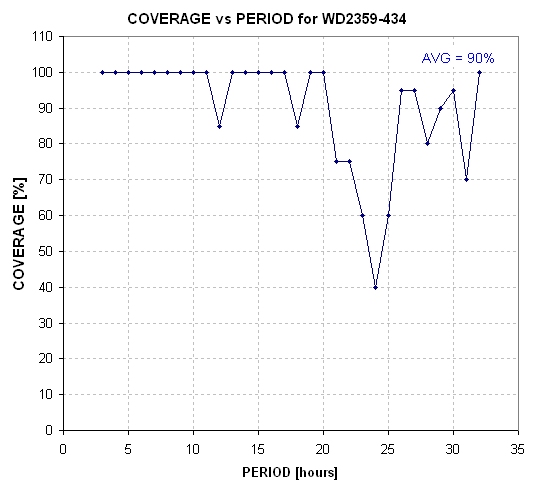
Figure 1. Coverage of hypothetical exoplanet orbital period by observations of 2011. (Coverage for 2012, 2013 & 2014 produces complete coverage for all periods of interest.)
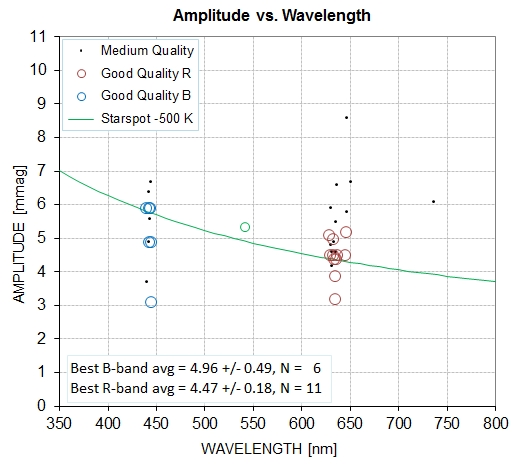
Amplitude of variation versus wavelength (both seasons).
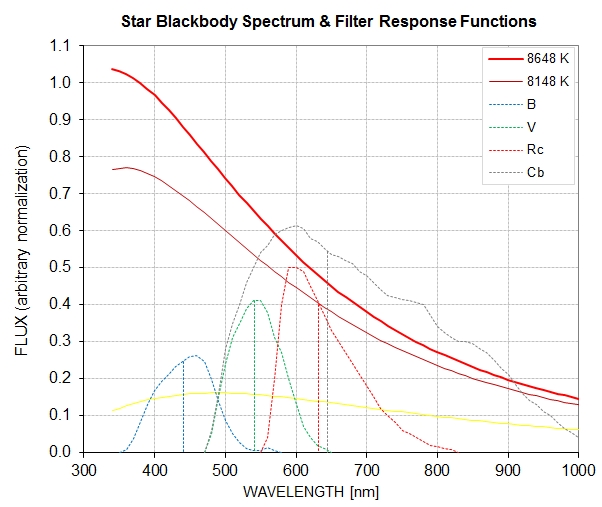
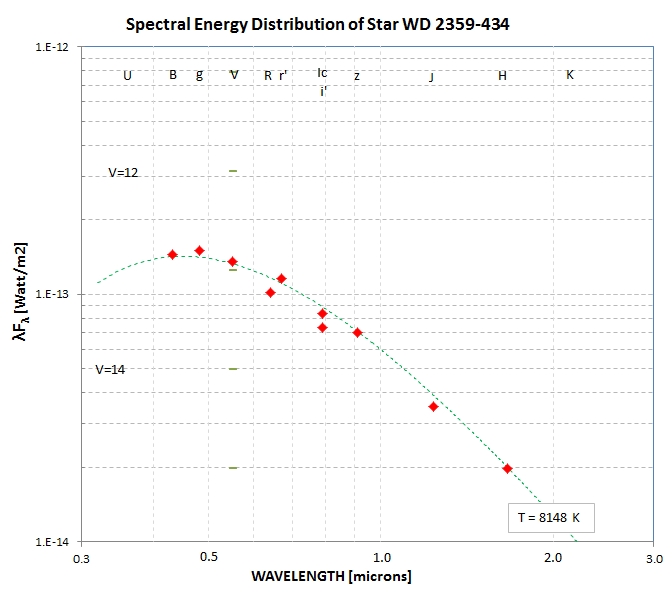
WD 2359-434 spectral energy distribution (SED) and filter band response functions for this SED, typical CCD Q response, atmospheric extinction & telescope optics. The cooler SED is for inside the starspot while the hotter one is for the surroundings.
Comparing 2011 & 2012 Light Curves
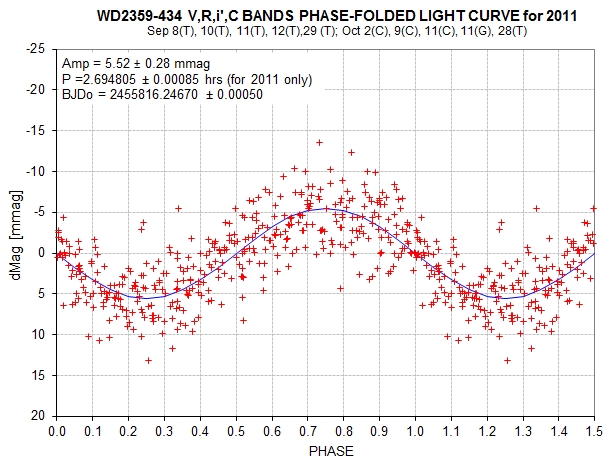
Figure 3. Phase-folded LC, all filter bands (except B,g',z'), for 2011 observing season. All SE's based on chi-squared analysis (systematics not modeled).
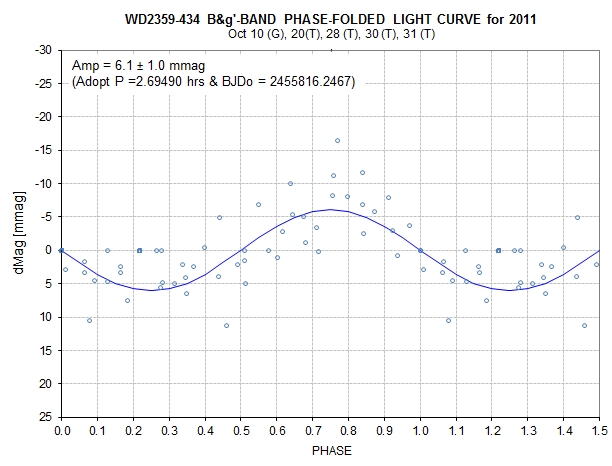
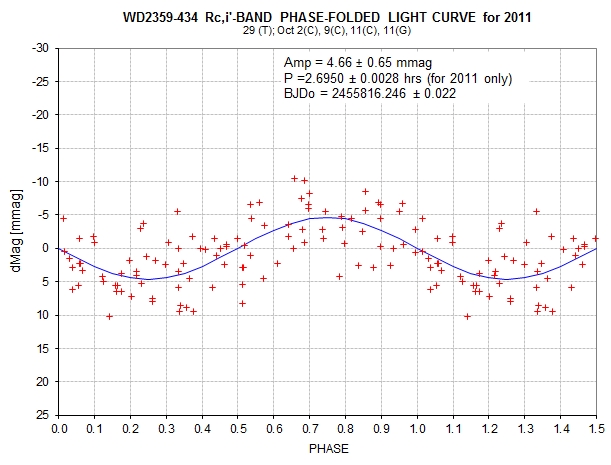
Figure 4a & 4b. 2011 season's phase-folded LC for bands B, g' (left) and Rc, r', i' (right).
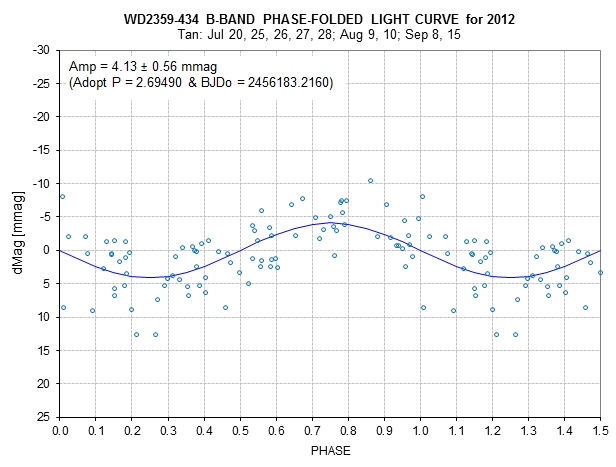
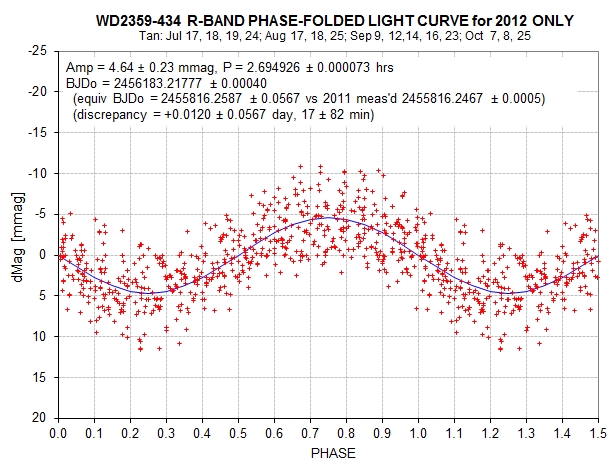
Figure 5a & 5b. 2012 season's phase-folded LC for B-band (left) and Rc-band (right).
Comparing these various LC fits:
B-band amplitude 2012 vs 2011: dif = -2.0 ± 1.2 mmag, not statistically significant (1.7-sigma)
R-band amplitude 2012 vs 2011: dif = -0.06 ± 0.70 mmag, not statistically significant (0.1-sigma)
All-band amplitude 2012 vs 2011: ratio = 1.15 ± 0.09 (departure from 1 not statistically significant, 1.7-sigma),
B-band to R-band amplitude ratio: 1.31 ± 0.31 (2011), 0.90 ± 0.13 (2012), dif = 0.41 ± 0.34, not statistically significant (1.2-sigma)
Period, 2012 vs 2011 (2.69479 & 2.69481): dif = 0.00002 ± 0.00016 hrs, not statistically significant (0.1-sigma)
Phase, 2012 Rl-band, adjusted to 2011 (5816.276) compared w/ 2011 All-Band (5816.247): dif = 0.029 ± 0.168, not statistically significant (0.2-sigma)
Therefore, the 2011 and 2012 light curves are compatible with each other, and it is legitimate to combine both sets of data for determining a most-likely LC shape.
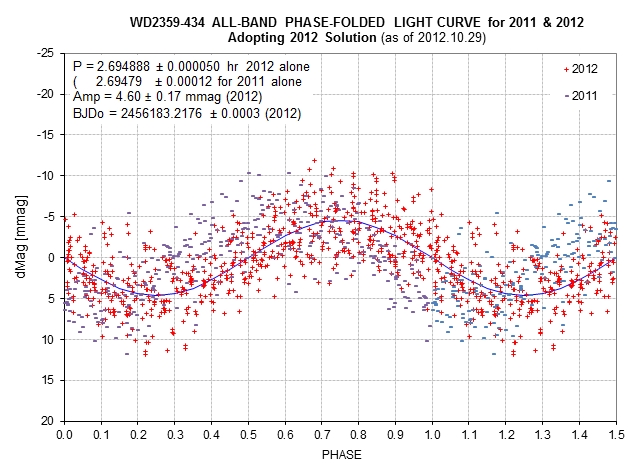
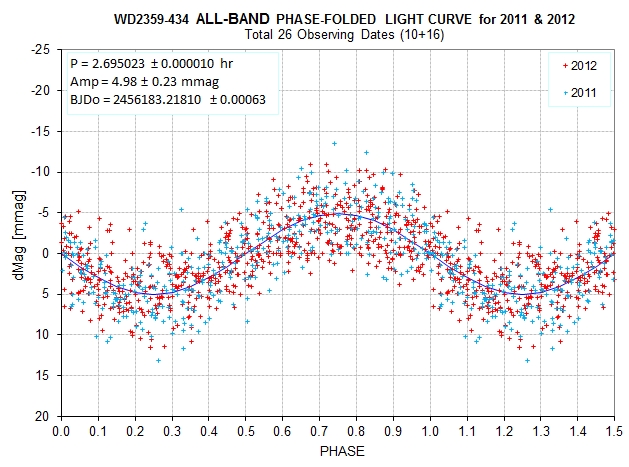
Figure 6a & 6b. Combining 2011 & 2012 data using 2012 solution (left panel) and a combined data (2011 & 2012) with a slight adjustment to period (right panel).
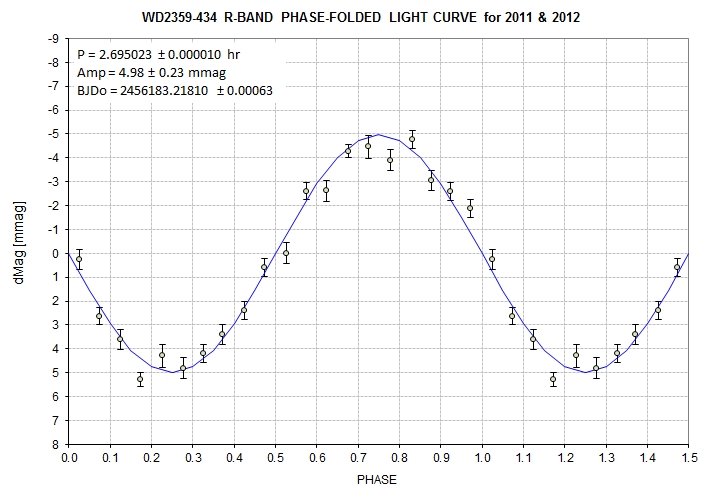
Figure 7a & 7b. Combined 2011 & 2012 data using combined data solution showing phase interval averages.
My tentative position is that P = 2.69501 ± 0.00001 hrs, with BJDo = 2456183.2183 ± 0.0007. Since the R-band amplitudes are statistically the same I adopt the amplitude using the combined data set:
R-band amplitude = 4.78 ± 0.18 mmag. If a departure from sinusoidal is to be invoked it would have a later maximum brightness followed by a steeper fall.
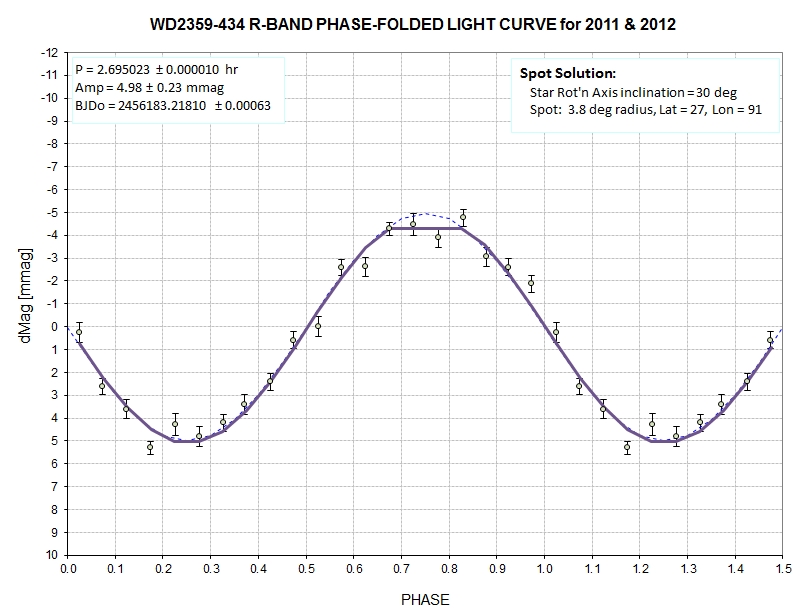
Figure 8. Model fit using a starspot. The star's rotation axis is inclined 30 degrees (from line-of-sight).The starspot (thick blue trace) is at latitude 27 degrees, longitude 91 degrees.
Starspot size radius = 3.8 degrees, assuming the interior of the starspot is 500 K cooler than its surroundings.

Figure 9. Animation kindly created by Manuel Mendez (Spain).
Since a single-spot model fits the data just as well as a 2-spot model The above 1-spot solution is preferred.
2013 Update
Observations of WD2359-434 by TG Tan continue in 2013. Here's a summary of phase-folding results, so far.
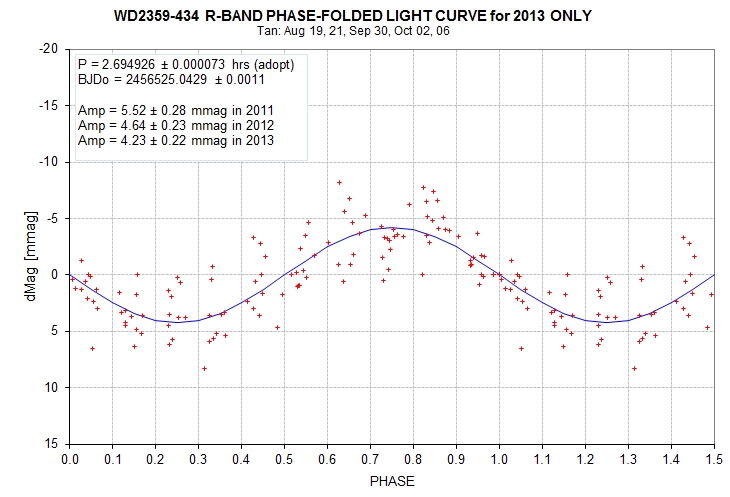
We have only 3 observing dates so far, but the amplitude uncertainty is useable.
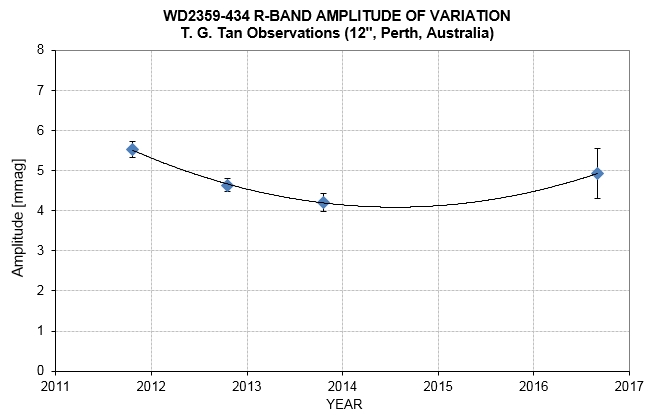
It appears that the amplitude of variation might exhibit a sinusoidal variation with a period of a decade. This could be produced by a starspot that either varies in size or temperature contrast with surroundings.
Explanations for Variability
1) Probably the most conservative interpretation of the 5 mmag variability is the presence of a starspot (produced by magnetic field). This requires that the inclination of the star's rotation axis not be near
0 or 90 degrees, with additional constraints present for the starspot's latitude. Consider i = 24.5 degrees, starspot latitude = 31 degrees, temperature of starspot is much cooler than the 8500 K surface
temperature, then the starspot will be visible for all rotation phases and a spot diameter of 6.6 % of the star diameter would produce the measured quasi-sinusoidal variability. A slightly better fit is obtained
by hypothesizing two star spots, as described in Fig. 8.
2) An alternative explanation is that an exoplanet slightly larger than Jupiter orbits the star at a distance of 0.0045 a.u. (i.e., 113 times the star's radius) with i < 89 deg, assuming an albedo of 100% (derived
at link). The period of 2.7 hours and star mass of 0.94 solar requires the assumed orbit size. Incidentally, the exoplanet would be hotter than Earth (for a more realistic albedo) since the star would appear
twice the diameter of the sun (e.g., 1.0 deg diameter) and the star is hotter than the sun, so the hypothetical planet might be too closer to the star for liquid water to exist.
Is it feasible to detect the presence of such a hypothetical planet using radial velocity (RV) measurements? Planet orbital velocity would be ~ 430 km/s, planet to star mass ratio ~ 4 x 10⁻³, so star velocity
excursion (peak-to-peak) ~ 3.5 km/s. The spectrum has only hydrogen absorption lines, which limits accuracy. The Maxted & Marsh (2000) observations exhited SE ~ 3.5 km/s, so more observations of
this accuracy should be able to rule-in or rule-out the presence of the hypothesized exoplanet.
3) Open for suggestions.
Comment on 2011 and 2012 Changes
The 2011 LCs suggest a slightly larger amplitude of variation at short wavelengths compared to longer ones. The 2012 phase-foled LCs for B- and Rc-band also show a slightly larger B-band amplitude.
The 2012 ratio is 1.30 ± 0.15. Is this similar to other starspot brightness contrasts? Consider YY Gem (two brown dwarfs that eclipse each other); the OOT variation, due to starspots, has a B-band to
Rc-band amplitude ratio of 1.23 ± 0.10. So yes, WD2359 and YY Gem have simuilar amplitude versus wavelength dependencies! This supports the hypothesis that the WD2359 variation is due to starspots.
It may also be consistent with the exoplanet hypothesis, provided the planet's albedo is greater at B-band than Rc-band. Therefore more analysis of existing LCs is needed, and probably more observations
will be helpful.
What about the change in amplitude with time, from 2011 to 2012? For the 2011 observing season the amplitude for V, Rc and i'-bands is 5.15 ± 0.30 mmag, which compares with 4.35 ± 0.23 mmag for
Rc-band for the 2012 observing season (so far). The difference is 0.80 ± 0.38 mmag, which has a 2.1-sigma statistical significance. If the amplitude is really decreasing then this would strongly favor the
starspot hypothesis. This assumes, of course, that any hypothetical exoplanet does not undergo large albedo changes on yearly timescales.
What about phase changes from 2011 to 2012? If starspots are causing the variability then it is reasonable to assume that their effective longitude can change - either by changes in relative size of starspots
within a group of spots (at fixed longitudes) or by longitude movement. The 2012 phase-folding analysis produces a more accurate period than the 2011 data. For 2012, P = 2.69448 ± 0.00014 hours.
The 2012 and 2011 phase solutions differ by 116.3988 ± 0.0060 periods (propogating all uncertainties). Therefore, it appears that the starspots have moved in longitude during the past year! If this holds
up it would definitely rule-out the exoplanet hypothesis and support the starspot hypothesis! More analysis on this matter is planned.
Light Curve Observation Summary
YYYYMMDD JD start - JD end Len[hr] Band Observer RMS10 Sine Amplitude
20160904 7636.220 - 7636.408 4.5 hrs Rc Tan 2.3 mmag, 4.6 ± 0.7 mmag
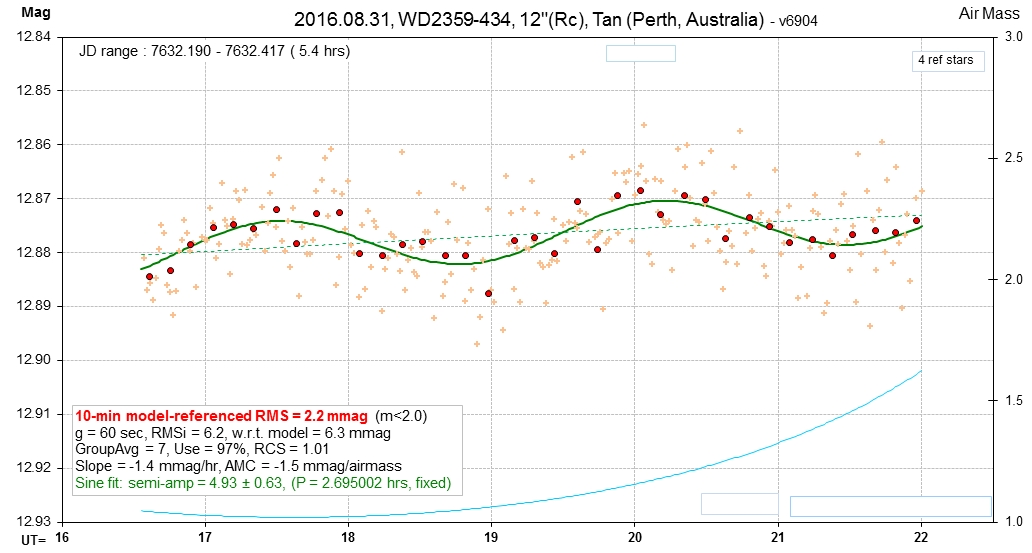
20160831 7632.190 - 7632.417 5.4 hrs Rc Tan 2.2 mmag, 4.9 ± 0.6 mmag
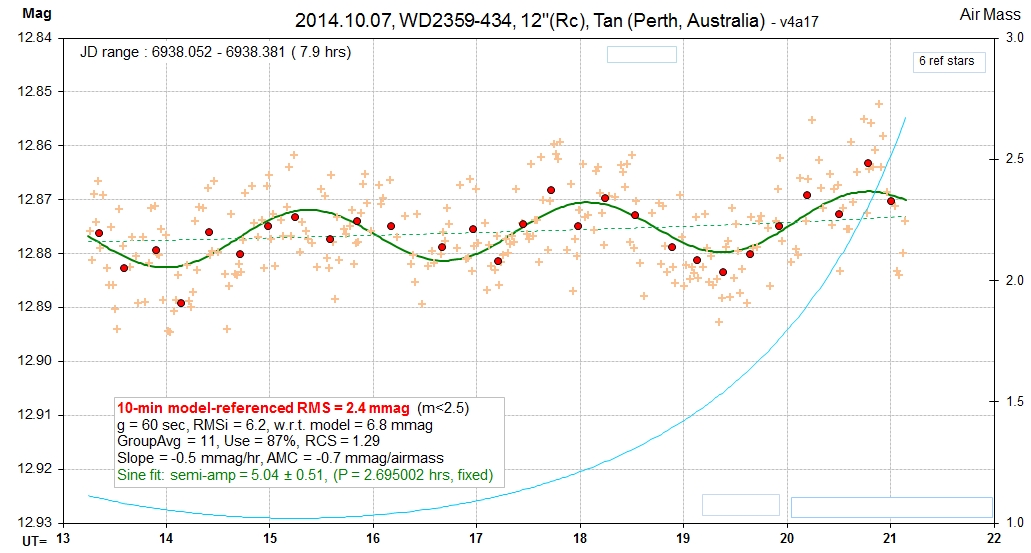
20141007 6938.052 - 6938.381 7.9 hrs Rc Tan 2.4 mmag, 5.0 ± 0.5 mmag
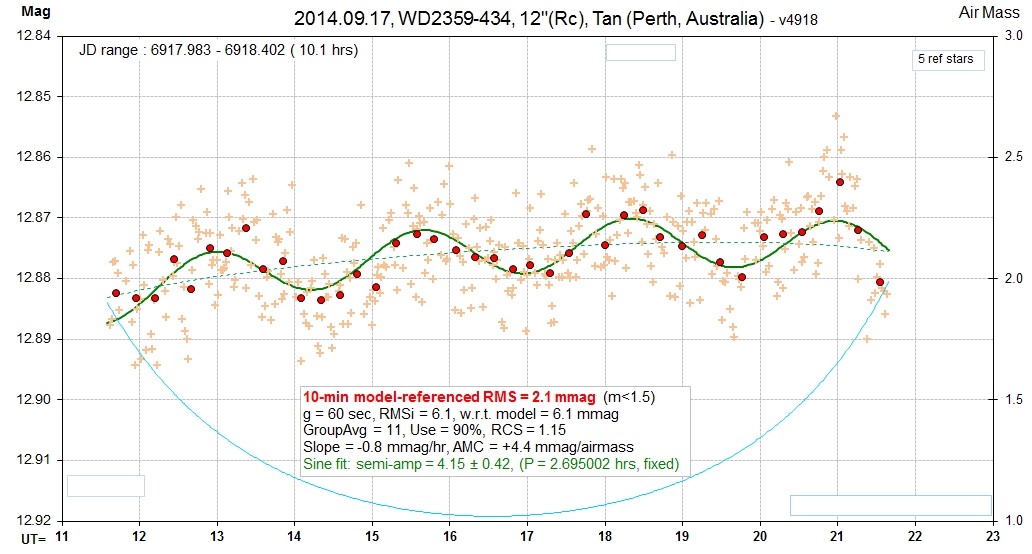
20140917 6917.983 - 6918.402 10.1 hrs Rc Tan 2.1 mmag, 4.2 ± 0.4 mmag
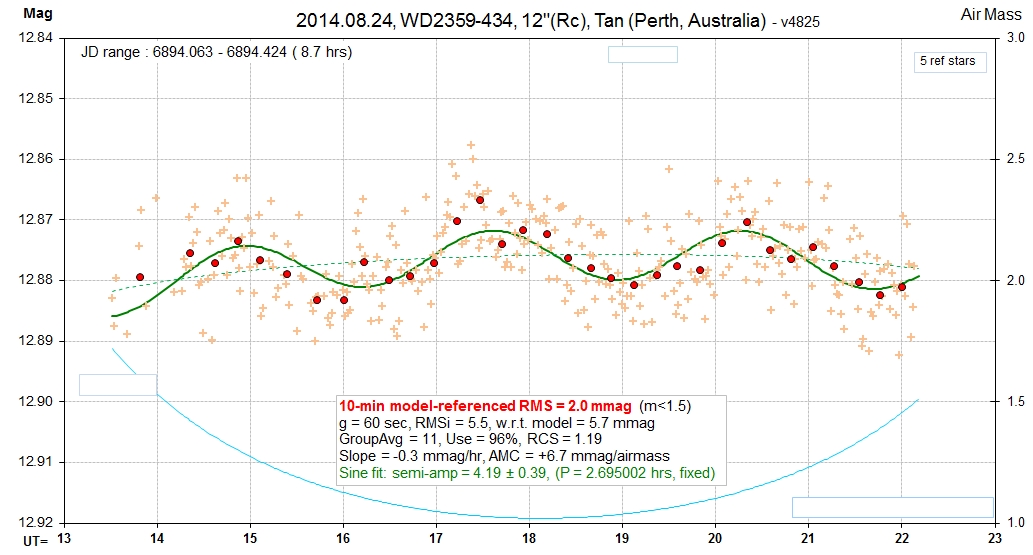
20140824 6894.063 - 6894.424 8.7 hrs Rc Tan 2.0 mmag, 4.2 ± 0.4 mmag
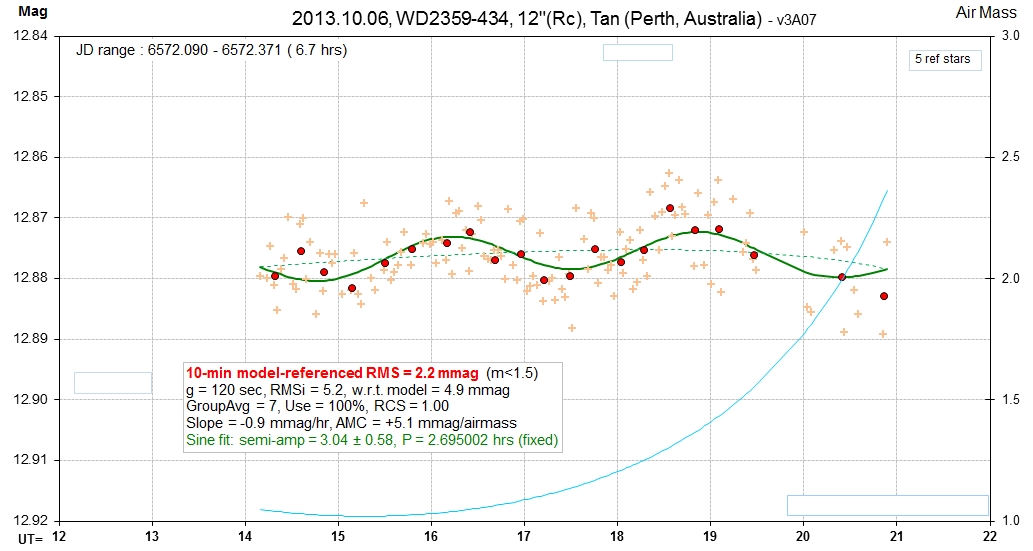
20131006 6572.090 - 6572.371 6.7 hrs Rc Tan 2.2 mmag, 3.0 ± 0.6 mmag
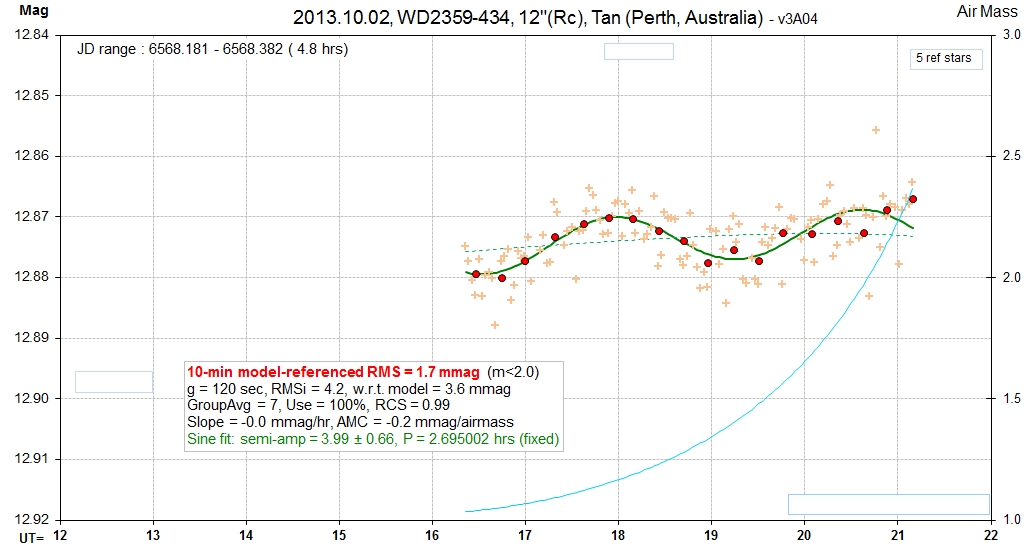
20131002 6568.181 - 6568.382 4.8 hrs Rc Tan 1.7 mmag, 4.0 ± 0.7 mmag
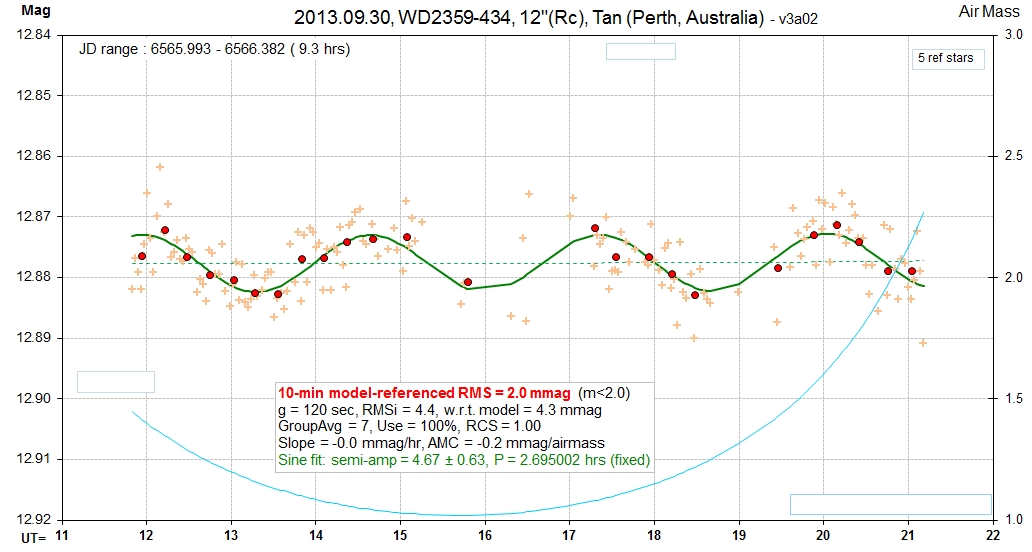
20130930 6565.993 - 6566.382 9.3 hrs Rc Tan 2.0 mmag, 4.7 ± 0.6 mmag
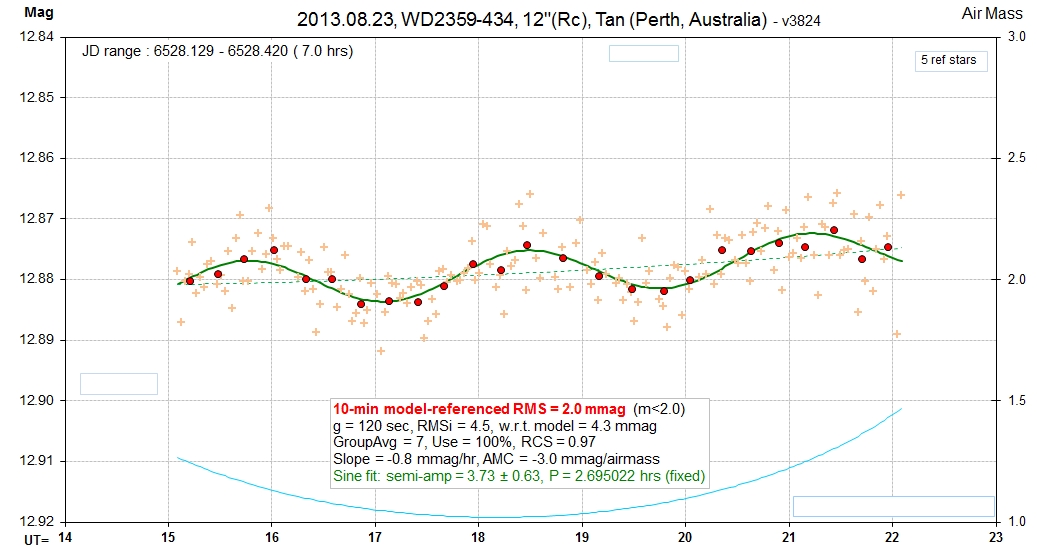
20130823 6528.129 - 6528.420 7.0 hrs Rc Tan 2.0 mmag, 3.7 ± 0.6 mmag
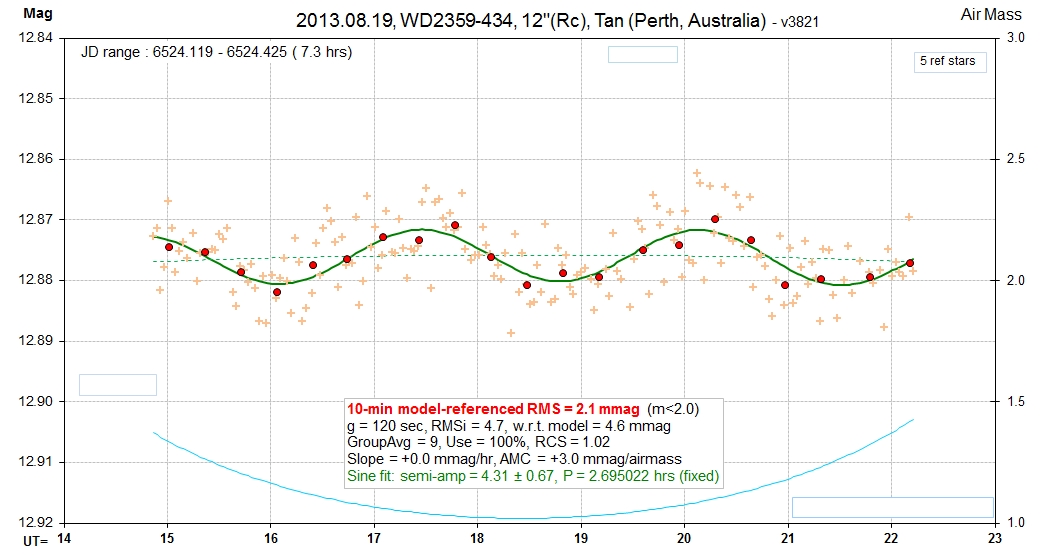
20130819 6524.119 - 6524.425 7.3 hrs Rc Tan 2.1 mmag, 4.3 ± 0.7 mmag
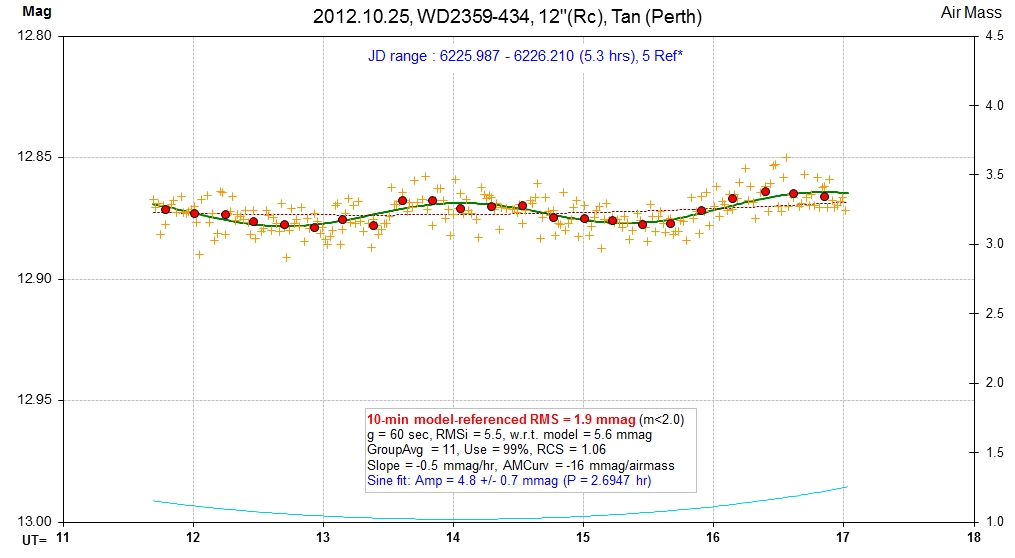
20121025 6225.987 - 6226.210 5.3 hrs Rc Tan 1.9 mmag, 4.8 ± 0.7 mmag
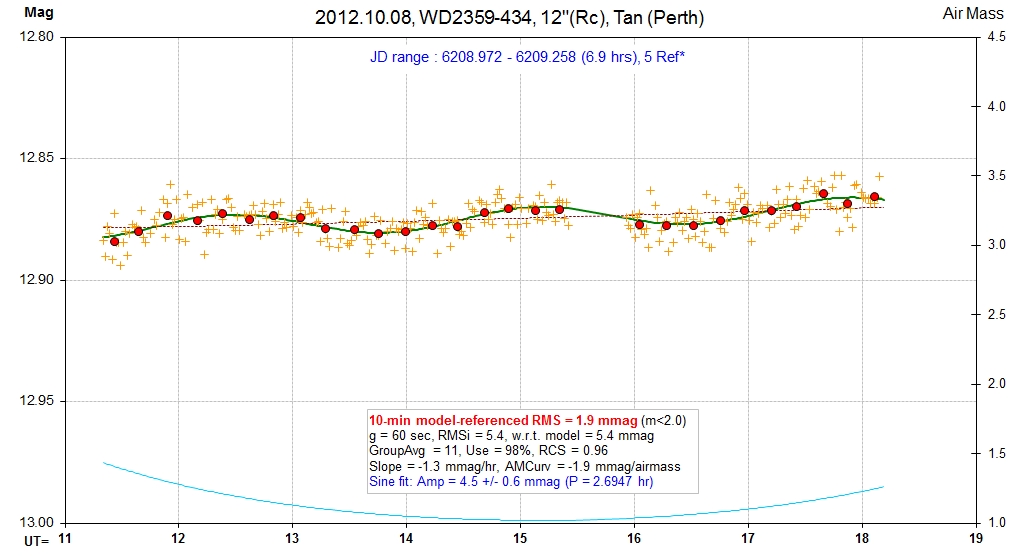
20121008 6208.972 - 6209.258 6.9 hrs Rc Tan 1.9 mmag, 4.5 ± 0.6 mmag
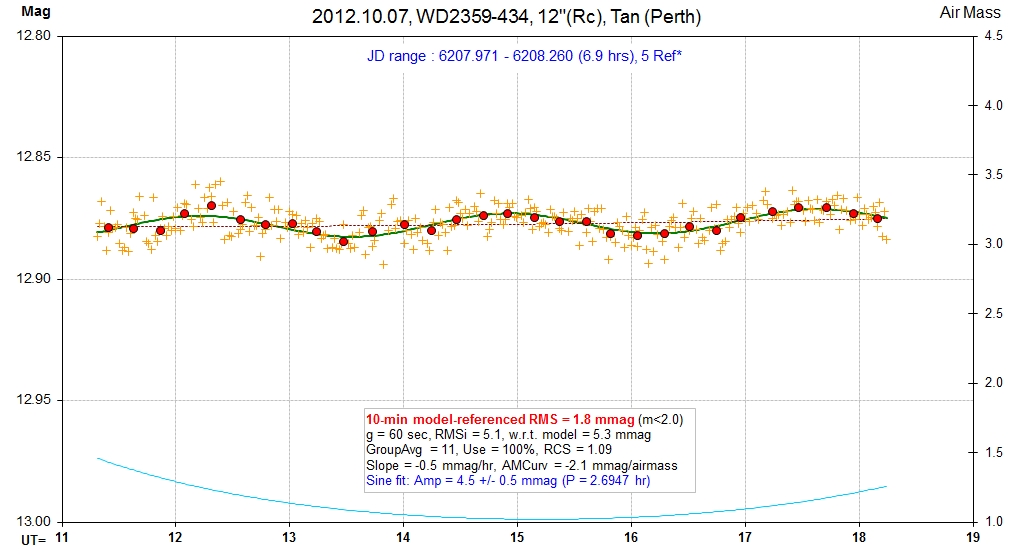
20121007 6207.971 - 6208.260 6.9 hrs Rc Tan 1.8 mmag, 4.5 ± 0.5 mmag
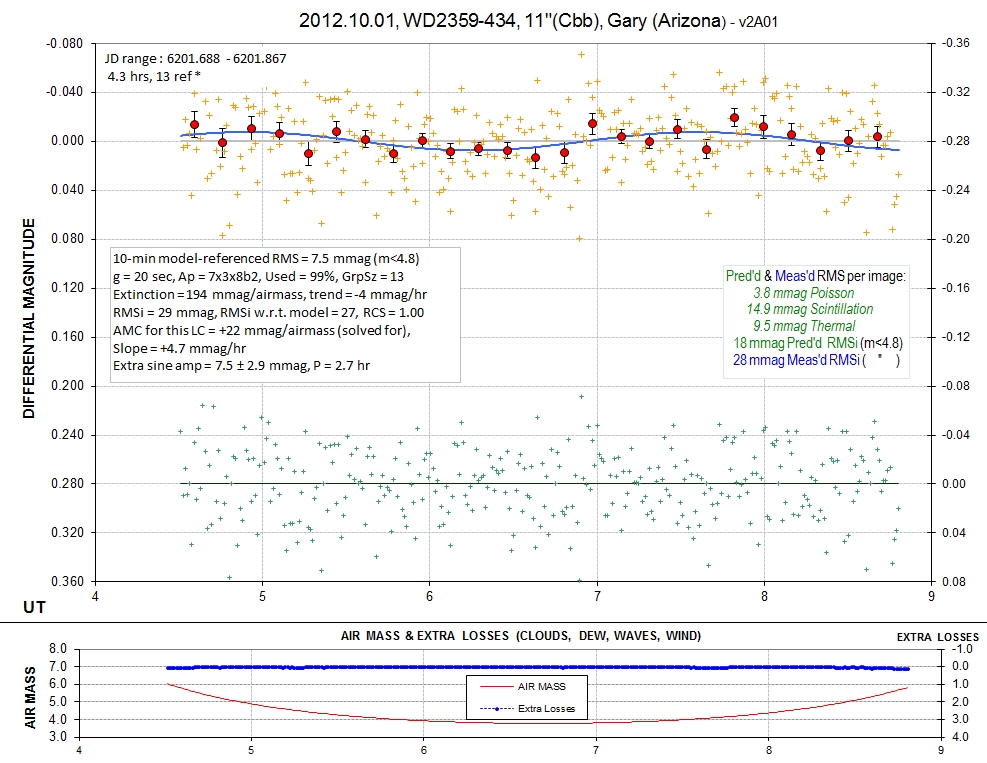
20121001 6201.688 - 6201.867 4.3 hrs Cbb Gary 7.5 mmag, 7.5 ± 2.9 mmag
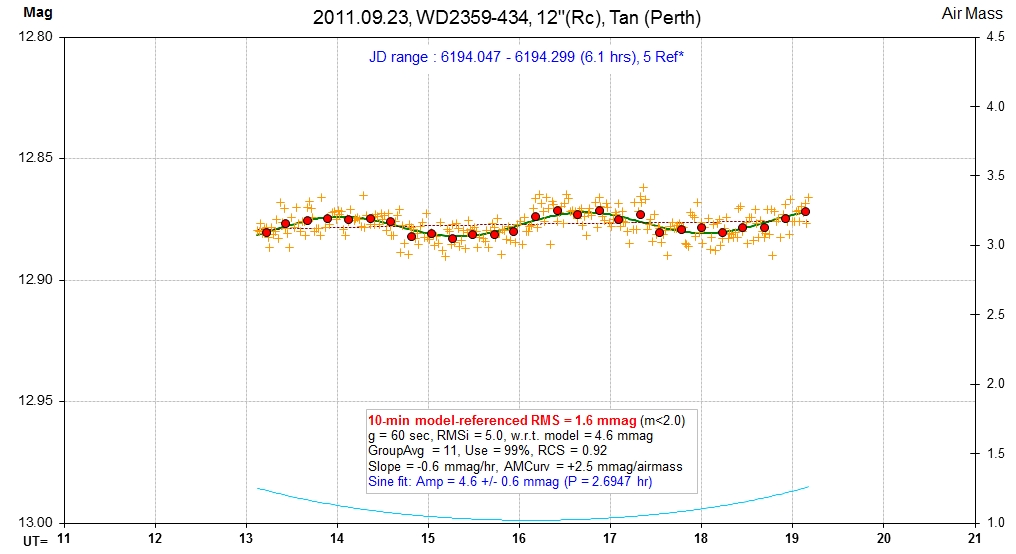
20120923 6194.047 - 6194.299 6.1 hrs Rc Tan 1.6 mmag, 4.6 ± 0.6 mmag
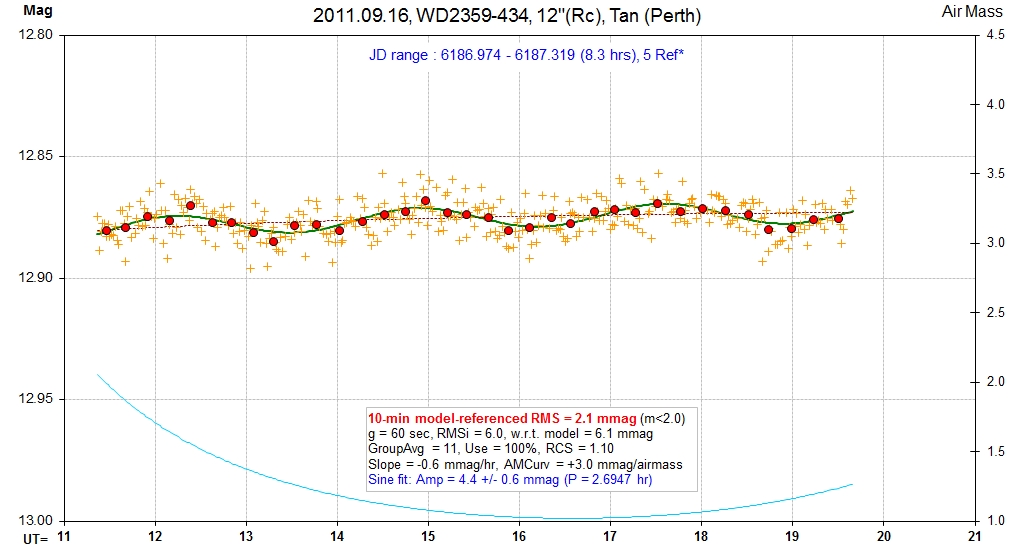
20120916 6186.974 - 6187.319 8.3 hrs Rc Tan 2.1 mmag, 4.4 ± 0.6 mmag
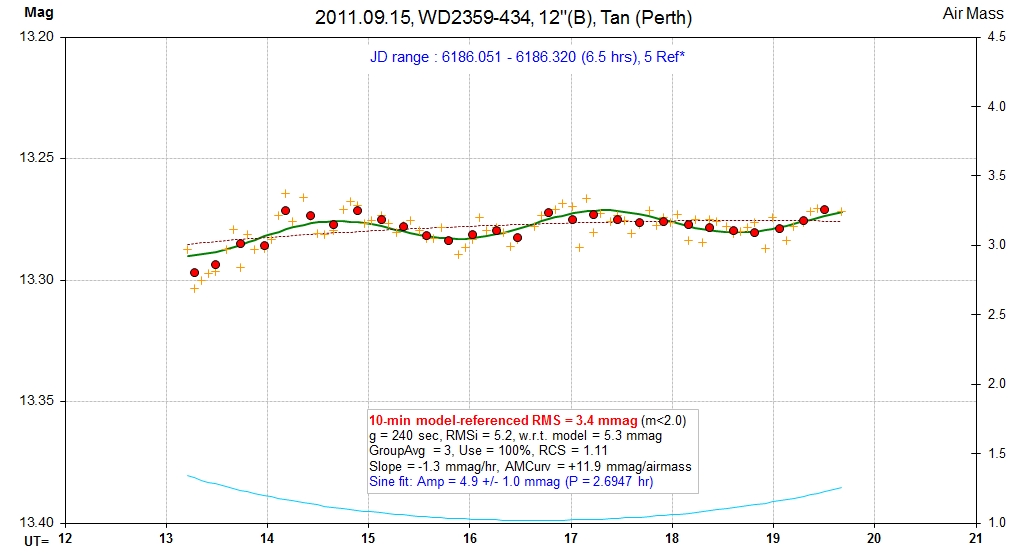
20120915 6186.051 - 6186.320 6.5 hrs B Tan 3.4 mmag, 4.9 ± 1.0 mmag
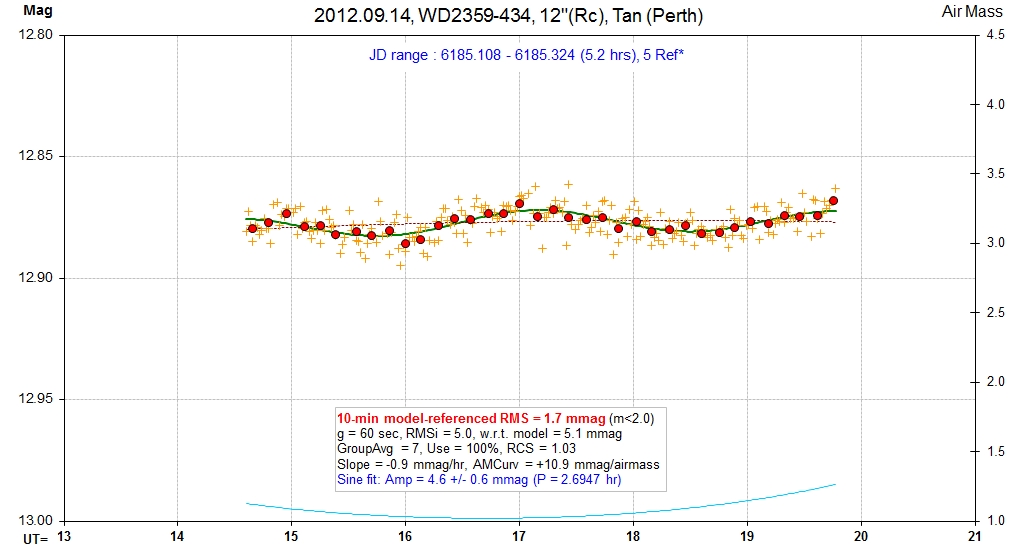
20120914 6185.108 - 6185.324 5.2 hrs Rc Tan 1.7 mmag, 4.6 ± 0.6 mmag
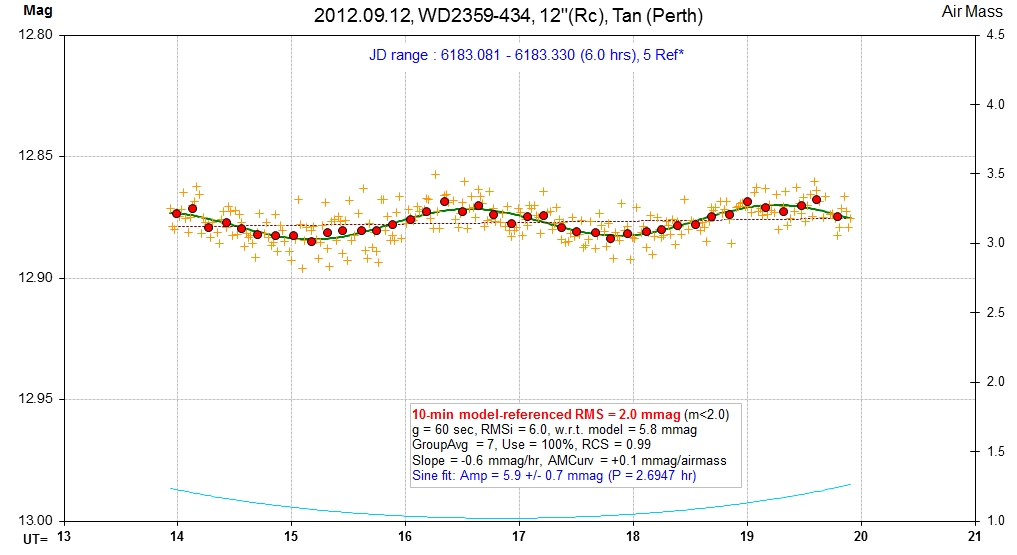
20120912 6183.081 - 6183.330 6.0 hrs Rc Tan 2.0 mmag, 5.9 ± 0.7 mmag
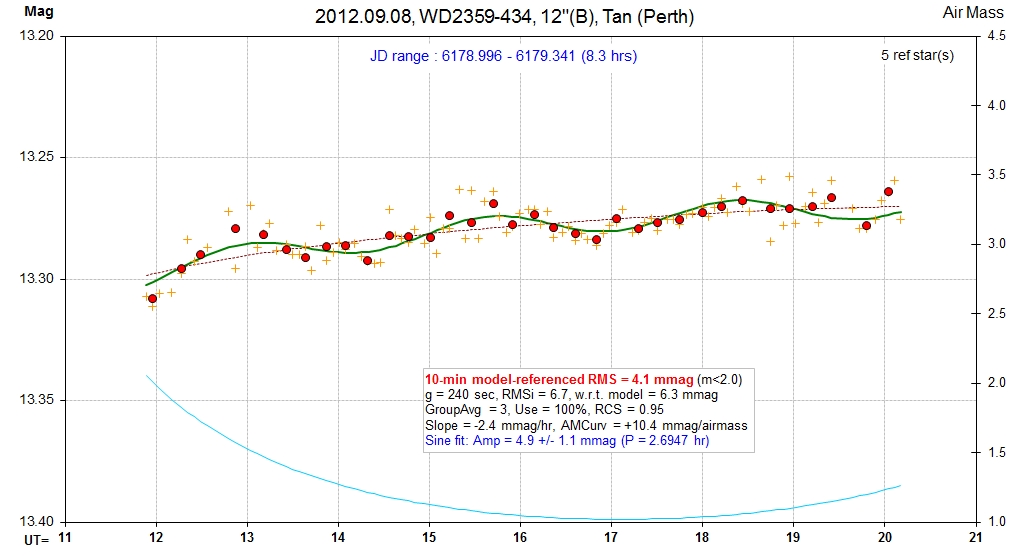
20120908 6178.996 - 6179.341 8.3 hrs B Tan 4.1 mmag, 4.9 ± 1.1 mmag
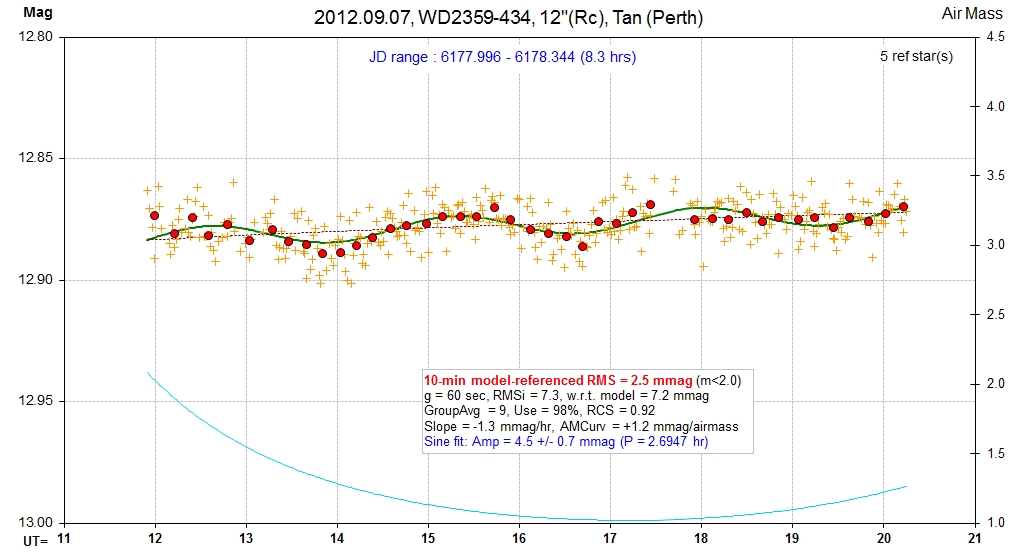
20120907 6177.996 - 6178.344 8.3 hrs Rc Tan 2.5 mmag, 4.5 ± 0.7 mmag
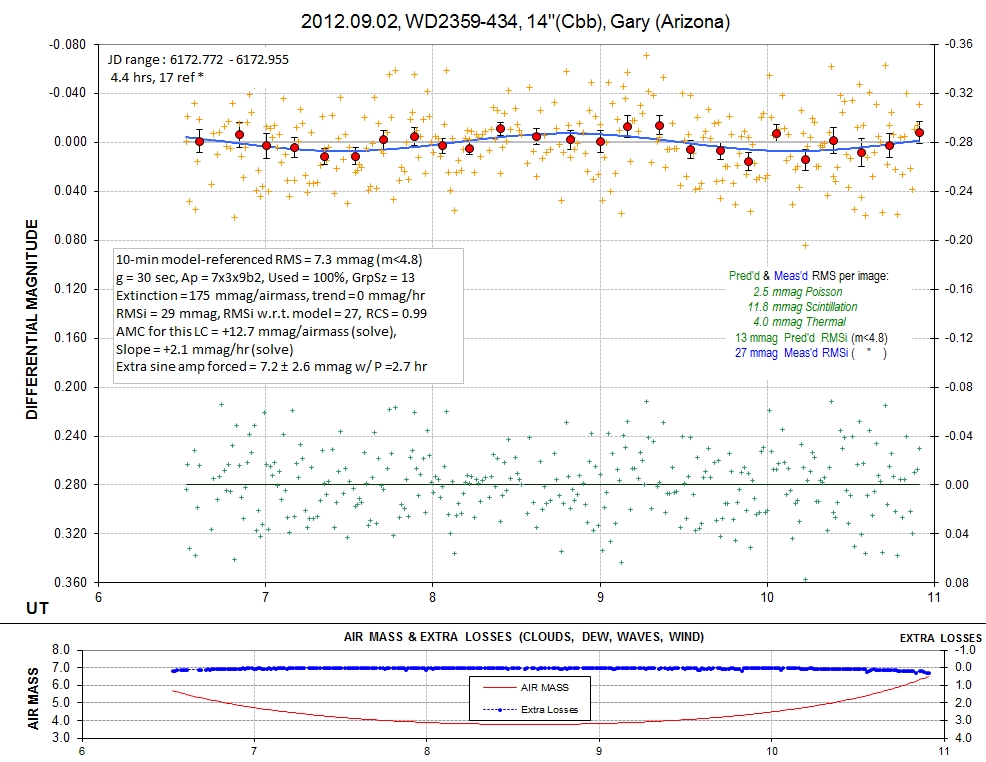
20120902 6172.772 - 6172.955 4.4 hrs Cbb Gary 7.3 mmag, 7.2 ± 2.6 mmag
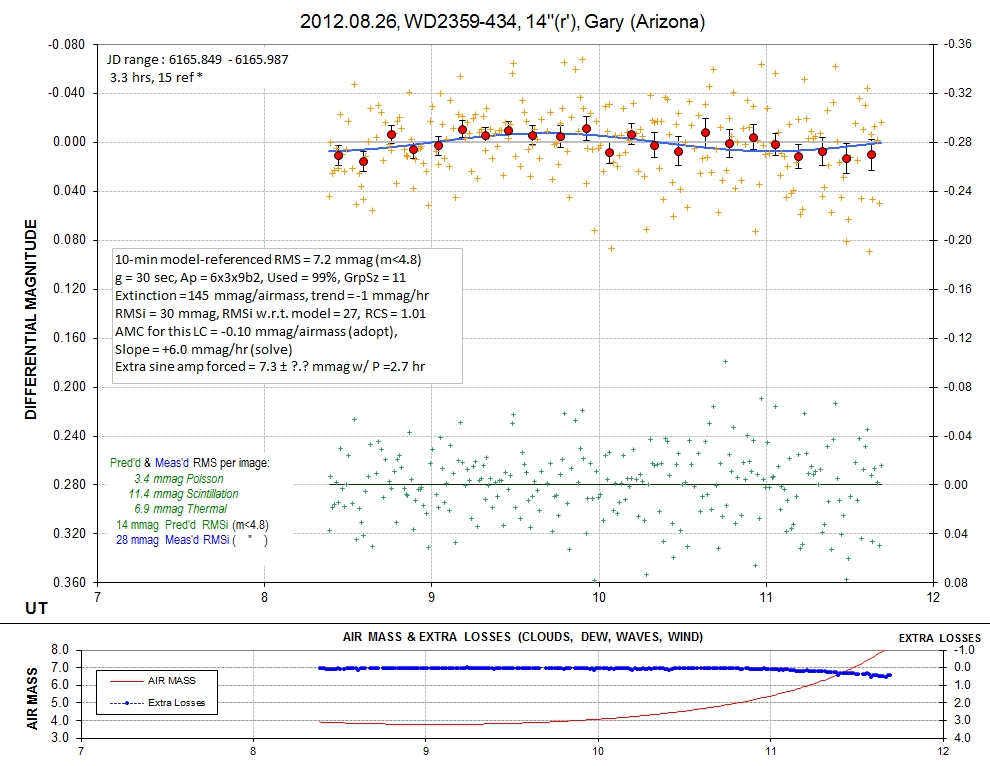
20120826 6165.849 - 6165.987 3.3 hrs r' Gary 7.2 mmag, 7.3 mmag
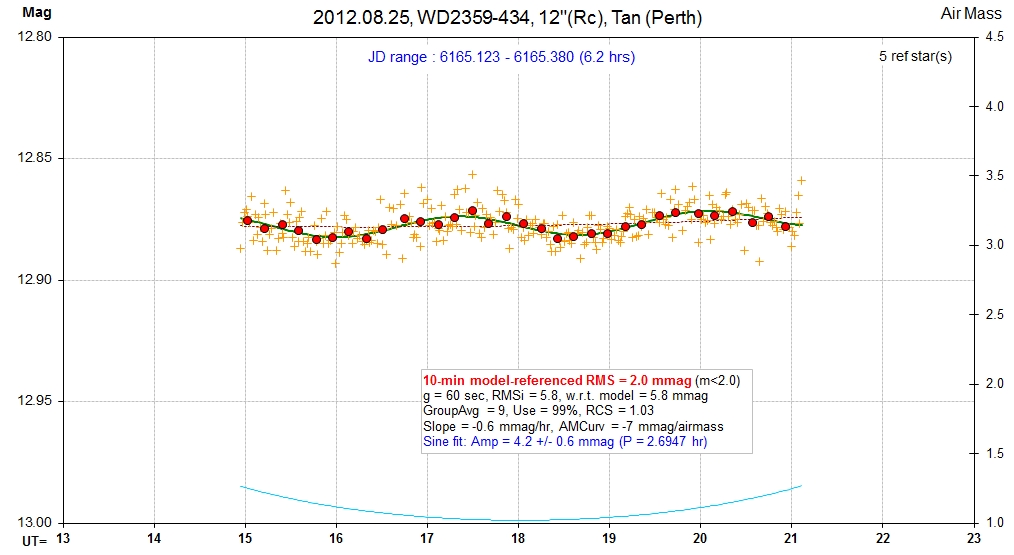
20120825 6165.123 - 6165.380 6.2 hrs Rc Tan 2.0 mmag, 4.2 ± 0.6 mmag
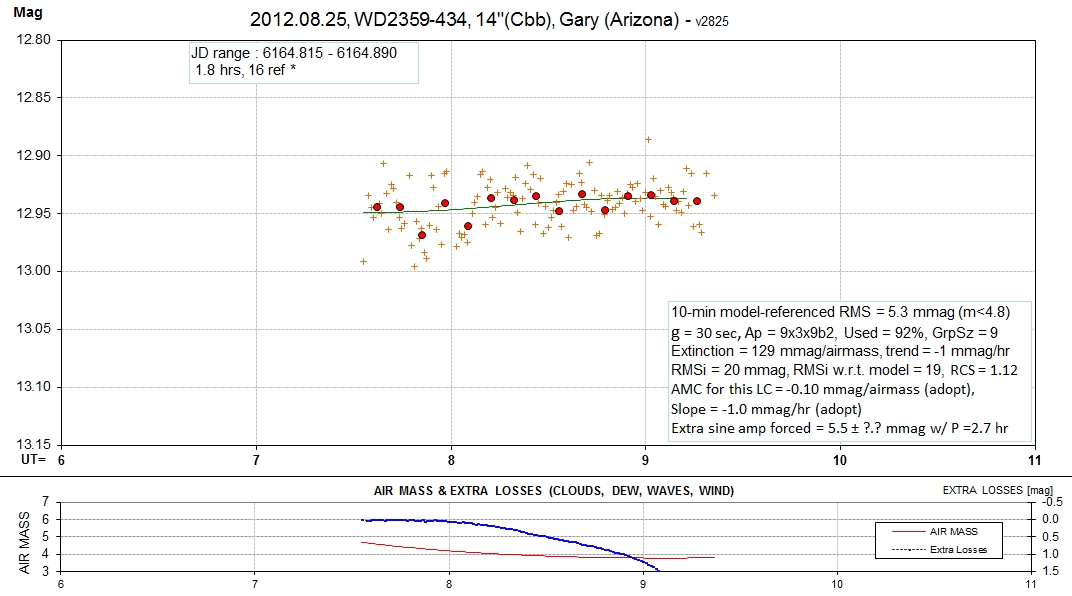
20120825 6164.815 - 6164.890 1.8 hrs Cbb Gary 5.3 mmag, 5.5 mmag adopted
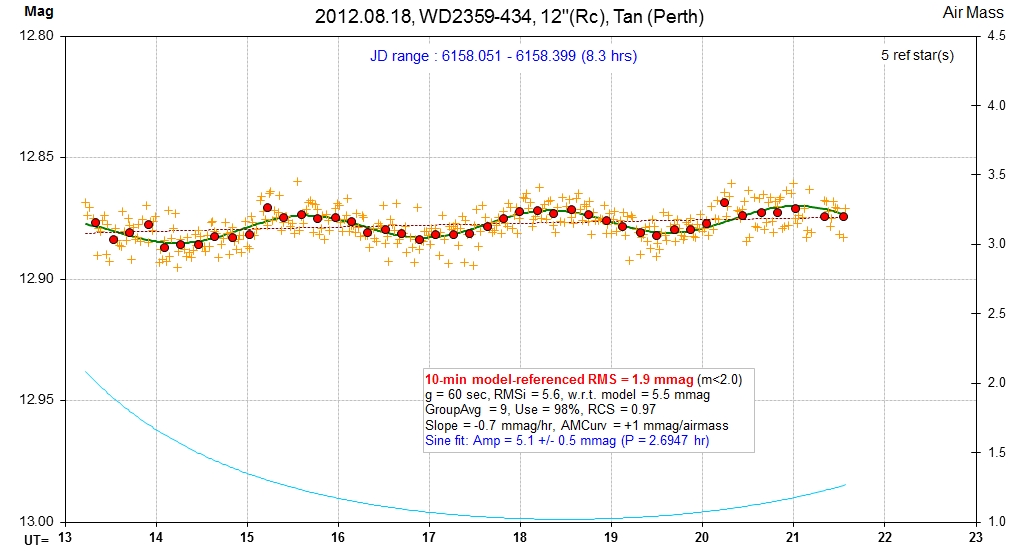
20120818 6158.051 - 6158.399 8.3 hrs Rc Tan 1.9 mmag, 5.1 ± 0.5 mmag
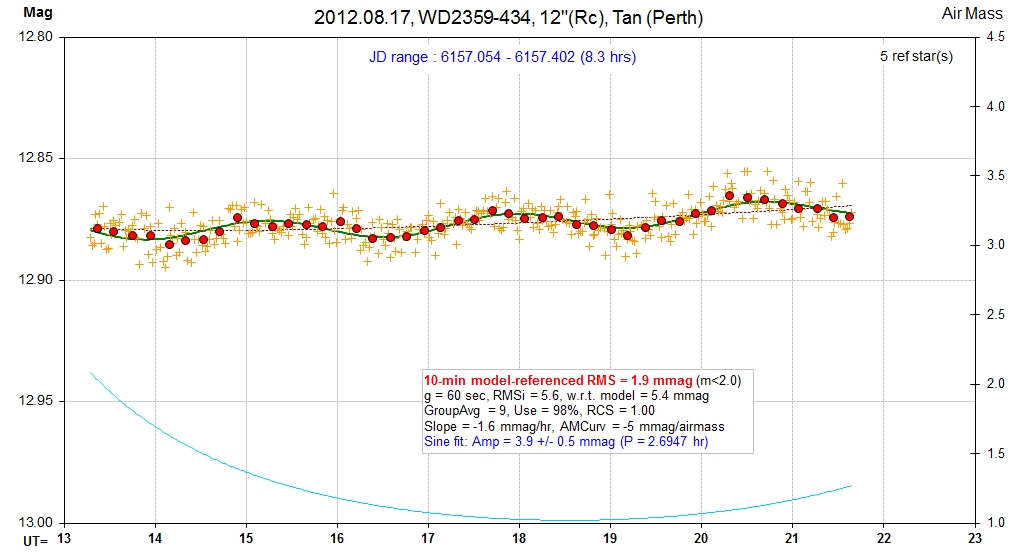
20120817 6157.054 - 6157.402 8.3 hrs Rc Tan 1.9 mmag, 3.9 ± 0.5 mmag
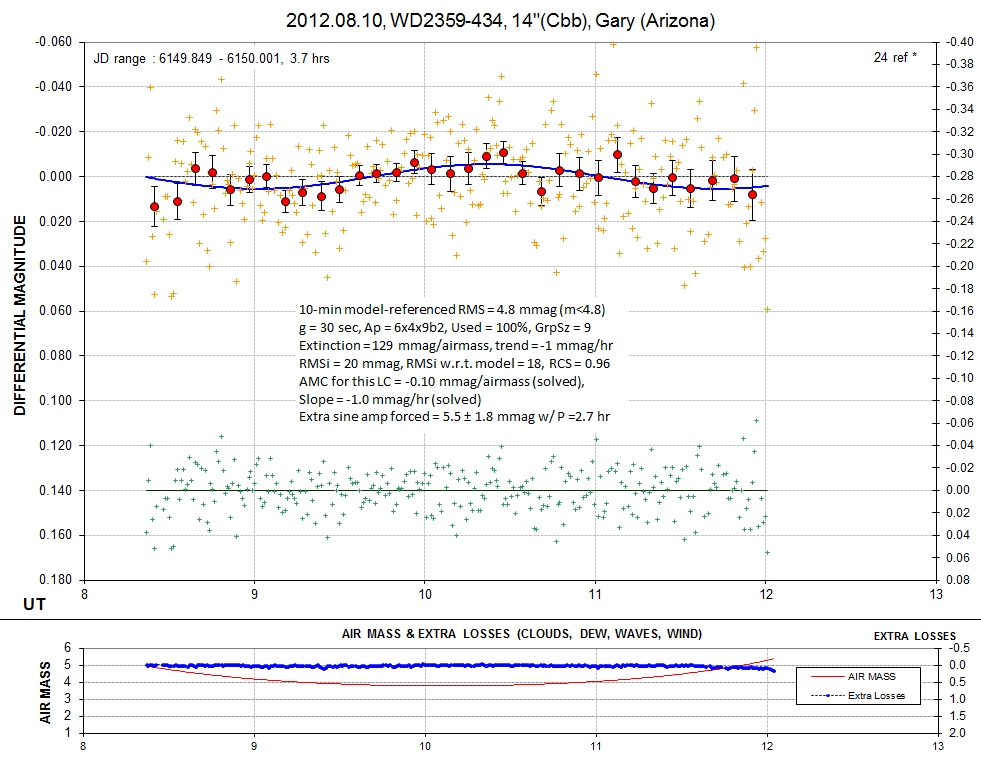
20120810 6149.849 - 6150.001 3.7 hrs Cbb Gary 4.8 mmag, 5.5 ± 1.8 mmag
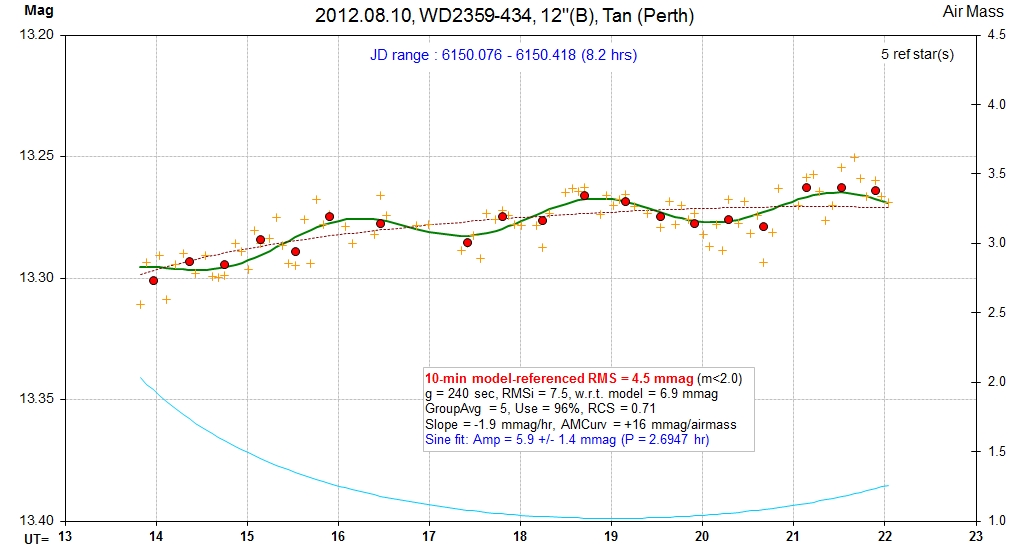
20120810 6150.076 - 6150.418 8.2 hrs B Tan 4.5 mmag, 5.9 ± 1.4 mmag
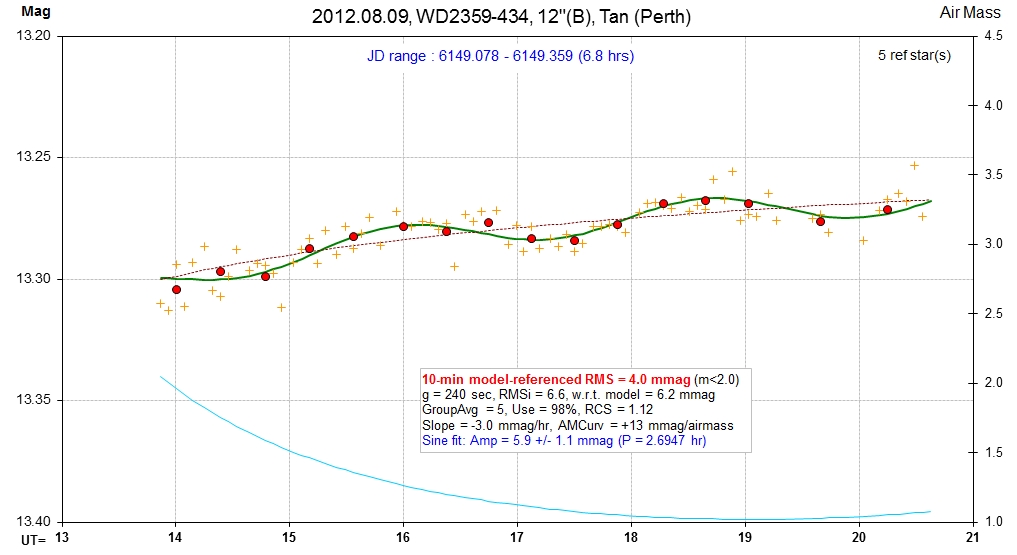
20120809 6149.078 - 6149.359 6.8 hrs B Tan 4.0 mmag, 5.9 ± 1.1 mmag
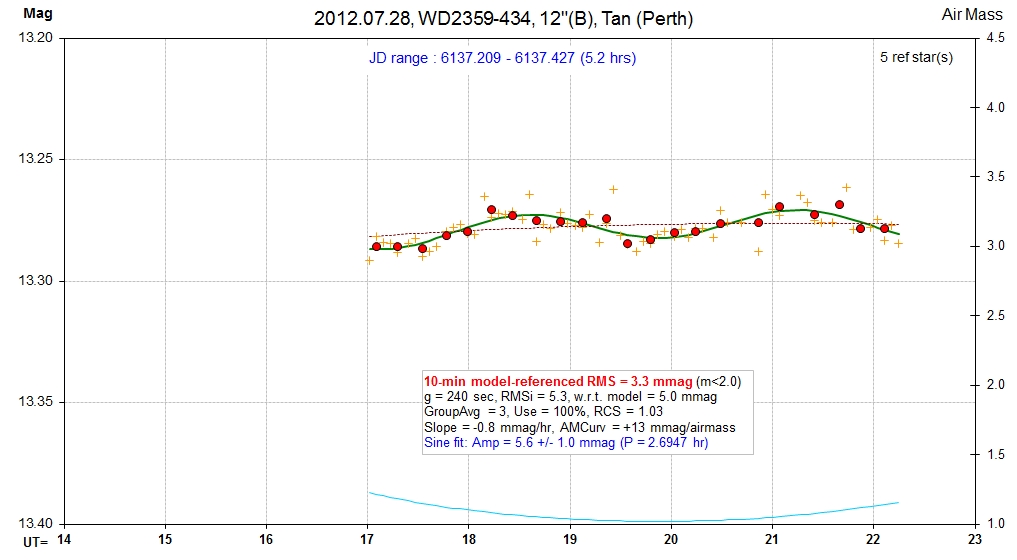
20120728 6137.209 - 6137.427 5.2 hrs B Tan 3.3 mmag, 5.6 ± 1.0 mmag
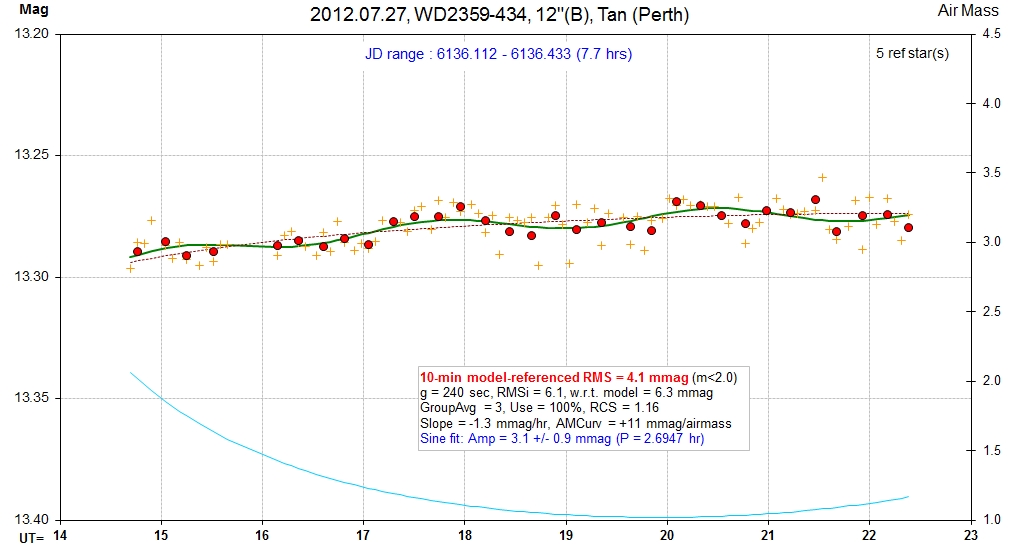
20120727 6136.112 - 6136.433 7.7 hrs B Tan 4.1 mmag, 3.1 ± 0.9 mmag
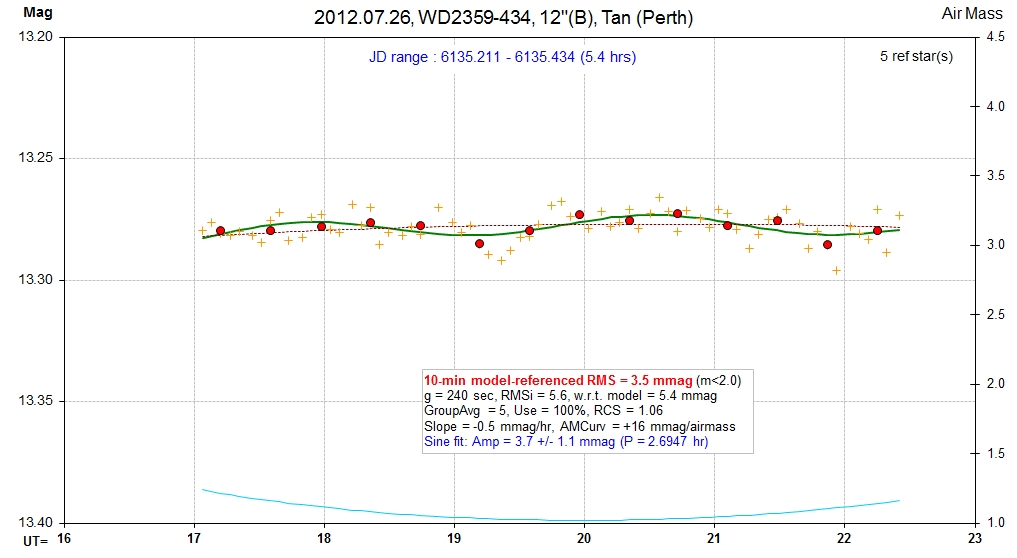
20120726 6135.211 - 6135.434 5.4 hrs B Tan 3.5 mmag, 3.7 ± 1.1 mmag
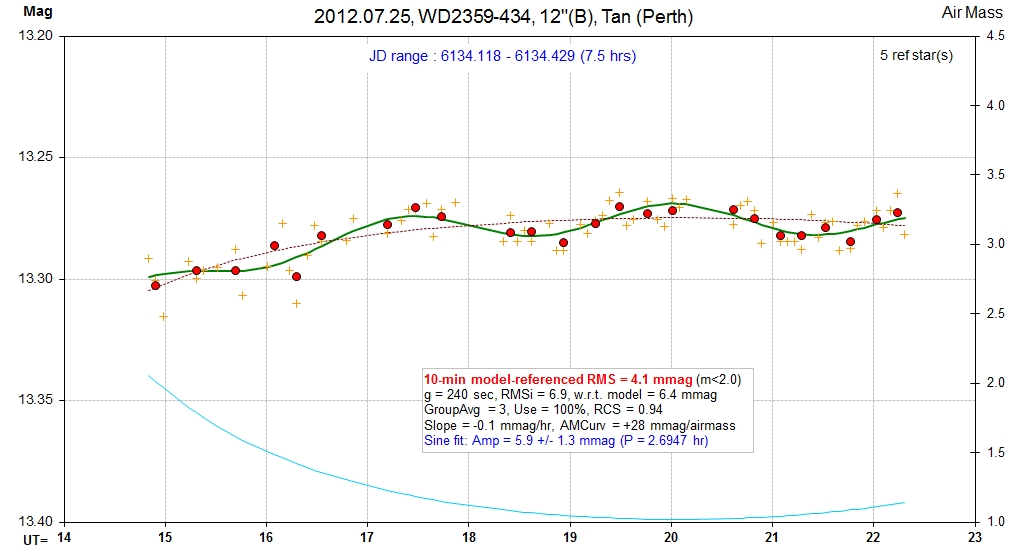
20120725 6134.118 - 6134.429 7.5 hrs B Tan 4.1 mmag, 5.9 ± 1.3 mmag
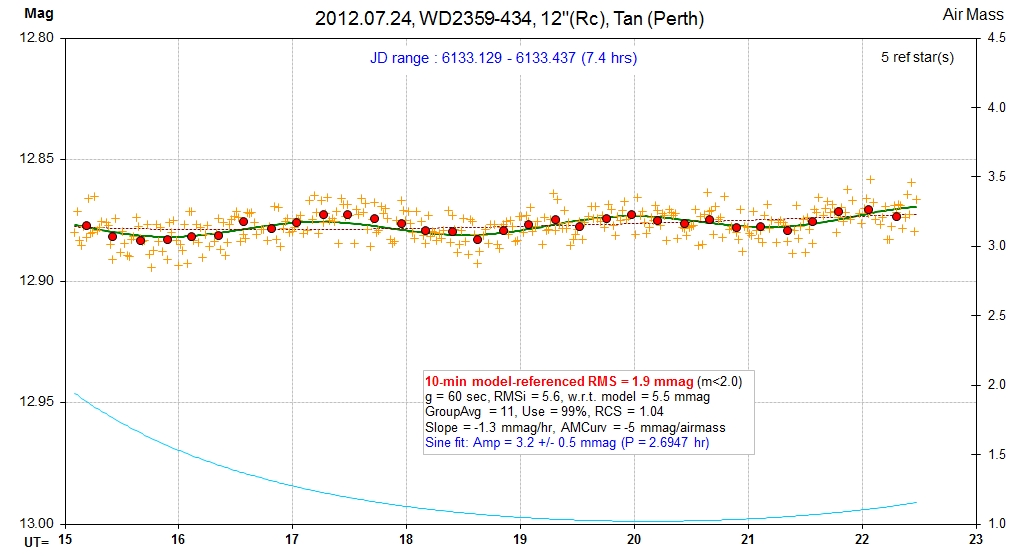
20120724 6133.129 - 6133.437 7.4 hrs Rc Tan 1.9 mmag, 3.2 ± 0.5 mmag
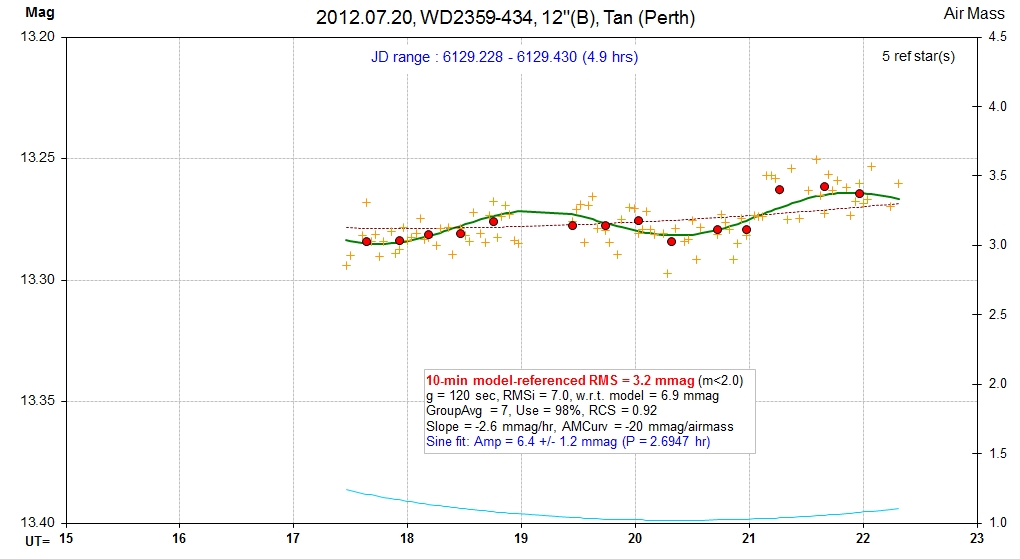
20120720 6129.228 - 6129.430 4.9 hrs B Tan 3.2 mmag, 6.4 ± 1.2 mmag
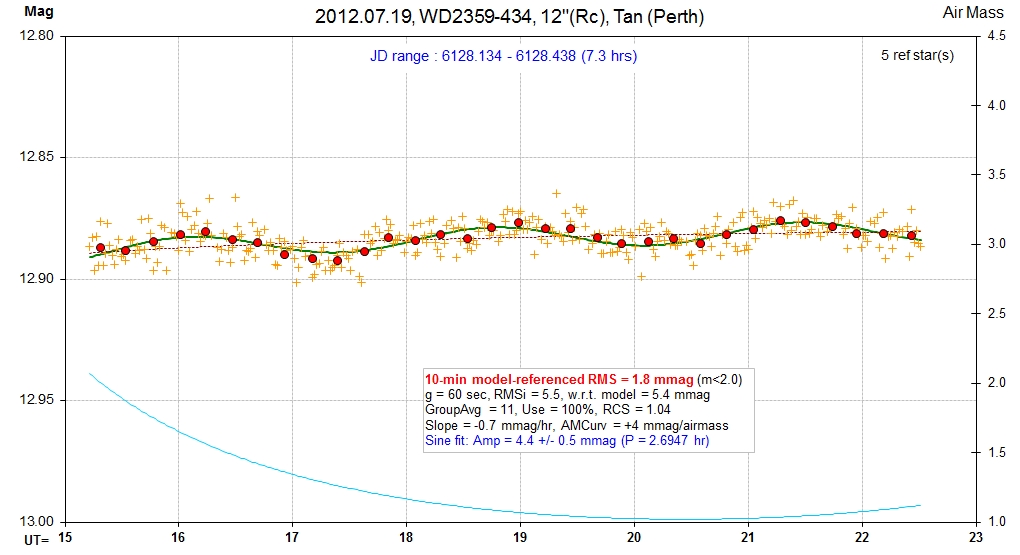
20120719 6128.134 - 6128.438 7.3 hrs Rc Tan 1.8 mmag, 4.4 ± 0.5 mmag
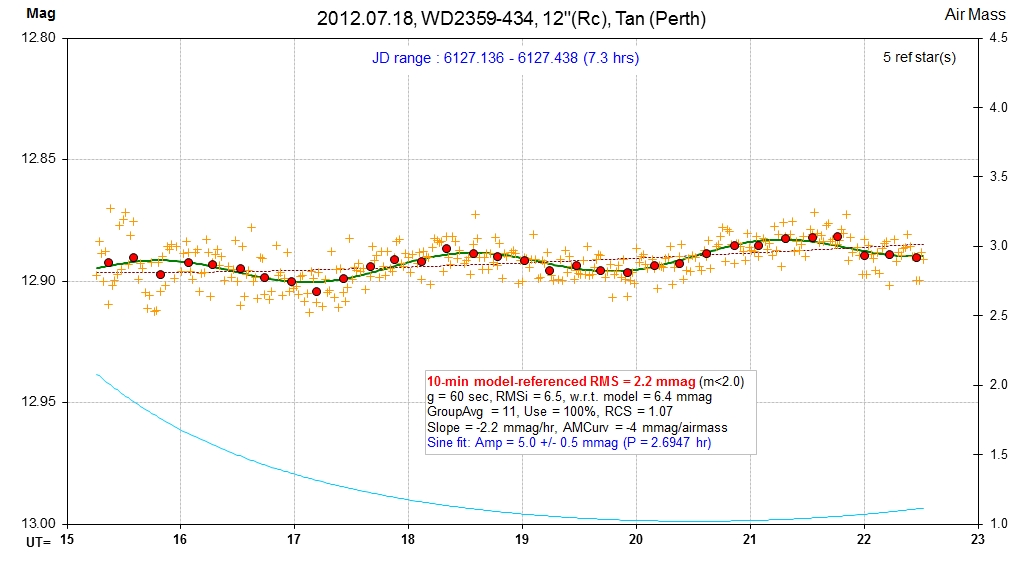
20120718 6127.136 - 6127.438 7.3 hrs Rc Tan 2.2 mmag, 5.0 ± 0.5 mmag
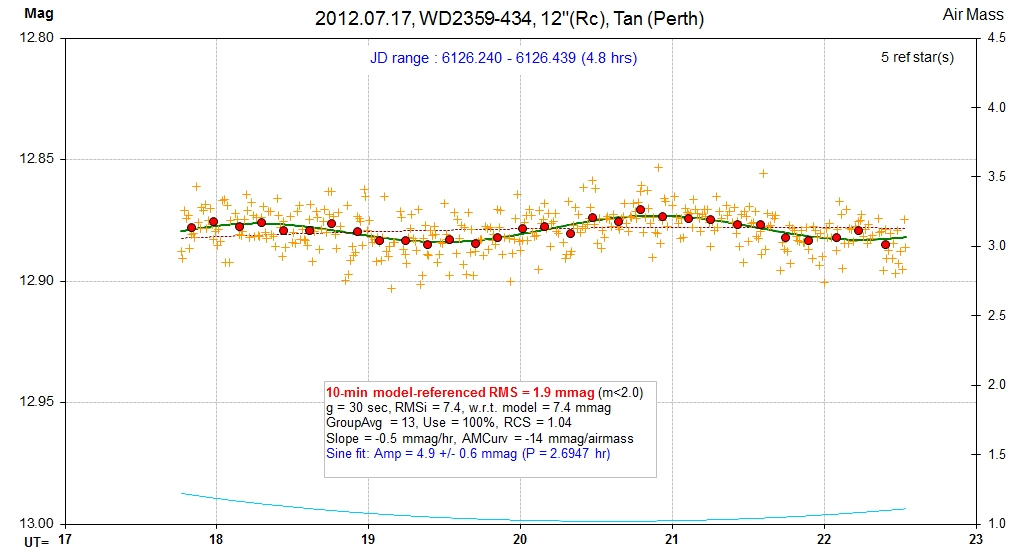
20120717 6126.240 - 6126.439 4.8 hrs Rc Tan 1.9 mmag, 4.9 ± 0.6 mmag
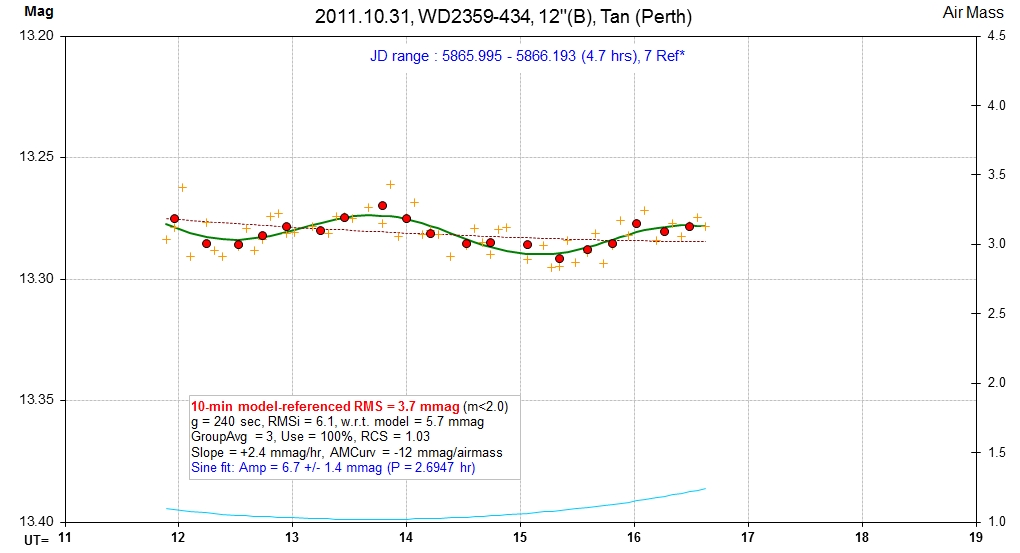
20111031 5865.995 - 5866.193 4.7 hrs B Tan 3.7 mmag, 6.7 ± 1.4 mmag (adopt 2.7 hrs)
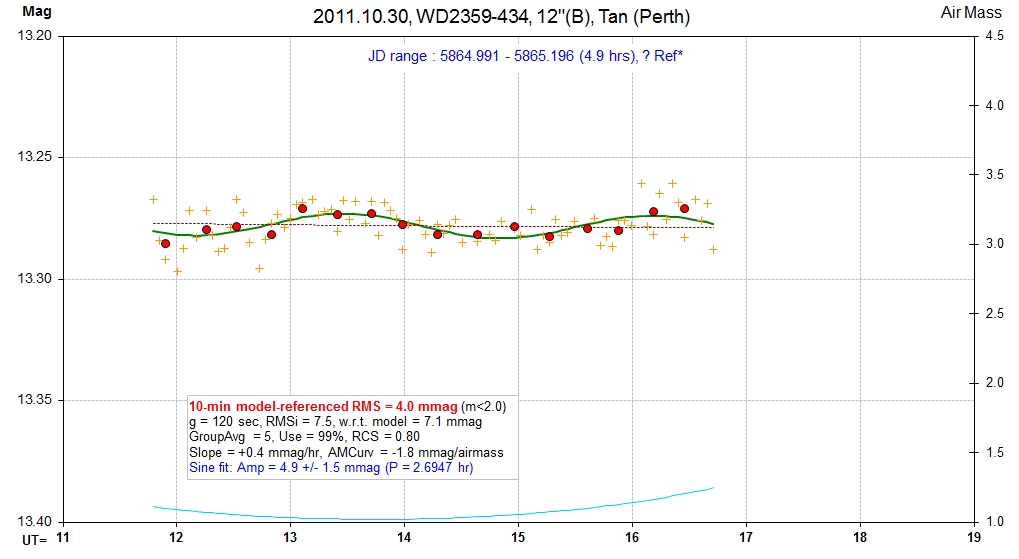
20111030 5864.991 - 5865.196 4.9 hrs B Tan 4.0 mmag, 4.9 ± 1.5 mmag (adopt 2.7 hrs)
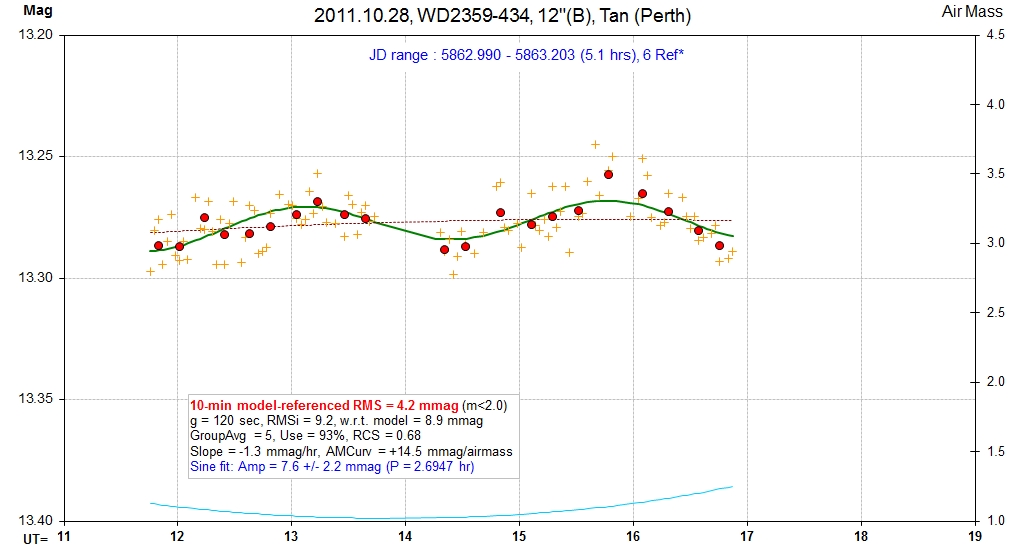
20111028 5862.990 - 5863.203 5.1 hrs B Tan 4.2 mmag, 7.6 ± 2.2 mmag (adopt 2.7 hrs)
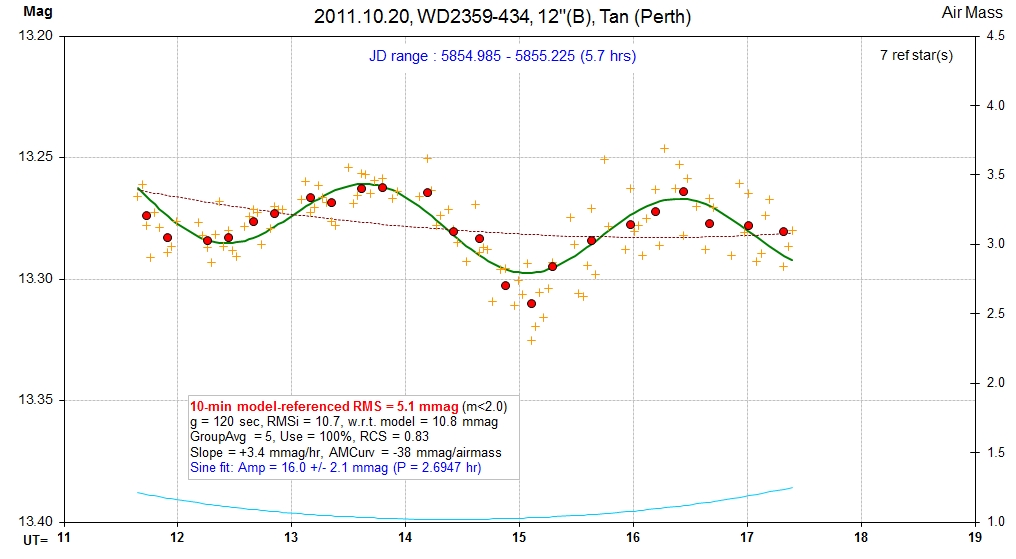
20111020 5854.985 - 5855.225 5.7 hrs B Tan 5.1 mmag, 16.0 ± 2.1 mmag (adopt 2.7 hrs)
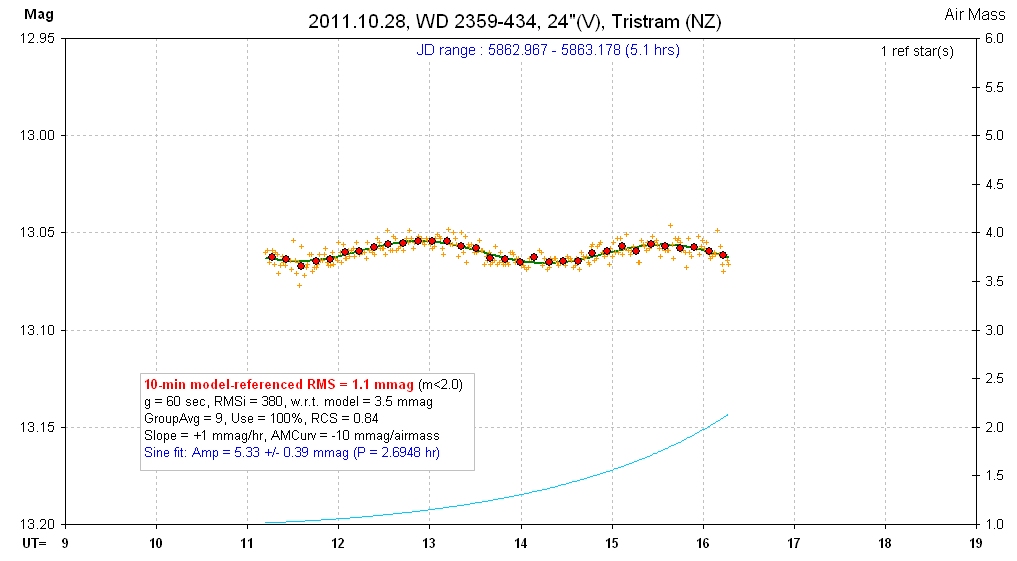
20111028 5862.967 - 5863.178 5.1 hrs V Fukui/Tristram 1.1 mmag, 5.3 ± 0.4 mmag (adopt 2.7 hrs)
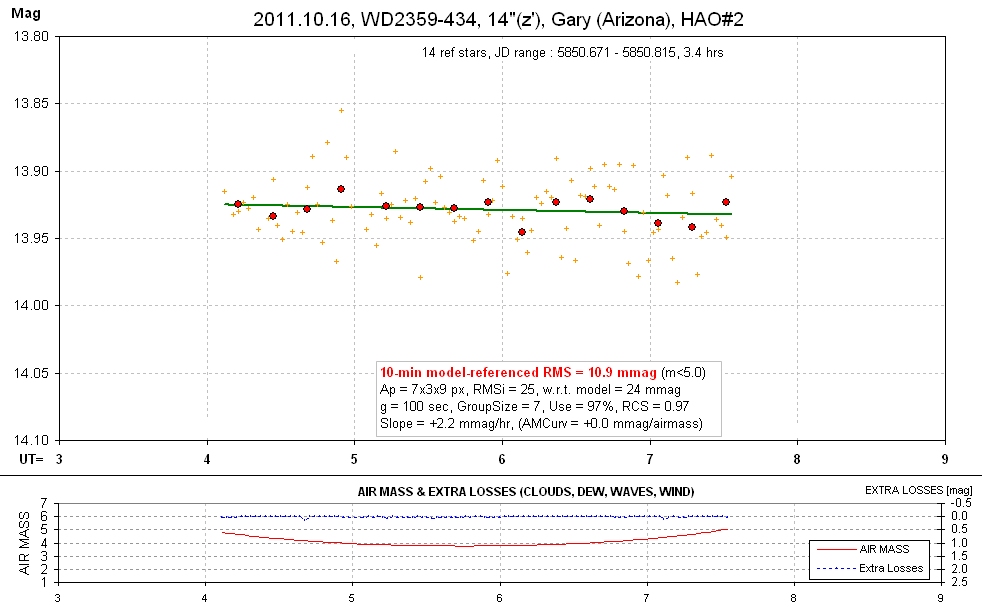
20111016 5850.671 - 5850.815 3.4 hrs z' Gary 10.9 mmag, too noisy for evaluating sinusoidal variation.
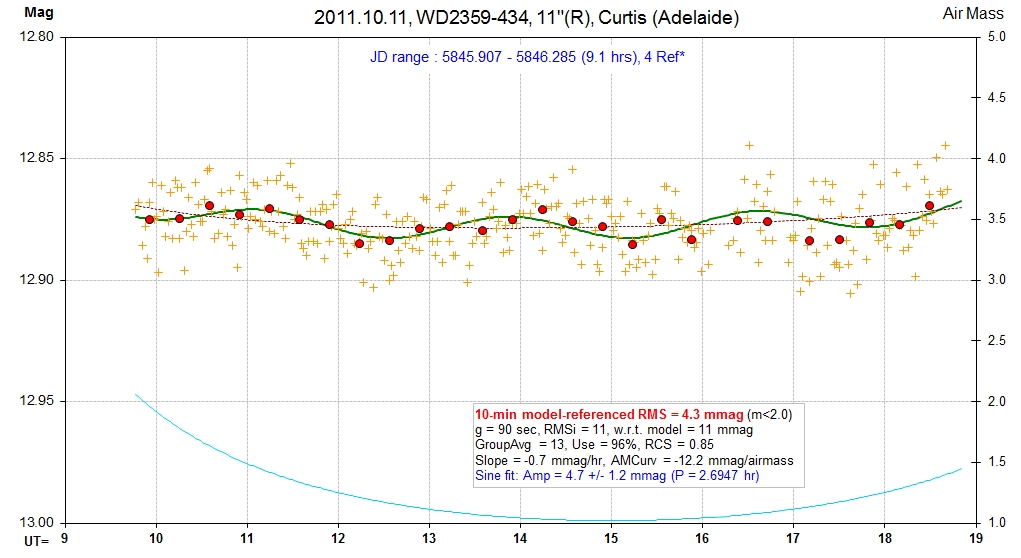
20111011 5845.907 - 5846.285 9.1 hrs R Curtis 3.8 mmag, 4.6 ± 1.0 mmag (adopt 2.7 hrs)
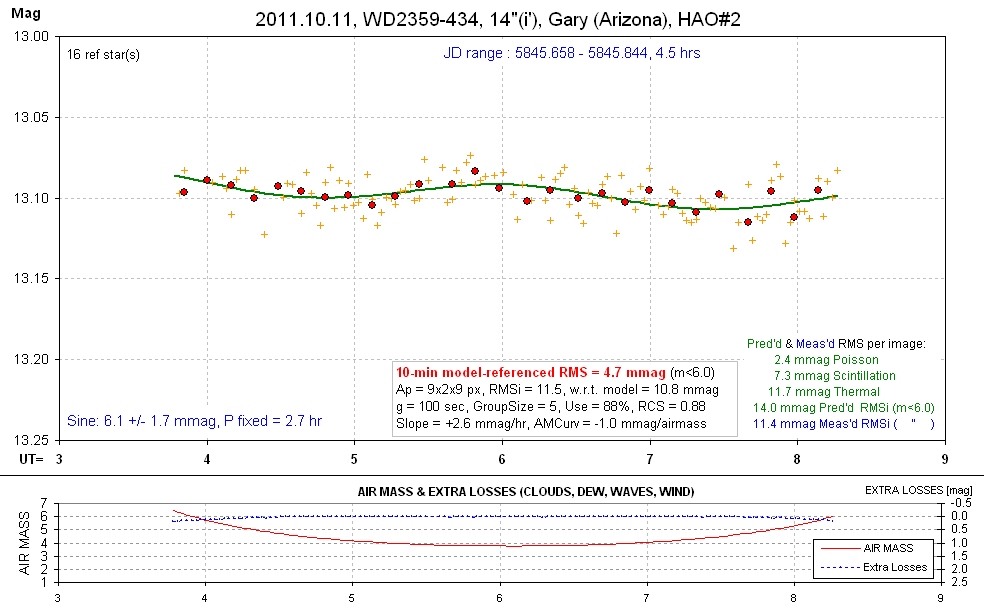
20111011 5845.658 - 5845.844 4.5 hrs i' Gary 4.7 mmag, 6.1 ± 1.7 mmag (adopt 2.7 hrs)
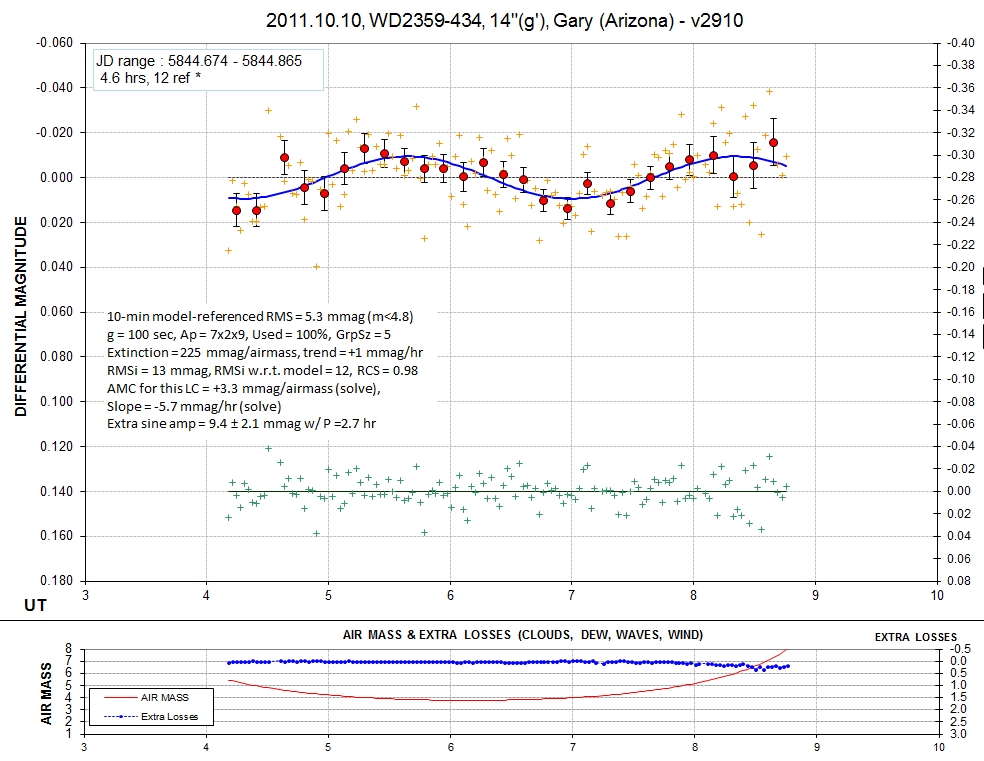
20111010 5844.674 - 5844.865 4.6 hrs g' Gary 5.3 mmag, 9.4 ± 2.1 mmag (adopt 2.7 hrs)
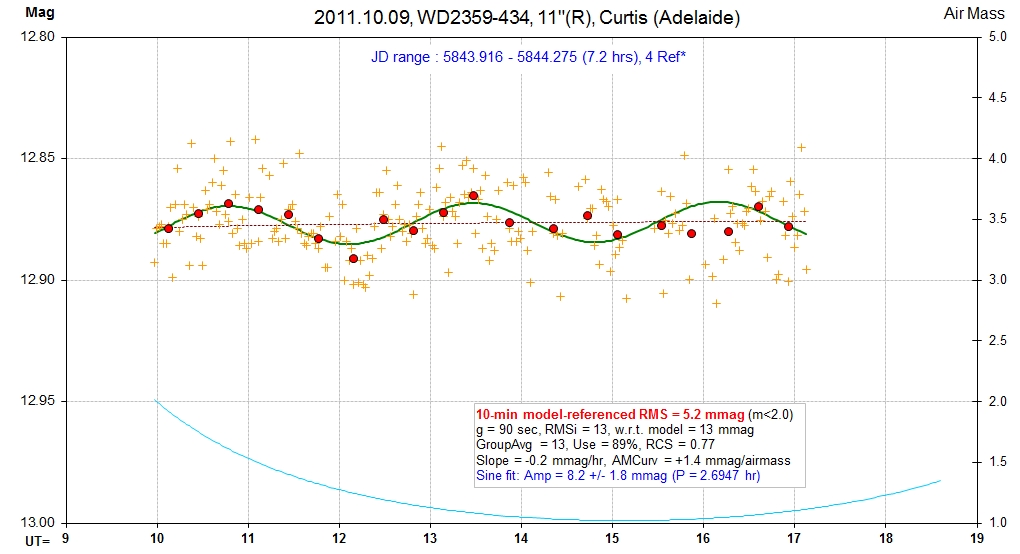
20111009 5843.916 - 5844.275 4.0 hrs R Curtis 3.7 mmag, 9.6 ± 1.6 mmag (adopt 2.7 hrs)
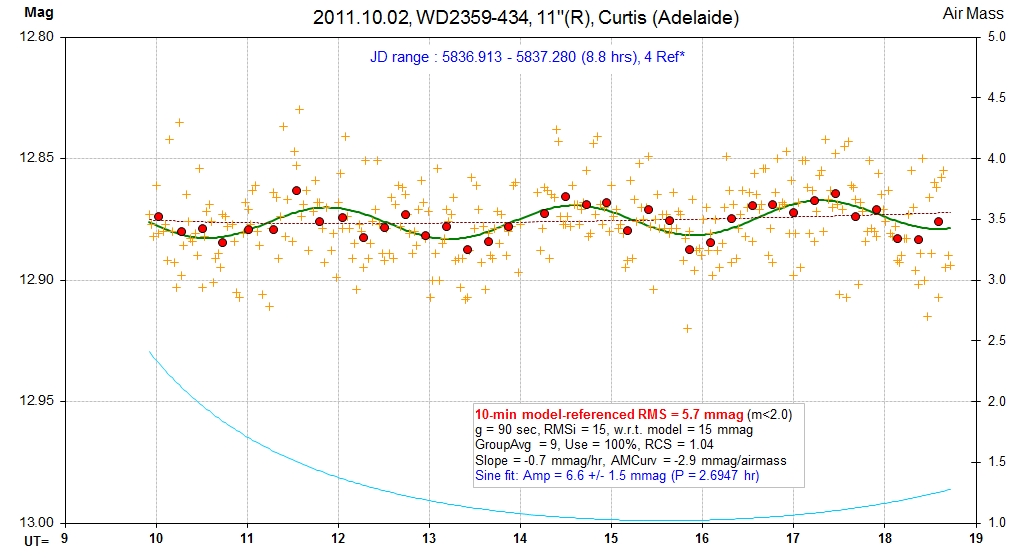
20111002 5836.913 - 5837.280 8.8 hrs R Curtis 5.7 mmag, 6.6 ± 1.5 mmag (adopt 2.7 hrs)
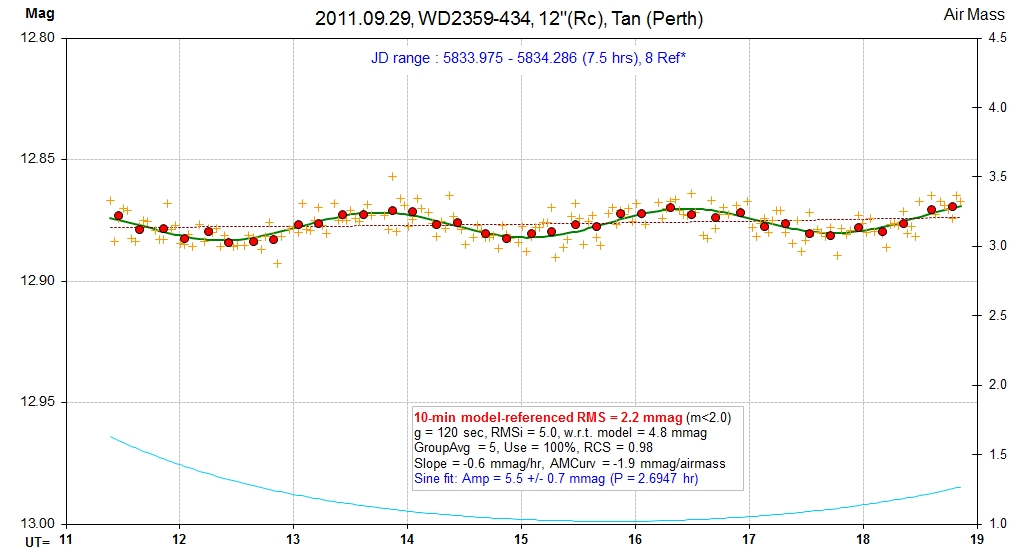
20110929 5833.975 - 5834.286 7.5 hrs Rc Tan 2.2 mmag, 5.5 ± 0.7 mmag (adopt 2.7 hrs)
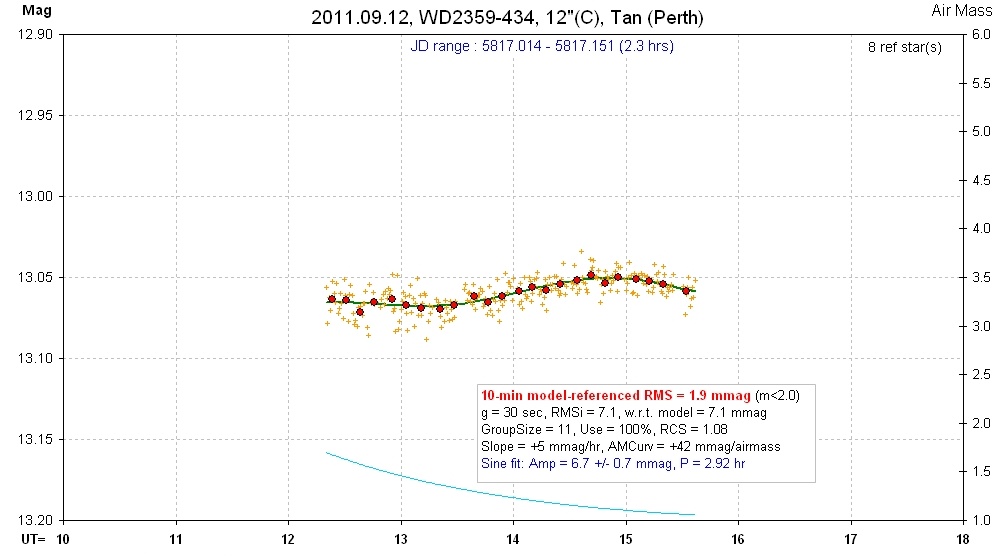
20110912 5817.014 - 5817.151 2.3 hrs C Tan 1.9 mmag, 6.7 ± 0.7 mmag, 2.92 hrs
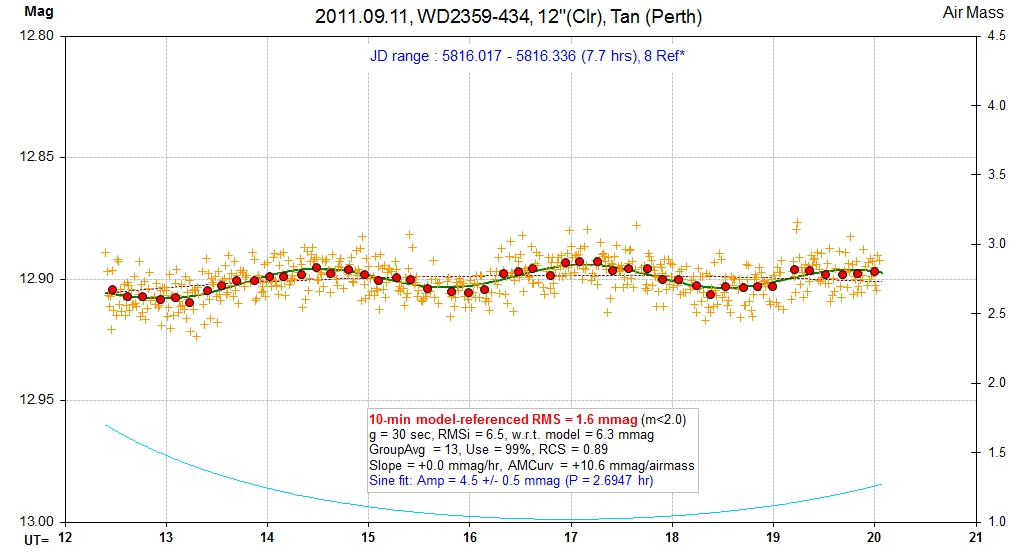
20110911 5816.017 - 5816.336 7.7 hrs C Tan 1.6 mmag, 4.5 ± 0.5 mmag, (adopt 2.7 hrs)
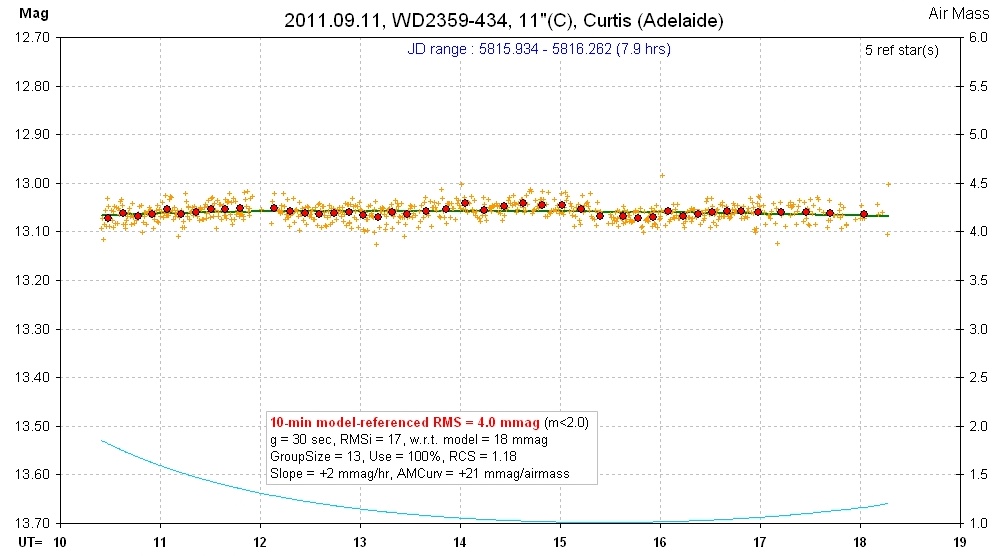
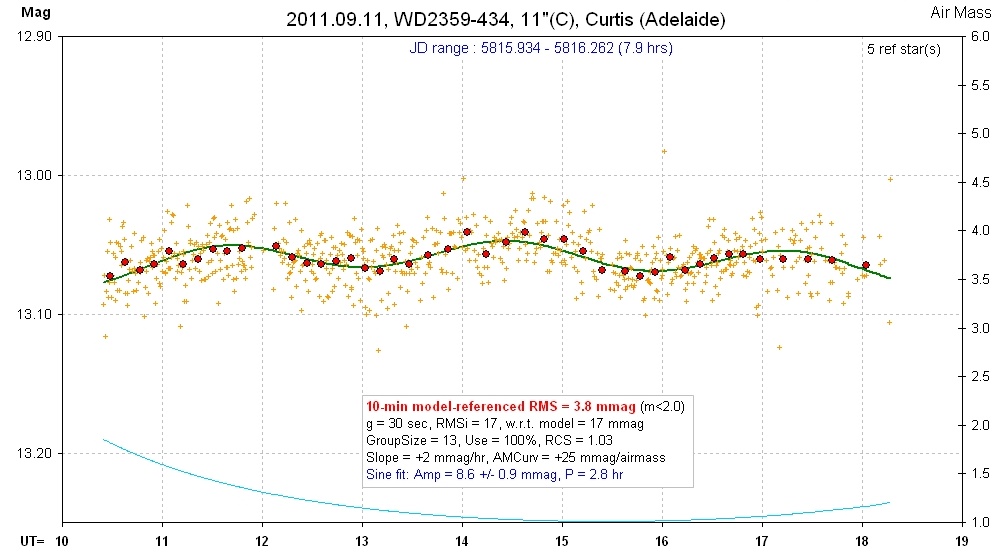
20110911 5815.934 - 5816.262 7.9 hrs Cbb Curtis 3.8 mmag, 8.6 ± 0.9 mmag, 2.8 hrs
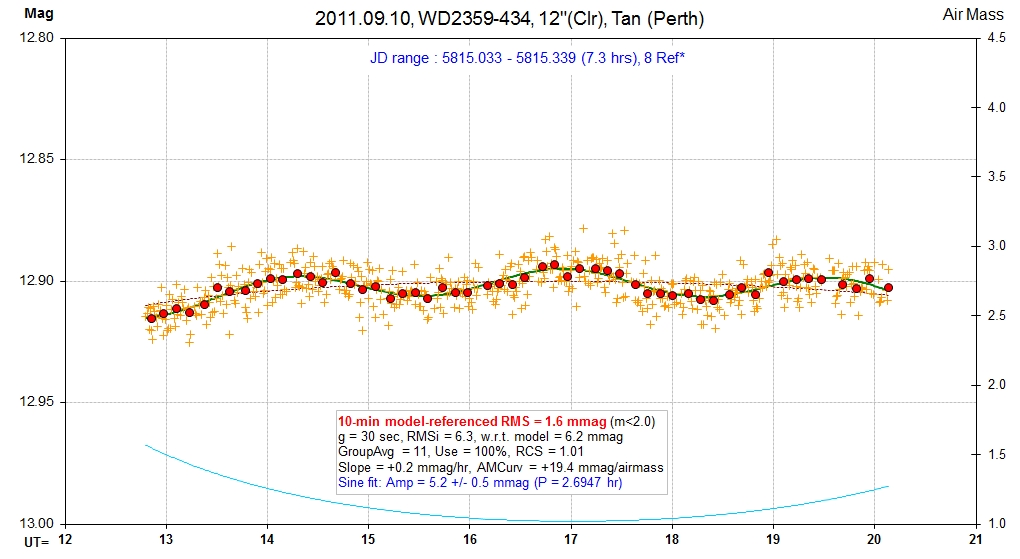
20110910 5815.033 - 5815.339 7.3 hrs C Tan 1.6 mmag, 5.2 ± 0.5 mmag, (adopt 2.7 hrs)
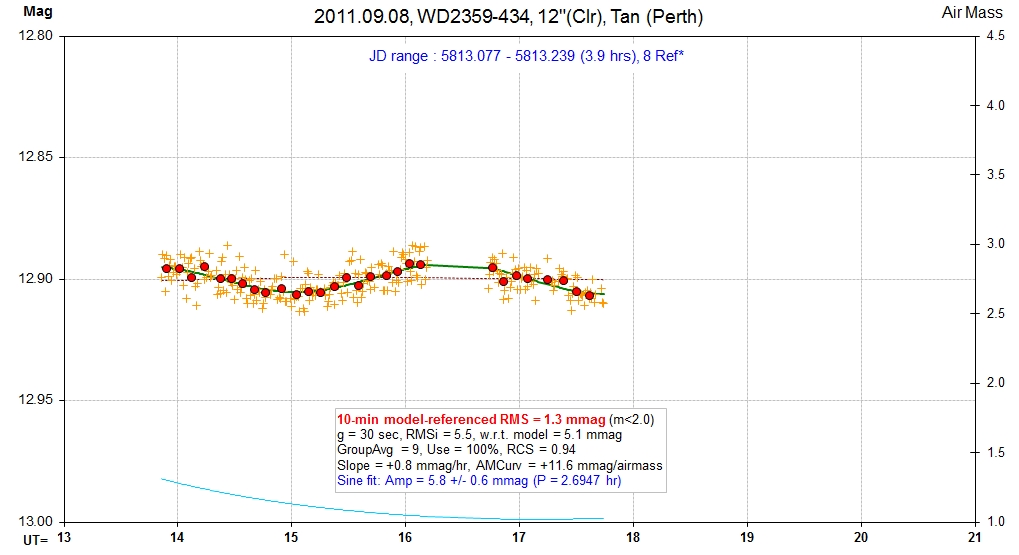
20110908 5813.077 - 5813.239 3.9 hrs C Tan 1.3 mmag, 5.8 ± 0.6 mmag, (adopt 2.7 hrs)
20110908 5813.102 - 5813.253 3.6 hrs C Fukui/Tristram 0.9 mmag, slight fade lasting ~ 40 min, hint of sine
Light Curves
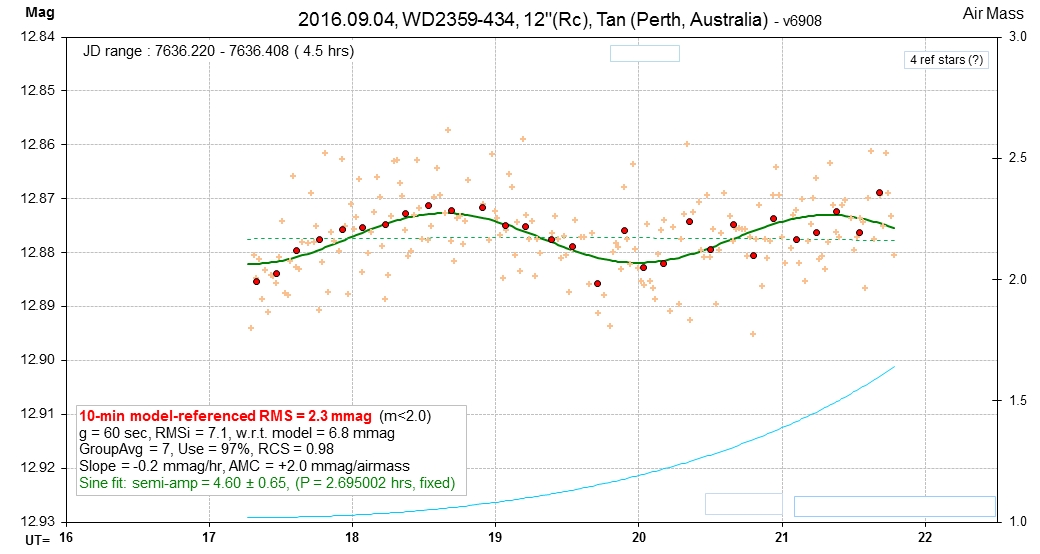
First LC in 2 years, showing that amplitude of variation is recovering.
_______________________________________________________ New Season 2014 ___________________________________________________
data
data
data Some cloud outages.
data
data This is the first LC of the 2013 observing season.
___________________________________________ GAP BETWEEN SEASONS ___________________________________________________
oot
oot
oot
oot
oot
oot
oot
oot
oot
oot
oot
oot Since peak occurs near lowest air mass the AMC and amplitude parameters mimic each other too much for either solution to be useful.
oot
oot
oot Forgot to synch dome with telescope!
oot
oot
oot
oot
oot
oot
oot
oot
oot
oot
oot
oot
oot
oot
SEASON CHANGE
oot
oot
oot
oot
raw spo
Avg should be ~ 13.11
oot
spo
oot
______________________________________________________________________________________________________________________________
oot
______________________________________________________________________________________________________________________________
oot
______________________________________________________________________________________________________________________________
oot
______________________________________________________________________________________________________________________________
raw spo
______________________________________________________________________________________________________________________________
oot
______________________________________________________________________________________________________________________________
raw spo Filter should be "Cbb" (Clear with blue-blocking).
Nice sinusoid with period compatible with those by observer Tan. Filter should be "Cbb" - which may account for higher amplitude.
______________________________________________________________________________________________________________________________
oot
For me this is "the clincher"! A sinusoidal variation is definitely present in this LC, and Tan has shown (in a PDF document) that it phases well with the sinusoidal variation he found in his LC from Sep 8.
_____________________________________________________________________________________________________________________________
oot
Hey, this looks real! It's in the "maybe/real" boundary of my spurious amplitude plot. And the kicker is that it overlaps with the Tristram/Fukui LC (below) and shows the same structure! The 1.3 mmag noise level is also amazing!
_____________________________________________________________________________________________________________________________
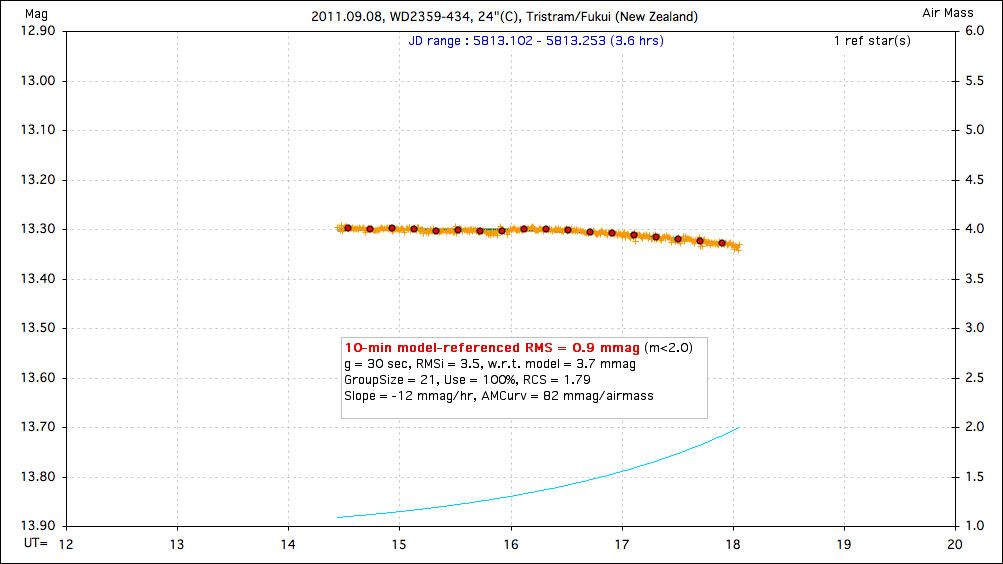
raw spo Notice the unprecedented low noise, RMS10 = 0.9 mmag!
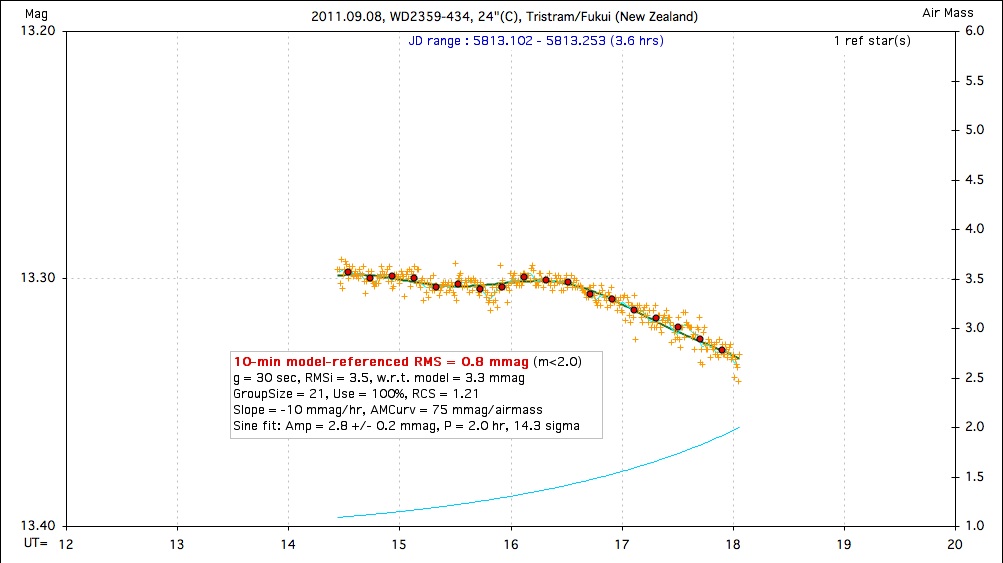
Observer comment: There were a few thin clouds and the seeing was quite bad so I used a large photometry aperture. In spite of Akihiko Fukui's assessment "The B&C light curve doesn't seem to show such a sinusoidal pattern for me." I think this LC is compatible with Tan's when you take into account the way my model fitting's use of trend and air mass curvature can mimic a sinusoidal variation (especially when the observing session length is comparable to the putative periodicity).
Finder Images
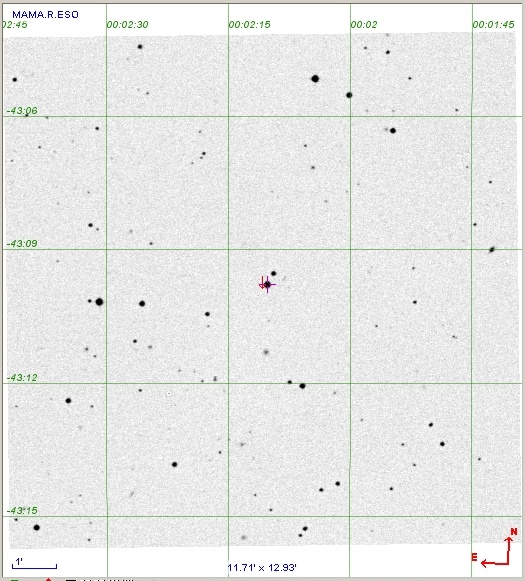
Aladin image. The WD is moving fast, to the southeast (lower-left). It might still be too close to the nearby star that it passes a few years ago.
RV Measurements
Maxted & Marsh, 2000 (link) list 8 RV measurements taken during 1997 August 15 and 18. I have plotted them folded with a 2.7-hour period, shown below:
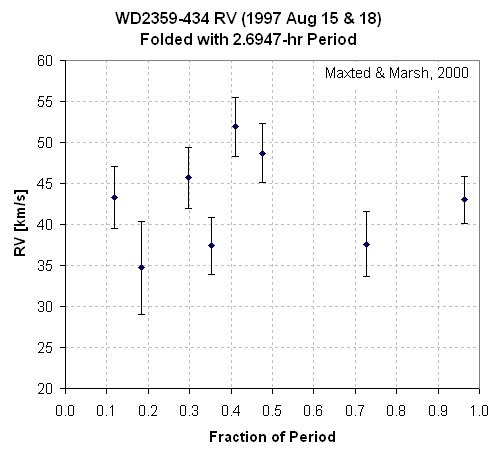
Maxted & Marsh RV measurements folded with 2.7-hr period.
Close binaries have RV variations of order 150 km/s (P<10 hr), so the WD2359-434 upper limit RV variation of ~ 5 km/s means that any companion must have a mass < ~ 0.03 Msun (30 Mjup).
References
Aznar Cuadrado et al, 2004, A&A, 423, 1081-1094, arXiv link
Gary et al, 2013, SAS, "Searching for White Dwarf Exoplanets: WD 2359-434 Case Study"
Lajoie & Bergeron, 2007, ApJ, 667, 1126-1138, web page link
Maxted, P.F.L. & T.R. Marsh, 2008, MNRAS, PDF link
Napiwotzki et al, 2003, ESO-Messenger, 112, 25, PDF link
PAWM home page