Comet ISON Observations by Three Non-Professional Observers
Webmaster: Bruce Gary, Last Update 2014.10.01 (links)
This website is a record of observations of Comet C/2012 S1 (ISON) by amateurs Bruce Gary, Dennis Whitmer and Tom Kaye, using 11-inch, 14-inch and 32-inch telescopes, respectively. We live a few miles from each other in Hereford Arizona. When I was the first to obtain a "recovery image" of the comet on August 12, after it had been unobservable during June/July, and when I noted that it was fainter than expected, an unexpected amount of publicity for this web page occurred. I therefore felt obligated to maintain this web site with observations and analyses worthy of that attention. My long-term goal used to be a monitoring of the coma by measuring brightness versus diameter at 3 wavelengths (g'r'i') with a goal of detecting brightness outbursts caused by temperature-dependent volatile activity. Measurements on several dates in August (after reappearing from behind the sun) showed that the comet's inner coma was brightening at a lower rate than expected, as if the activity level on the nucleus surface was not changing (or at times even decreasing), in spite of it continuing to approach the sun. A few of investigators suggested that there may be a late "coming alive" for this particular comet, whereas another suggests that it may fade abruptly in early November. This web page was meant for other amateur astronomers and sane lay people readers. Conspiracy-minded readers: Please do not e-mail me to ask if Comet ISON poses a danger to Earth; it doesn't. Professional astronomer readers: Any use of data on this web page is at your own risk; keep in mind that the measurements and analyses were performed by amateurs.
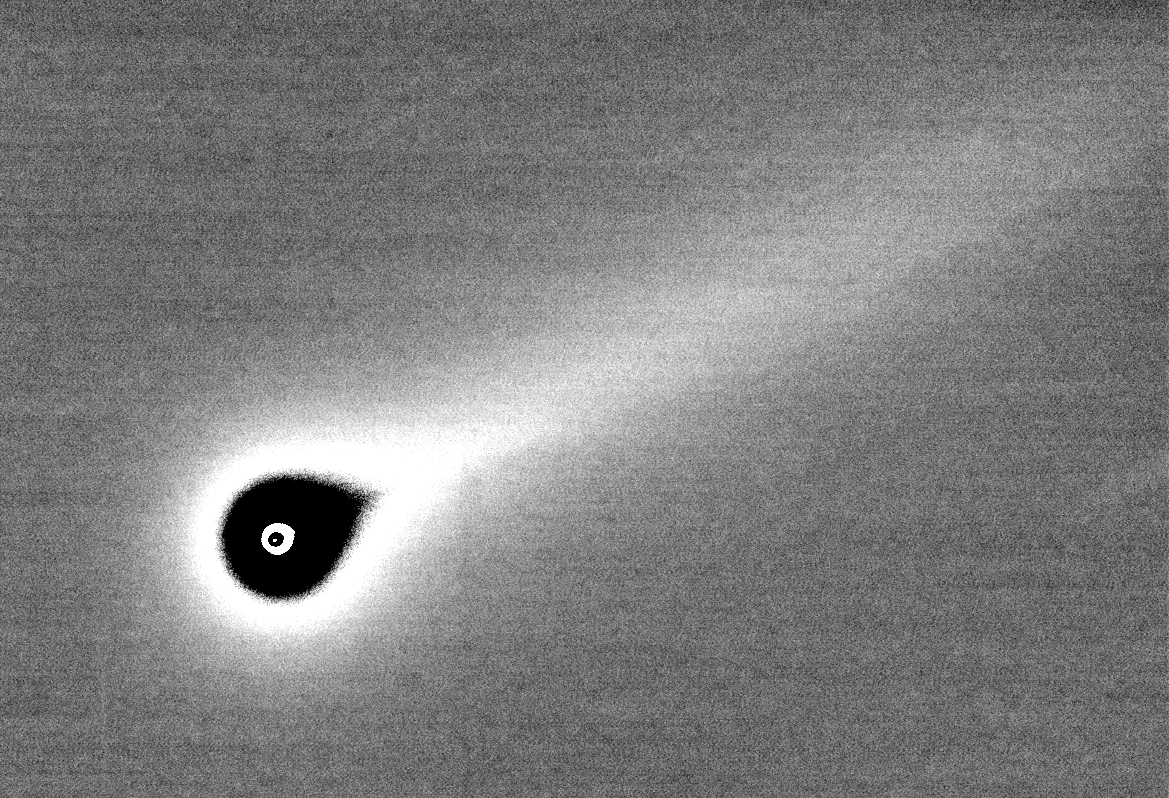
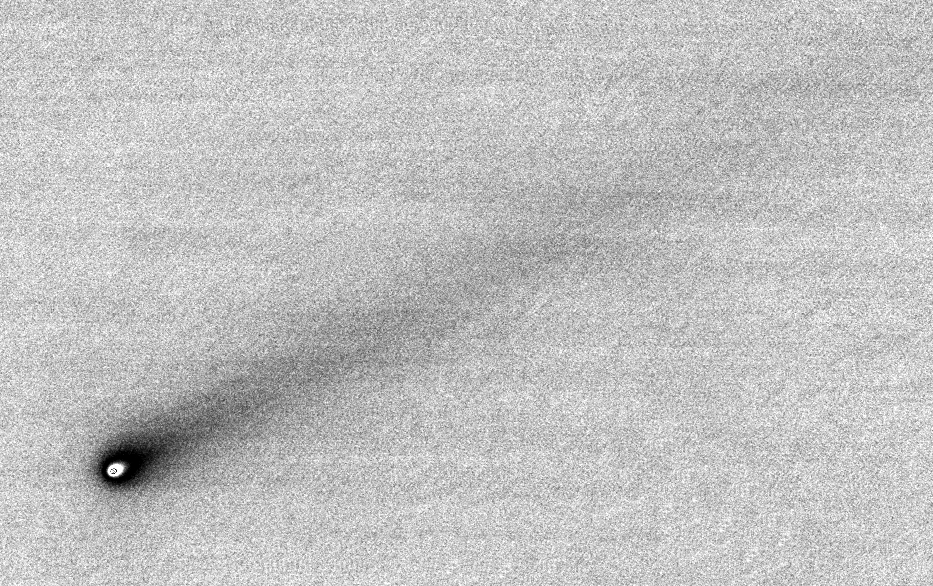
November 14 animation made by Bruce Gary using a Celestron 11-inch telescope. Filamentary structure can be seen moving away from the sun at high speed. The motion of jets that can be seen first on the side is backwards and toward the center of the tail; this must be cause by the pattern of solar wind enveloping the coma and coming back together on the back side (just my amateur speculation). The presence of many jet-like structures in the outer coma and tail show that there are many sources for gas-driven dust on the nucleus surface. (The coma isn't changing size; it just appears that way due to the contrast/brightness adjustments that were needed to keep the tail looking the same.)
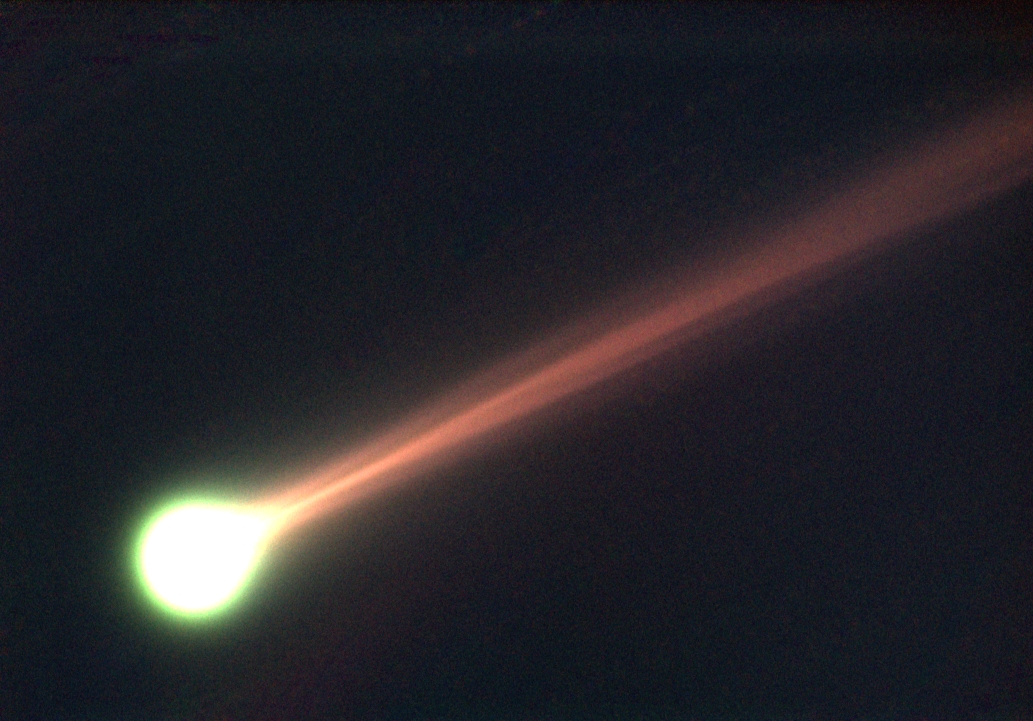
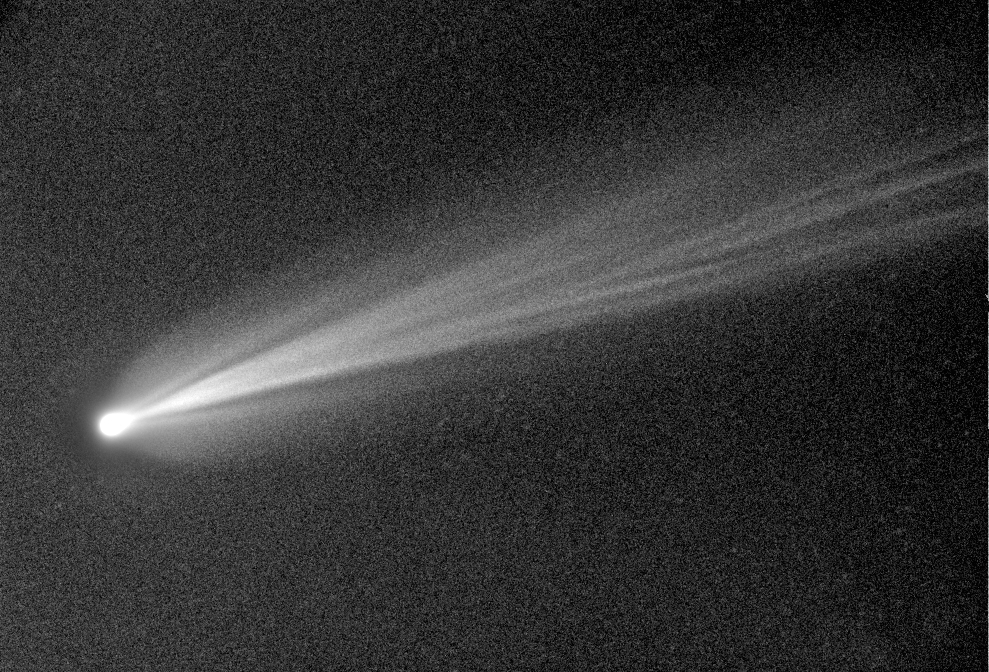
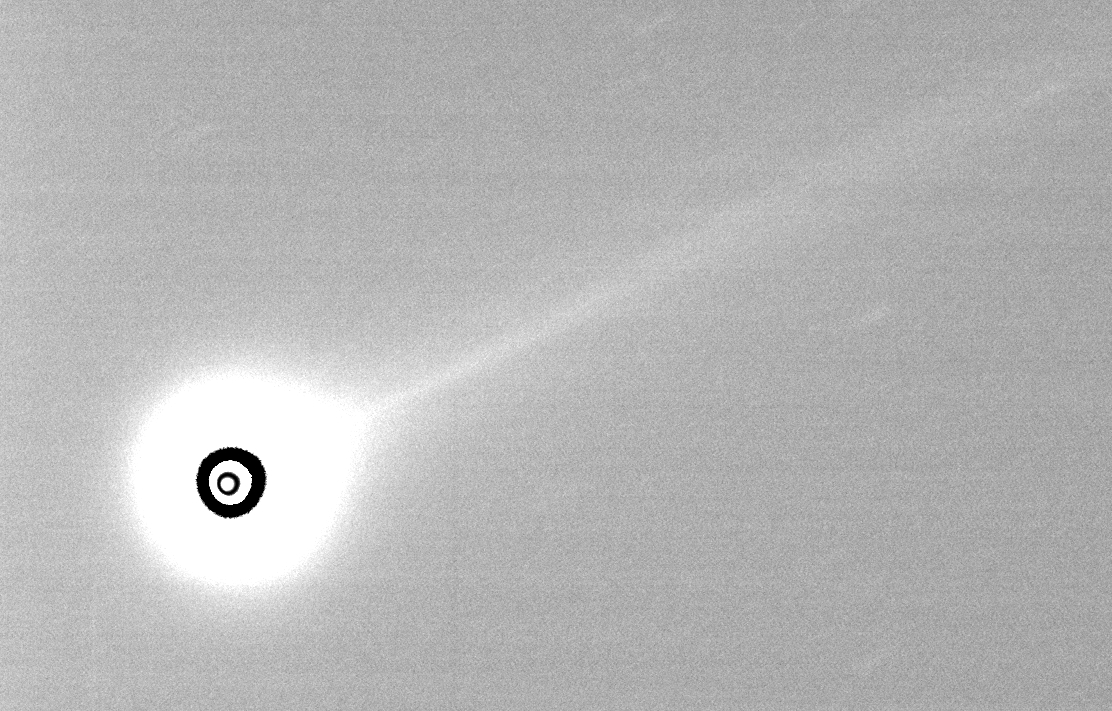
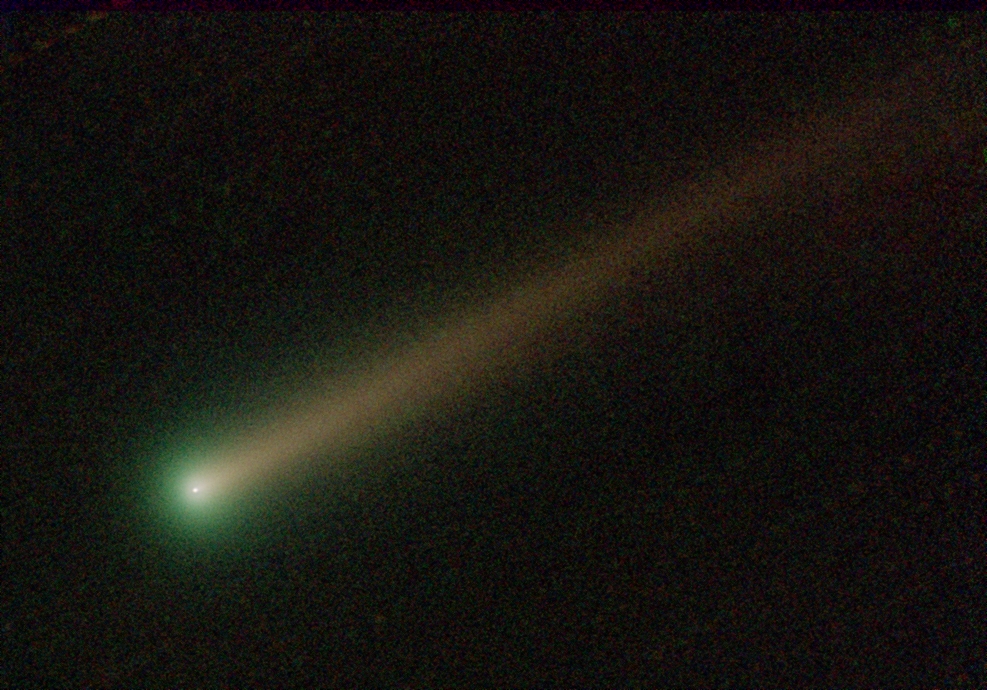
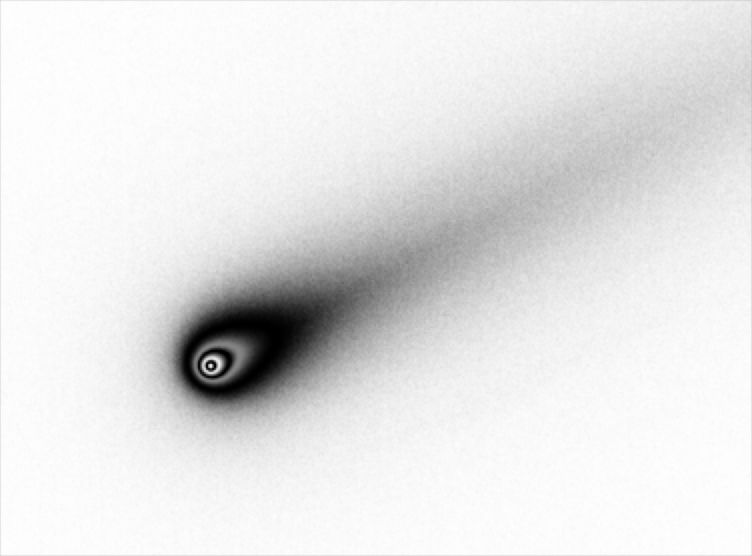
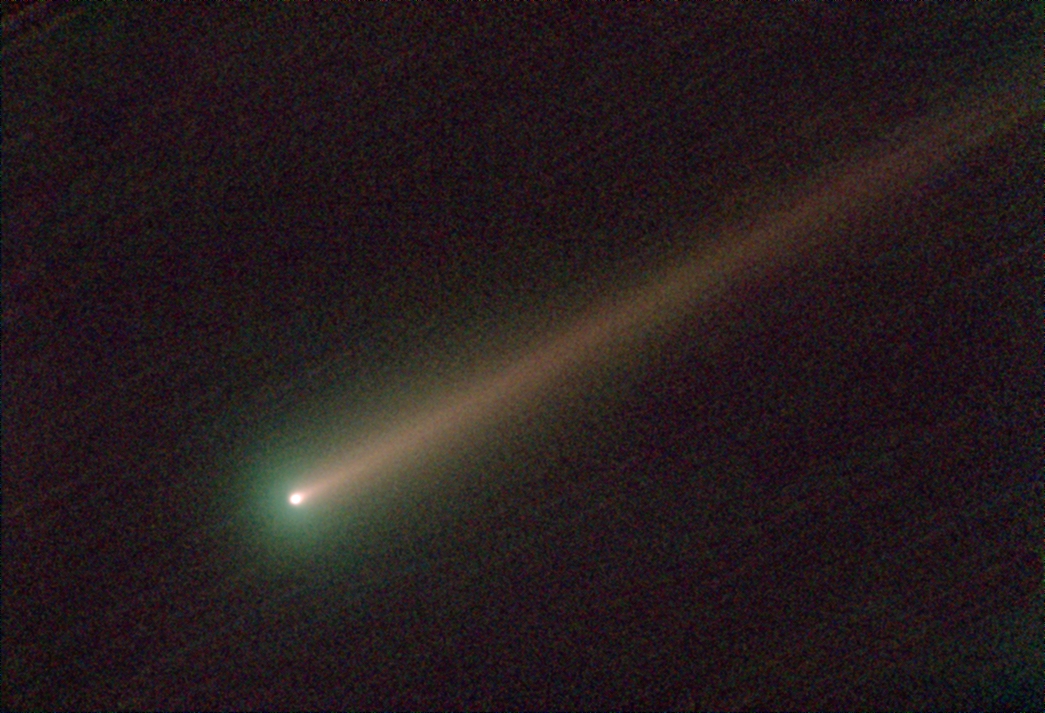
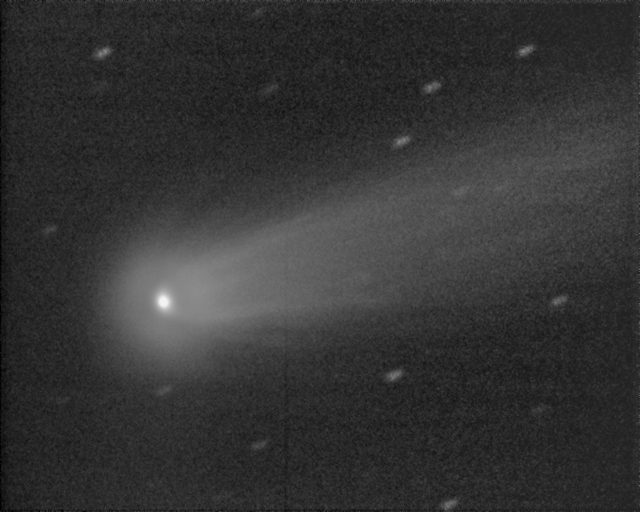
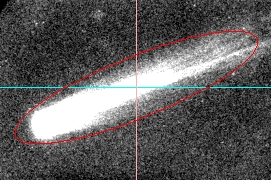
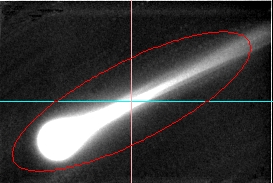
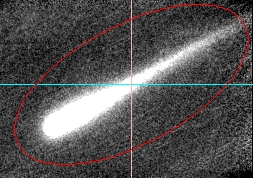
True color image based on 39 B-band, 34 V-band and 29 r'-band images, 20-second exposures, using a 11-inch Celestron telescope. FOV = 32 x 21 'arc, north up, east left. Green is due to molecular emission and red is due to dust reflecting sunlight with red-colored dust albedo spectrum.
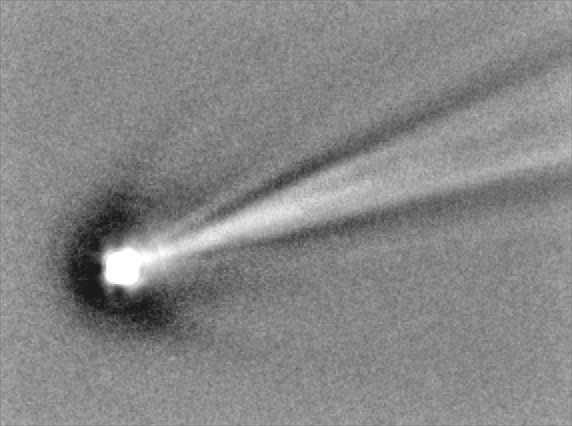
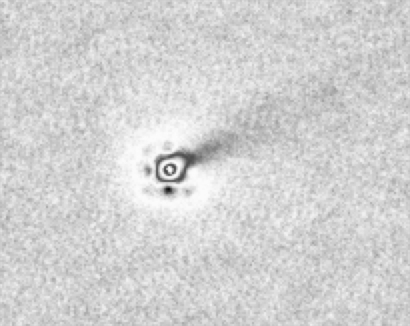
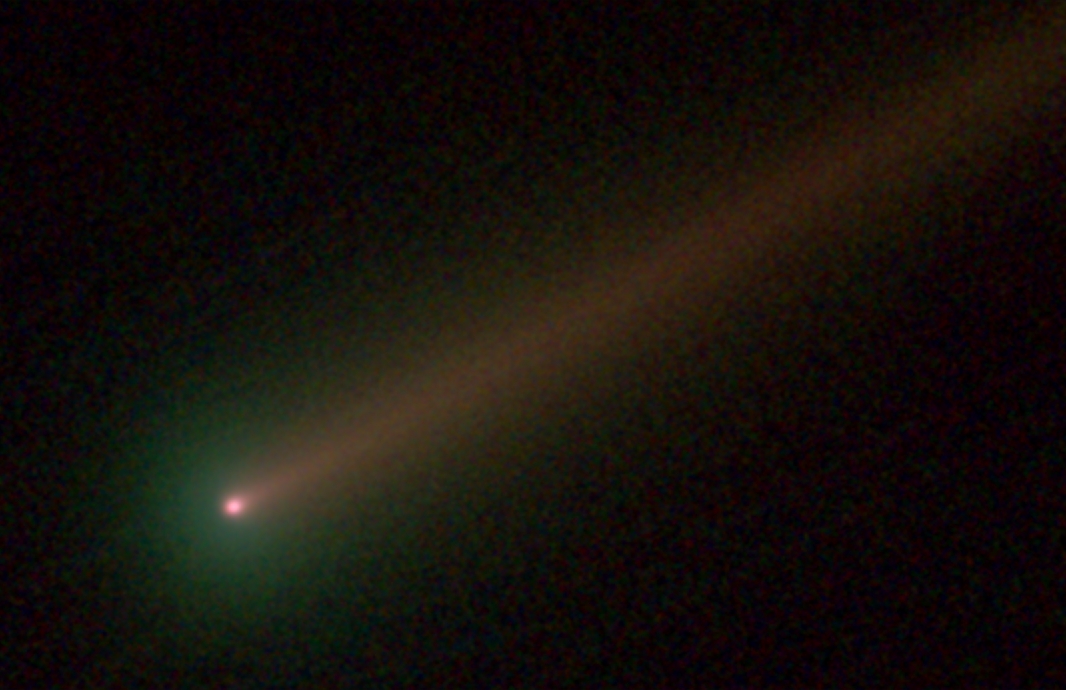
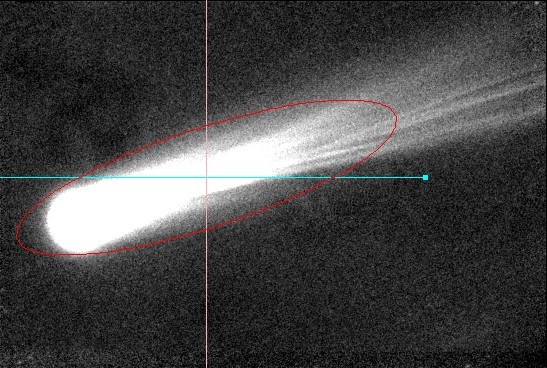
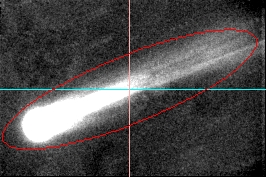
Cropped version of above image (same image scale), with coma unsaturated. The nucleus is actually much smaller than the bright dot a the center of the coma.
My Current Assessment of Comet ISON's Status:
Based on the evidence currently available, I believe that a few hours prior to perihelion the gravitational gradients produced by the sun, combined with the heat that sublimated ice (which is like a glue that was holding the particles together), led to the nucleus breaking up, producing a field of dust particles and clumps of particles (fragments) moving apart. With this breakup there was a sudden increase in total surface area for the same mass, and being this close to the sun these particles were quickly heated and produced a burst of outgassing; this could explain the brightening prior to perihelion encounter. After perihelion there was no evidence of a nucleus-based coma, which is consistent with the breakup and outgassing that occurred hours earlier. Instead, there was the appearance of a cloud of dust particles that was undergoing dispersion due to both the solar wind and light pressure. The solar wind would capture particles, molecules and atoms that were ionized, and carry them away at high speed; the neutral particles would be pushed away from the sun by sunlight pressure. The fragments would continue along a trajectory similar to the one the comet had been on. The fading that was seen after perihelion is consistent with this scenario, and suggests that ever since then the material that constituted the comet before perihelion simply continued to disperse and become so spread out that no imaging can be counted upon to capture what's left of the comet. In addition, there may be no more outgassing (for producing a coma and tail) because of the high temperatures that all particles and clumps of particles experienced at perihelion. In other words, I think Comet ISON is no longer a comet, and instead is simply 3 fields of debris (ionized dust and gas, unionized dust and fragments of the nucleus). That's my opinion. But keep in mind that I'm no comet expert!
Links on This Web Page
Rc-mag & V-mag vs Date compared with models
Brief Discussion of Current State of Comet ISON
Observation details for November
Observation details for August, September & October (at another web page)
Recovery image (Aug 12) and magnitude
Spectral Energy Distribution (SED) and Coma Size
Magnitude conversion equations
Good practices suggestion for reporting mag's
Comet surface temperature calculations
Amazing images by other amateurs
Hubble Space Telescope image & my comment
Primer on Comet ISON for the Lay Reader
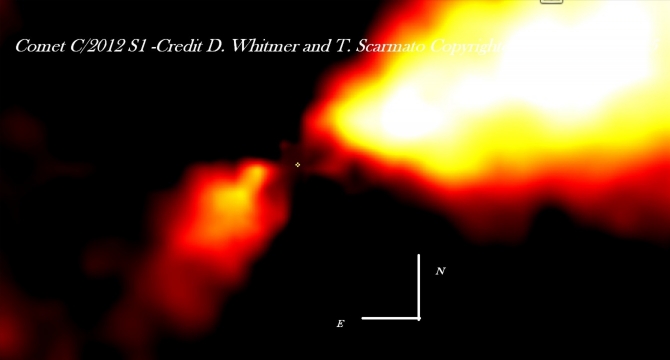
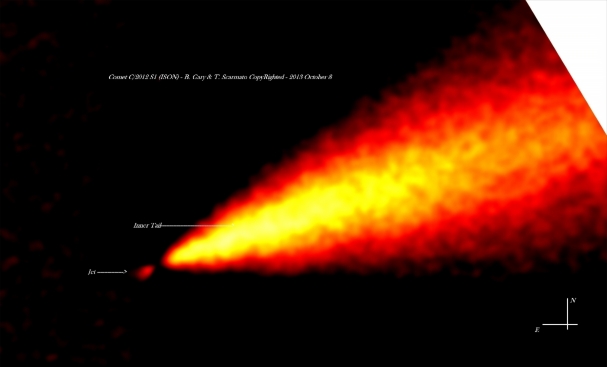
Scarmato's spatial structure enhancements, showing coma structure (e.g., jets)
Why couldn't NASA recover Comet ISON - my thoughts
Acknowledgements
Related links
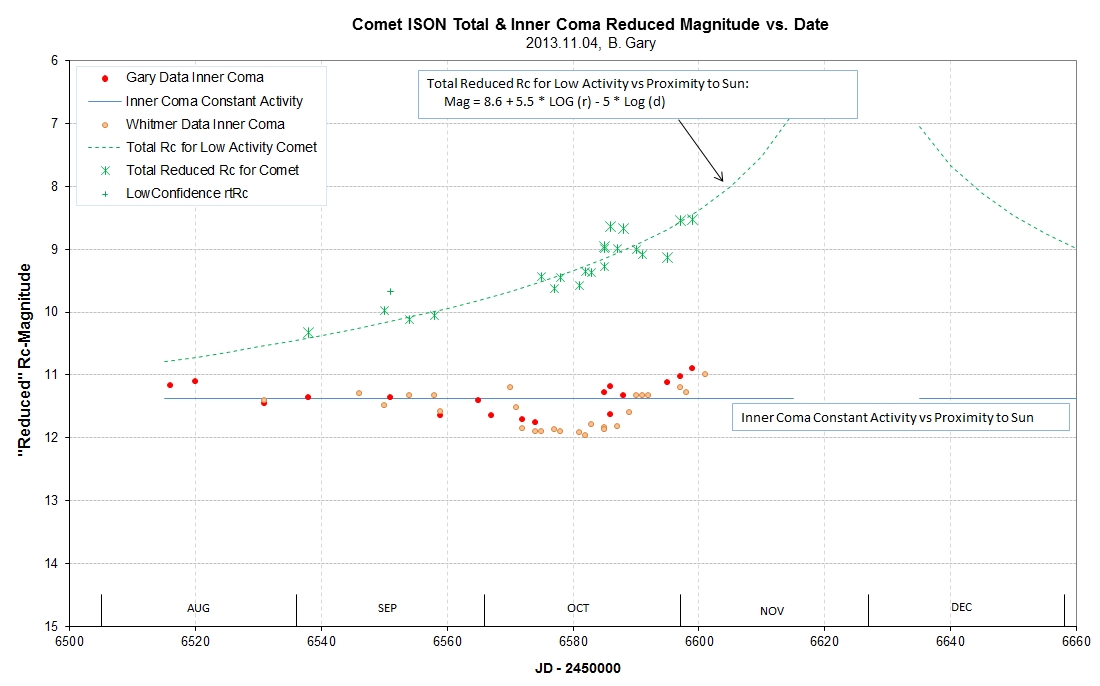
Latest V- and R-mag vs. Date Compared with Model
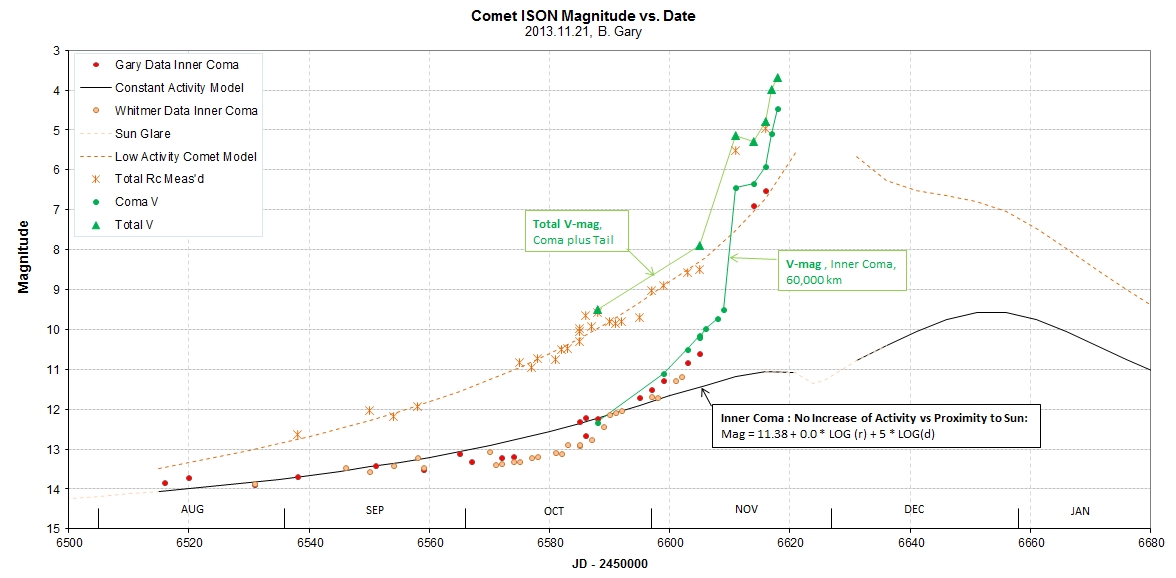
[Be patient as I update this plot with recent magnitude measurements; I'm overwhelmed with data now.] My model fit to measurements by Dennis Whitmer, Tom Kaye and Bruce Gary; all data sets analyzed by Gary in a way that leads to Rc-mag or V-mag. When the comet is closer to the sun than 20 degrees a dotted trace is used. Equation term "d" is distance of comet from Earth [a.u.] and "r" is distance of comet from sun. The "log(r) coefficient" for a typical comet is ~ 12 (between 9 and 18, usually), so the model for "total magnitude" (entire coma plus tail) is smaller than for most comets. Rc-mag for the inner coma (defined as 60,000 km diameter) shows an apparent decrease in activity on about Oct 5, which might be due to sublimation of water ice flake "snow" (following a suggestion by Jakub Cerny). On ~ Oct 20 the coma's Rc-mag returned to its earlier brightness, and began to brighten (with respect to the "constant activity" model) on ~ Oct 28. Our group began V-band measurements in late October and these show that the inner coma is brightening at a much faster rate than at Rc-band; this is due to the onset of gaseous molecular release from the nucleus in late October (as evidenced by the SED plots, below). The green triangle symbol is "total V-mag" (all of coma plus tail at V-band); this magnitude is on track to reaching 5.5 (Nov 24) just before the comet gets too close for observation.
This plot shows that the inner coma brightness (lower set of data) didn't change much (when viewed from a standard 1 a.u. distance) until late October, when a slow brightening began. Most of this brightening is due to the coma's increased level of activity starting in late October, when other evidence (SEDs, below) suggests that gas ejection from the nucleus became important. The comet's entire coma plus tail (upper red data symbols) shows a steady brightening (when viewed from a standard 1 a.u. distance) throughout all of this period. This is due to the solar wind pushing dust from the coma into the tail. The early October fade may have been explained by Jakub Cerny, who suggested that when the comet came close enough to the sun for water ice crystals (snow) to sublimate there would be a fade in coma brightness. The faded phase ended ~ Oct 20, with a slow rise in coma brightness. A more dramatic rise in coma brightness began the last few days of October, led by increased coma activity (gas releases).
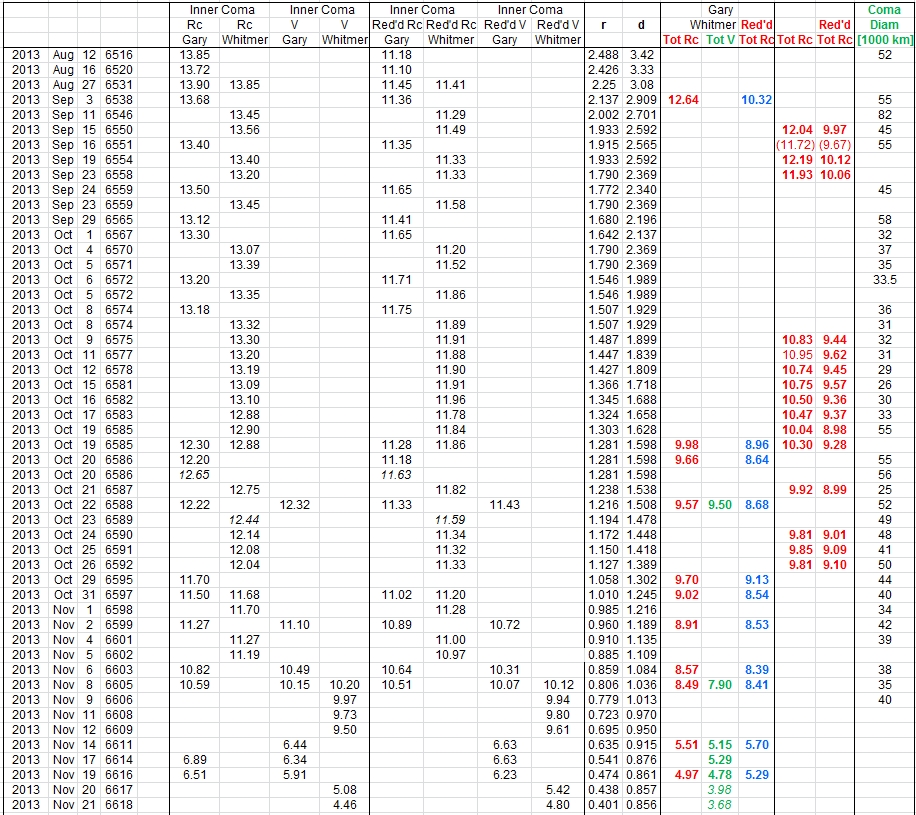
[Be patient as I update this table with recent magnitude measurements; I'm overwhelmed with data now.] Red entries are "Total Rc-magnitude" from use of elliptical photometry aperture (APT). Green entries are "total V-mag." Italicized mag's are uncertain.
Current State of Comet ISON
Starting August 12 Comet ISON brightened at a frustratingly slow pace. A 0.5 mag fade occurred from ~ Oct 5 to Oct 19. After Oct 19 there was a steady but slow brightening for both the coma and coma plus tail, until ~ Oct 24, when the coma brightness became stable and the "coma + tail" brightness returned to a brightening that follows a model incorporating very modest activity level increase with decreasing distance to sun. During the last few days of October the coma began a modest brightening with respect to a model that assumes constant activity level). The rate of brightening grew until an outburst on Nov 13. This behavior was suggested in August by several investigators who speculated that if the rotational pole was indeed pointed toward the sun, as suggested by Dr. Li (based on jets seen in HST images in April), the sun's illumination would undergo a slow change from the pole facing hemisphere to some of the sides and backside (which has never been exposed to sunlight heating before); this should produce a significant brightening before perihelion. Someone even suggested that this brightening would occur in early to mid-November. It is reasonable to interpret the Nov 13 outburst as being produced by this changing illumination of the surface theory. About a week later (Nov 20) another outburst occurred, which maybe can be attributed to the same new surface area being warmed enough to sublimate a different gas (e.g., ice outburst on Nov 13, dry ice outburst on Nov 20, both from the backside).
Sometime between Sep 24 and Oct 22 the coma underwent a "greening" caused by injection of gases (e.g., C2), which is most dramatically shown by comparing Spectral Energy Distribution (SED) plots from a month ago to now:

Spectral Energy Distribution (SED) change from late September to late October, showing rise of molecular emission at B, V and g' bands.
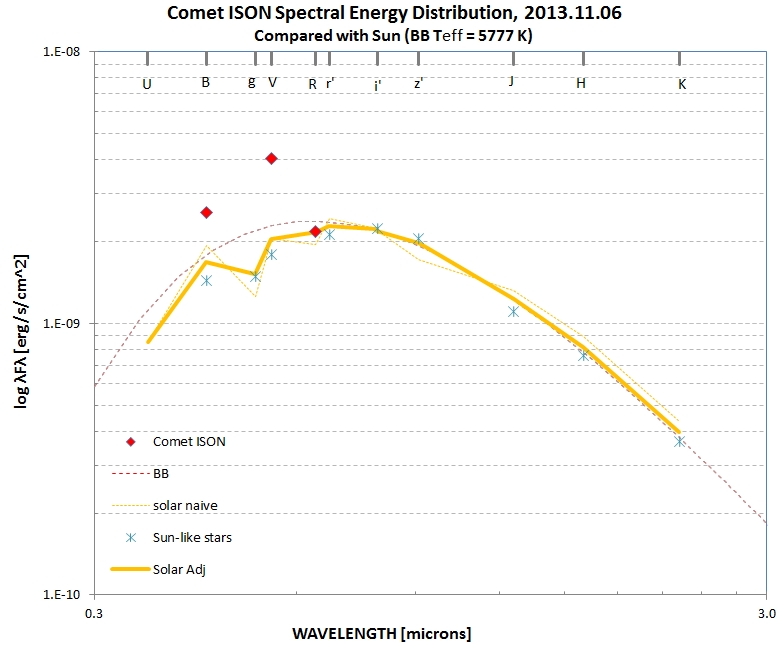
Spectral Energy Distribution (SED) on November 06, showing an even greater amount of molecular emission (at B and V-bands) than at any time in the past. On this date the V-band flux is at least twice what it would be in the presence of only dust.
The coma is green due to molecular emission while the tail remains reddish, caused by dust particles that reflect sunlight with an albedo that increases with wavelength. The inner-most coma is reddish! This must be due to dust that has been recently ejected and not yet gotten a backwards push from sunlight. The rest of the coma is dominated by gas molecules that are not pushed back by sunlight, but instead absorb sunlight and re-emit in an excited state at short wavelengths (e.g., B, g' and V-bands).
Comet ISON appears to have become more active in ejecting volatiles (molecular CN, C2, OH, etc) and not especially active in ejecting dust.
During Oct 01 to Oct 19 coma diameter appears to have decreased, and then abruptly rebounded to its original value? This is approximately when the coma faded ~ 0.5 mag and then returned to its original brightness. If the fade is due to snow evaporating then the snow would have to have been in the outer regions of the coma when it started evaporating (sublimating from ice to vapor). The size and brightness recovery in mid-October must be due to a new source of molecular outgasing, possibly due to new surface area being illuminated by sunlight. However, the coma began another decrease in size on Oct 19. Maybe this is due to increased solar wind pressure compressing the coma. Since the coma is brightening as it shrinks in size, so it have an increasing surface brightness.
Comet ISON began an "outburst" sometime on Nov 13, with a brightening of 1.2 mag in one day being reported on that date. Our Nov 14 imaging calls for a brightening of ~ 4 mag's in V-band, and ~ 2.5 mag's in Rc-band during a 2-day interval. Evidence suggests that a dramatic increase in gas-driven dust occurred, causing jets of gas and dust to appear in many directions, producing filamentary structures in the outer coma that bend backwards in a way that could be produced by the solar wind, forcing the filamentary material to join the tail quickly. An animation of this dynamical process was recorded by Gary with imaging in B, V, r' and i' bands (but most pronounced in r'-band, proving that dust is a major component of the new ejections from the nucleus). One explanation for this dramatic increase in activity is that pieces of nucleus material have broken off and are exposing fresh surface area to solar illumination, which due to the comet's proximity to the sun causes a heat wave to quickly penetrate into the fresh surfaces and raise volatile crystals to their sublimation temperature, which then causes a dislodging of dust and gas to the coma.
There was been much discussion about the comet breaking-up ~ Nov 13 or 14, causing more surface area to be exposed and thereby accounting for a brightening. The only observational evidence for this seemed to be spatial structure image enhancement, showing distinct bright spots. I remained unconvinced, because I think the enhanced images are also compatible with newly formed jets on the sides, as well as near the front of the nucleus, which extend into the inner coma. There was convincing evidence that there were filamentary-like structures within the coma (inner and outer) that were bend backwards for eventual joining with the tail. So my default position had become that Comet ISON was still intact but was simply more active in producing jets that feed the coma with greater than ever amounts of gas and dust.
As the comet approached perihelion it began to fade, and formed an unusual tail consisting of (large particle) debris that was not pushed away from the sun by solar light pressure. This apparently was a result of partial break-up due to the thermal heat wave penetrating deep into the small nucleus. As the comet came to within a few solar radii of the sun the coma was blown away and it faded significantly. Only an innermost core remained after perihelion passage, and it formed a small, faint coma that lasted about a day, then began a final fade away. The comet's ending as a comet has become essentially complete as I write this (Nov 30).
There will be no more updates of this web page.
____________________________________________________________________________________________
Observations by Date
2013.12.12 Whitmer R
Whitmer took 5 120-exposures and 7 40-second exposures at the location of Blob A offset from the JPL Horizons coordinates (found nothing), and 5 120-second exposures at yeterday's Blob A location (found nothing), using an R-band filter and star-tracking mode.
2013.12.12, 12:57 UT, R-band median combine of 5 120-sec exposures. Circle at 16:11:00 +08:57:16. Limiting Rc-mag = 18.2. FOV = 16.5 x 13.2 'arc.
Since there is nothing at the circled location, and since our limiting Rc-magnitude is 18.2, we conclude that the "Blob A" seen in yesterday's image was an artifact of unknown origin. In other words, we have not recovered Comet ISON!
2013.12.11 Whitmer R
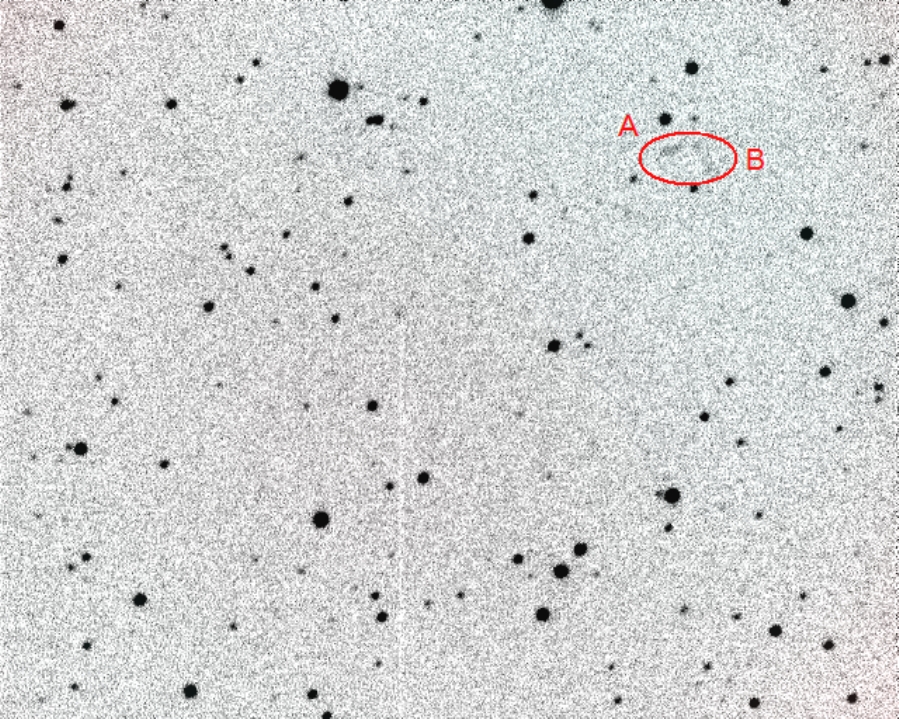
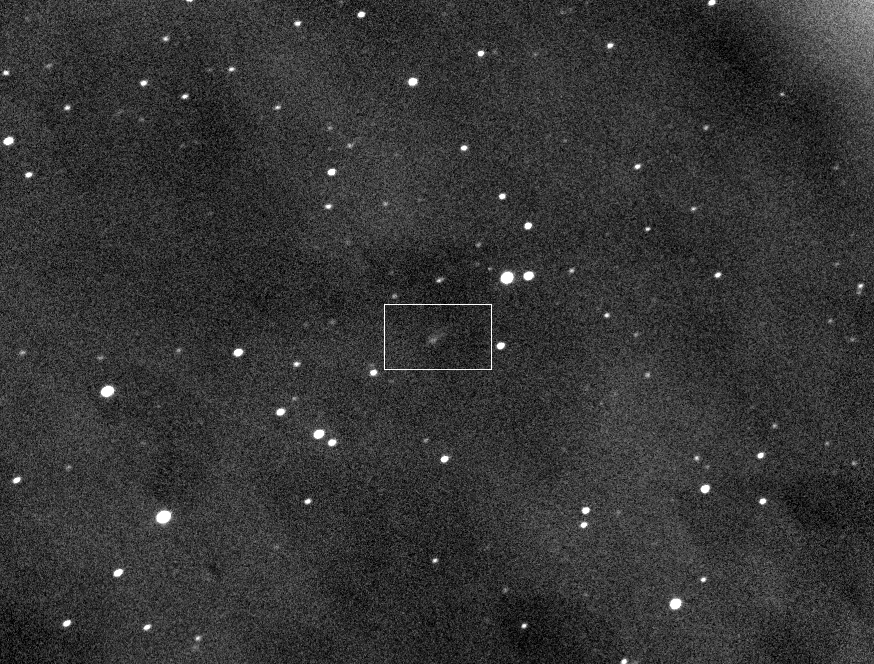
Whitmer observed in a 3x3 mosaic pattern covering ~ 9 times the FOV of his single image FOVs in a search for any kind of blob that could be what's left of the comet. In the upper-left corner location, he had 3 40-second exposures that showed two faint blobs.
Median combine of 3 40-second Rc-band images, made with 14-inch Celestron. FOV = 16.5 x 13.2 'arc, north up, east left. Star next to "A" blob has Rc-mag = 13.71. Faintest stars have Rc-mag = 17.0. Images made between 12:51:23 and 12:53:10 UT, 2013 December 11.
I measure blob A to have Rc-mag = 15.91 ± 0.10, based on 6 APASS stars (with BVr' mag's that I converted to Rc-mag).
Could blob A be a galaxy? No, as the following figure shows.
Same FOV as the previous image, showing no galaxies near the blob A location. The other image is a DSS2 image taken from the SkyMap web site.
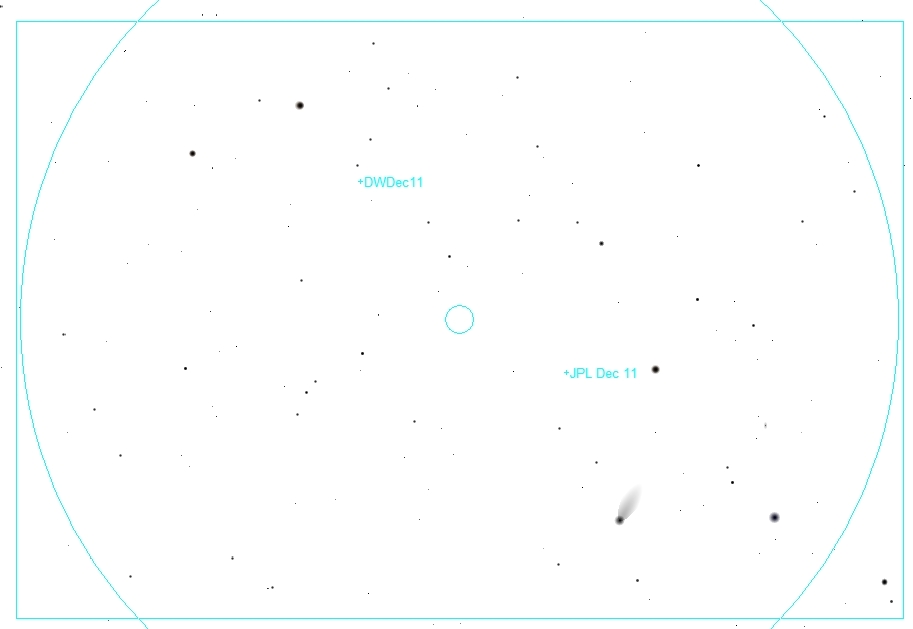
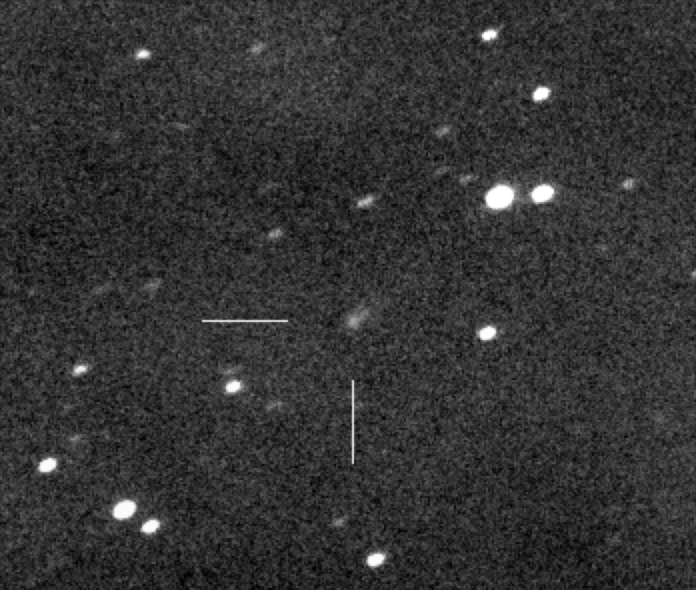
Locations of blob A ("DWDec11"), JPL Horizons prediction ("JPL Dec 11"), and a month-old ephemeris (for 2013.12.11, 12:52 UT).
The way to convert JPL Horizons RA/DE coordinates to the blob A location is to add 30.5 RA seconds and add 7.0 DE 'arc.
This may be an artifact of some sort that we don't understand, so the blob A location and the predicted location if it's following the comet track need to be observed carefully, as soon as possible. If it's clear tomorrow we'll know if this is a "recovery."
One person suggested that there may be a dust cloud of particles larger than typical tail particles and a group of clumps or fragments of larger size. The dust cloud woould be affected by solar light pressure and move away from the sun, while the grup of fragments would continue on an orbit unaffected by either light pressure or solar wind. However, the group of fragments could be on an orbit that was altered when the comet nucleus broke-up hours before perihelion (due to jets and break-up dynamics), so they could be on a trajectory that is slightly different from what was predicted before perihelion passage. A bunch of fragments might be very, very faint because they're no longer outgassing, whereas the dust cloud could be visible because of reflected sunlight. HST is planning observations Dec 18, and they are trying to figure out where to point; I think they want to aim at the fragment group as a primary goal. We amateurs should concentrate on imaging the dust cloud because that's probably the only thing that is bright enough to image.
What a comet!
2013.12.10 Whitmer R
14-inch telescope, R-band, dozens of images, faintest stars with V-mag ~ 18: No sign of a comet!
2013.12.09 Whitmer R
Mosaic, 3x3, covering FOV = 36 x 31 'arc, R-band, with 14-inch telescope. Nothing seen brighter than ~ 16th mag.
2013.12.06 Gary V
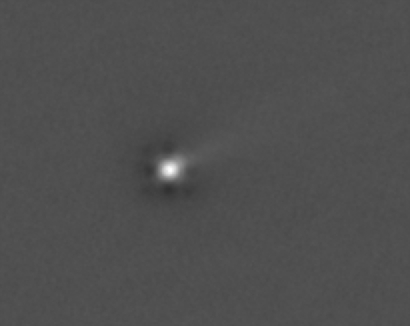
The following image is median combine stack of 20 Cb-band, 10-second exposures.
Median combine of 50 Cb-band images, each 10-second exposure, FOV = 30x21 'arc. The comet's elevation ranged from 5.7 to 8.4 degrees while the sun ranged from -12.5 to -9.9 degrees. The animation alternates the 50-image median combine image with a catalog of the same FOV (with the comet in the predicted location). The faintest stars have V-mag ~ 16, so that's an upper limit on the brightness of any nucleus or coma.
If the comet was within the FOV it would have to be fainter than ~V-mag = 16.0. Given its "traumatic" disintegration when it was near the sun, and the possibility that only a tiny piece (or pieces) was left, the orbit must have been changed.
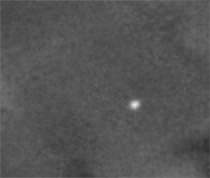
2013.11.25 Gary V
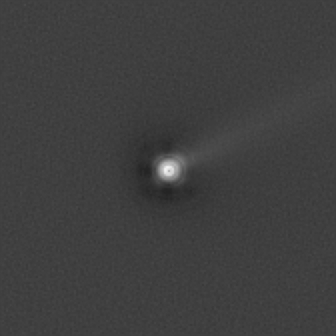
The following image is median combine stack of 12 star-aligned V-band, 1-second exposures.
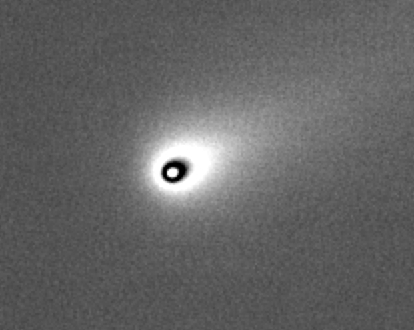
Zoom and crop of Gary V-band, FOV = 3.0 x 2.5 'arc, stacked image taken Nov 25, 13:30 UT, when the comet was 4.5 degrees above the horizon and the sun was 6 degrees below the horizon. The comet was 12.9 degrees from the sun.
No other stars were visible in the larger FOV image from which this cropped image was made because the sky background was too bright. Therefore, it was not possible to determine a V-mag for the coma on this date. The shape of the bright spot has FWHM = 5.8 "arc (7500 km). If a break-up has occurred the pieces must be close together still.
2013.11.21 Whitmer G
Whitmer took 70 images with G filter between 12:20 & 13:03 UT. The best 5 are processed below.
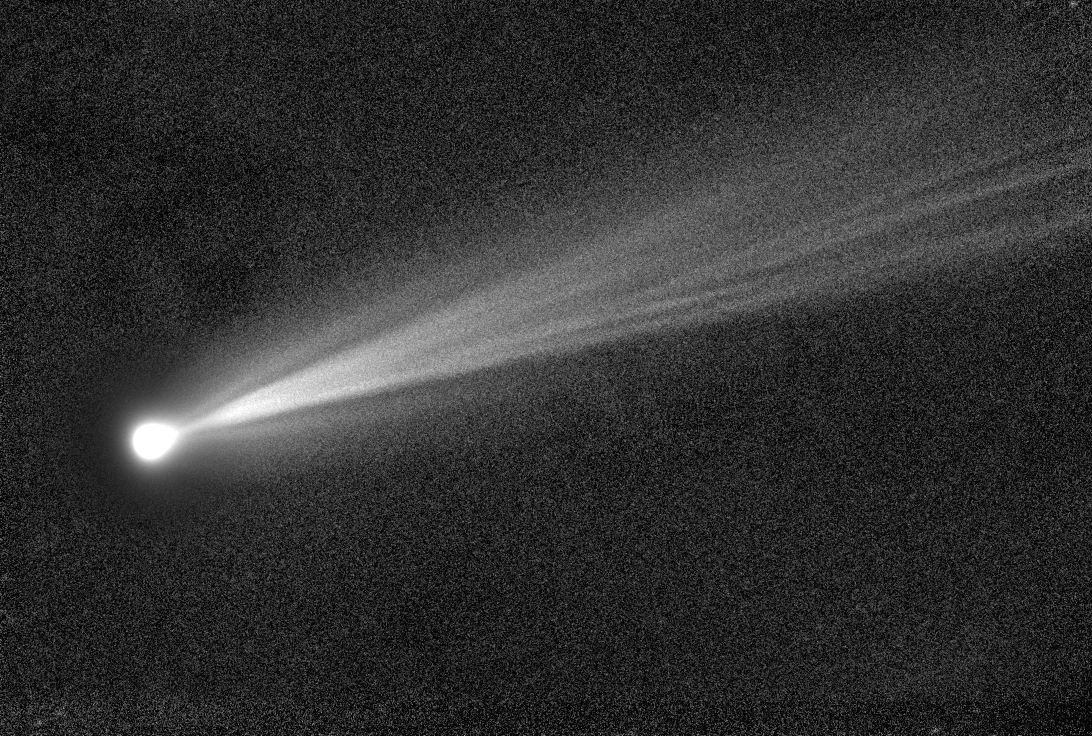
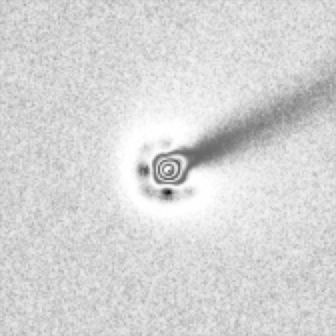
Whitmer G-band stacked image (5 median combine), digital development twice (hd & he), FOV = 16 x 13 'arc.
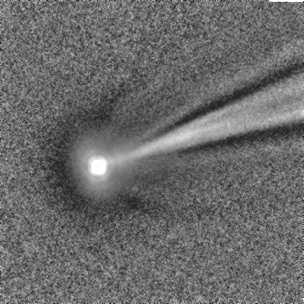
Zoom of inner coma of Whitmer G-band image (FOV = 6.9 x 5.0 'arc) after spatial enhancement using the PSI web site "Cometary Coma Image Enhancement Facility" (using Steve Larson's "Radially Variable Spatial Filtering," 3,3,0.3). Credit: Planetary Society Institute (PSI) "Cometary Coma Image Enhancement Facility" (Samarasinha, N. H., Martin, M. P., Larson, S. M, 2013. Cometary Coma Image Enhancement Facility, http://www.psi.edu/research/cometimen).
The "wing jets" are unmistakable in this spatially-enhanced image. They've been present for several days. I still claim that there is no evidence for "break-up," which improves the probability that the comet will survive perihelion passage (but perihelion survival is not assured).
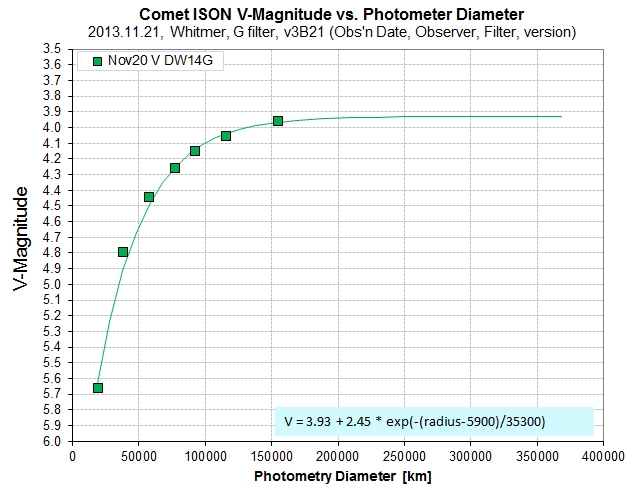
Coma V-mag vs. photometry aperture diameter for Nov 21 Whitmer G-band filter.
For a 60,000 km diameter V-mag = 4.46. Total V-mag will be < 3.9.
For coma diameter = 250,000 km, V-mag ~ 3.93 (0.42 mag brighter than one day earlier, Nov 20).
Adopting Total V-mag = V-mag 250,000 km - 0.25 (based on recent dates), we may estimate that on this date Total V-mag = 3.68.
2013.11.20 Whitmer G
Whitmer took 78 images with G filter. The best 6 are processed below.
Whitmer G-band stacked image (6 median combine), digital development (hd), FOV = 16 x 13 'arc.
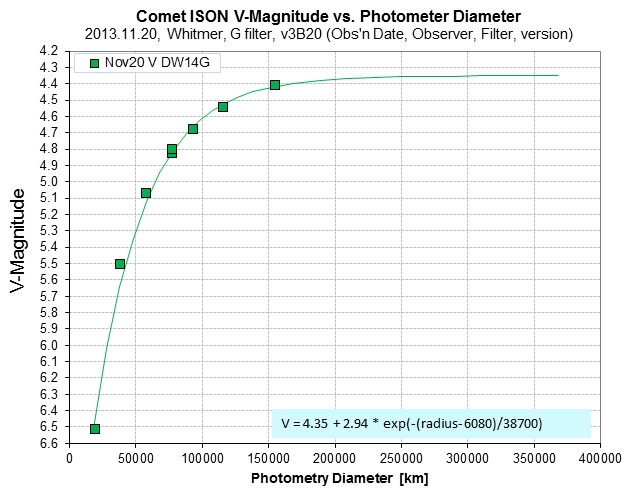
Coma V-mag vs. photometry aperture diameter for Nov 20 Whitmer G-band filter.
For a 60,000 km diameter V-mag = 5.08. Total V-mag will be < 4.35.
For coma diameter = 250,000 km, V-mag ~ 4.35 (0.73 mag brighter than one day earlier, Nov 19).
Adopting Total V-mag = V-mag 250,000 km - 0.25 (based on recent dates), we may estimate that on this date Total V-mag = 4.10.
2013.11.19 Gary B, V, r'
Gary obtained 82 exposures (34 B, 34 V, 24 r') from 12:26 to 13:04 UT.
V band
Gary V-band stacked image (14 median combine), digital development (hd), FOV = 31 x 20 'arc.
Zoom of inner coma of Gary V-band image (FOV = 8.7 x 8.7 'arc) after spatial enhancement using the PSI web site "Cometary Coma Image Enhancement Facility" (using Steve Larson's "Radially Variable Spatial Filtering," 3,3,0.2). Credit: Planetary Society Institute (PSI) "Cometary Coma Image Enhancement Facility" (Samarasinha, N. H., Martin, M. P., Larson, S. M, 2013. Cometary Coma Image Enhancement Facility, http://www.psi.edu/research/cometimen).
Toni Scarmato spatial structure enhancement of Nov 19 Gary r' image, FOV = 5.6 x 5.1 'arc.
Coma V-mag vs. photometry aperture diameter for Nov 19 Gary V-band. (Disregard error in graph key; these are V-mags.)
For a 60,000 km diameter V-mag = 5.91. Total V-mag will be < 5.03.
For coma diameter = 250,000 km, V-mag = 5.08 (0.43 mag brighter than on Nov 17).
Determining total flux using APT's oval photometry aperture 119/31/27 (oval length, width & angleOval width 1x & 3x larger was used to establish total comet counts minus sky background counts, for Nov 19 Gary V-band.
A star-aligned stacked image was created from the same images used to create the comet-aligned image (used in the above APT measurement of total comet counts minus background counts), and manual readings of star fluxes were used to determine a conversion of counts to magnitude. This allowed for the determination of the following:
Total V-mag (coma plus tail) = 4.78 ± 0.06 (estimated SE) or brighter (since some of tail was not included).
In other words, total V-mag is at least 0.51 mag brighter than on Nov 17.
r' band
Gary r'-band stacked image (11 sharpest median combine), digital development (hd), FOV = 31 x 19 'arc.
Zoom of inner coma of Gary r'-band image (FOV = 8.1 x 6.1 'arc) after spatial enhancement using the PSI web site "Cometary Coma Image Enhancement Facility" (using Steve Larson's "Radially Variable Spatial Filtering," 3,3,0.2). Credit: Planetary Society Institute (PSI) "Cometary Coma Image Enhancement Facility" (Samarasinha, N. H., Martin, M. P., Larson, S. M, 2013. Cometary Coma Image Enhancement Facility, http://www.psi.edu/research/cometimen).
Toni Scarmato spatial structure enhancement of Nov 19 Gary r' image.
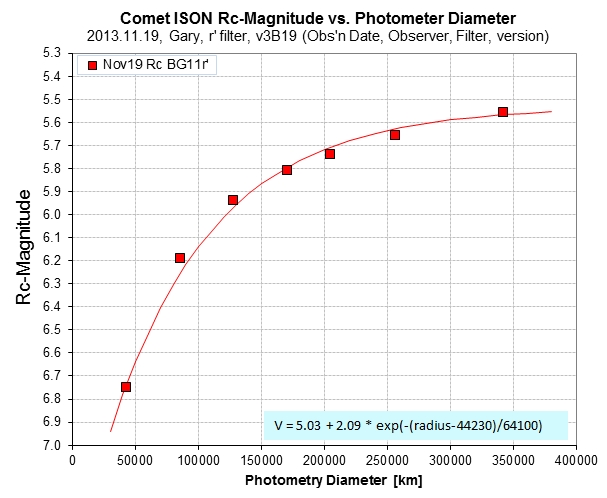
Coma Rc-mag vs. photometry aperture diameter for Nov 19 Gary r'-band.
For a 60,000 km diameter Rc-mag = 6.51. Total Rc-mag will be < 5.55.
For coma diameter = 250,000 km, RcV-mag = 5.63 (0.47 mag brighter than on Nov 17).
On this date "V-mag minus Rc-mag" = -0.60 (for 60,000 km) & -0.55 (for 250,000 km).
Total Rc-mag = 4.97 ± 0.03 (calculated SE). (APT images not shown.)
2013.11.19 Whitmer G
Whitmer obtained 110 30-sec comet-guided exposures from 12:02 to 13:06 UT.
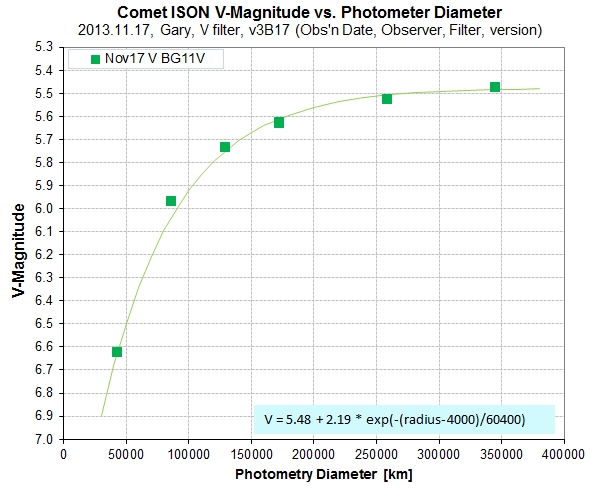
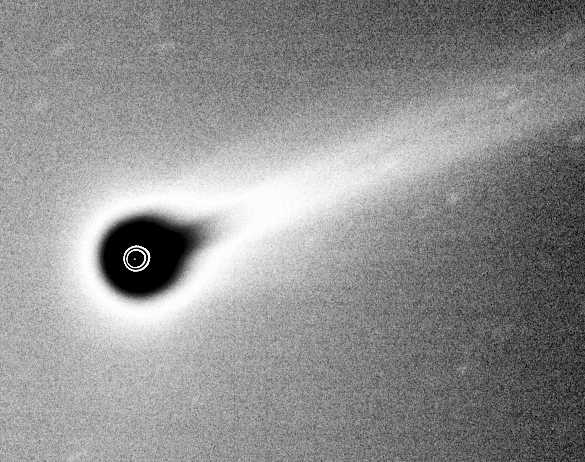
2013.11.17 Gary B, V, r' & i'
Gary obtained 20 V &15 V, r' & i'-band images, under thin cloud and poor seeing conditions, from 12:41 to 13:10 UT.
V-band
Coma V-mag vs. photometry aperture diameter.
For a 60,000 km diameter V-mag = 6.34. Total V-mag will be < 5.48.
For coma diameter = 250,000 km, V-mag = 5.51 (0.2 mag fainter than on Nov 14).
Determining total flux using APT's oval photometry aperture 119/31/27 (oval length, width & angle)Oval width 1x & 2.12x larger was used to establish total comet counts minus sky background counts.
A star-aligned stacked image was created from the same images used to create the comet-aligned image (used in the above APT measurement of total comet counts minus background counts), and manual readings of star fluxes were used to determine a conversion of counts to magnitude. This allowed for the determination of the following:
Total V-mag (coma plus tail) = 5.29 ± 0.05 (estimated SE).
In other words, total V-mag is 0.17 mag fainter than on Nov 14.
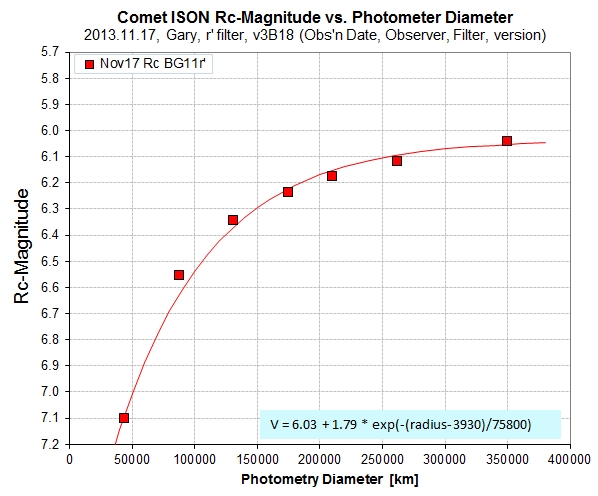
r'-band
Only 3 images were free of clouds and were sharp enough for analysis.
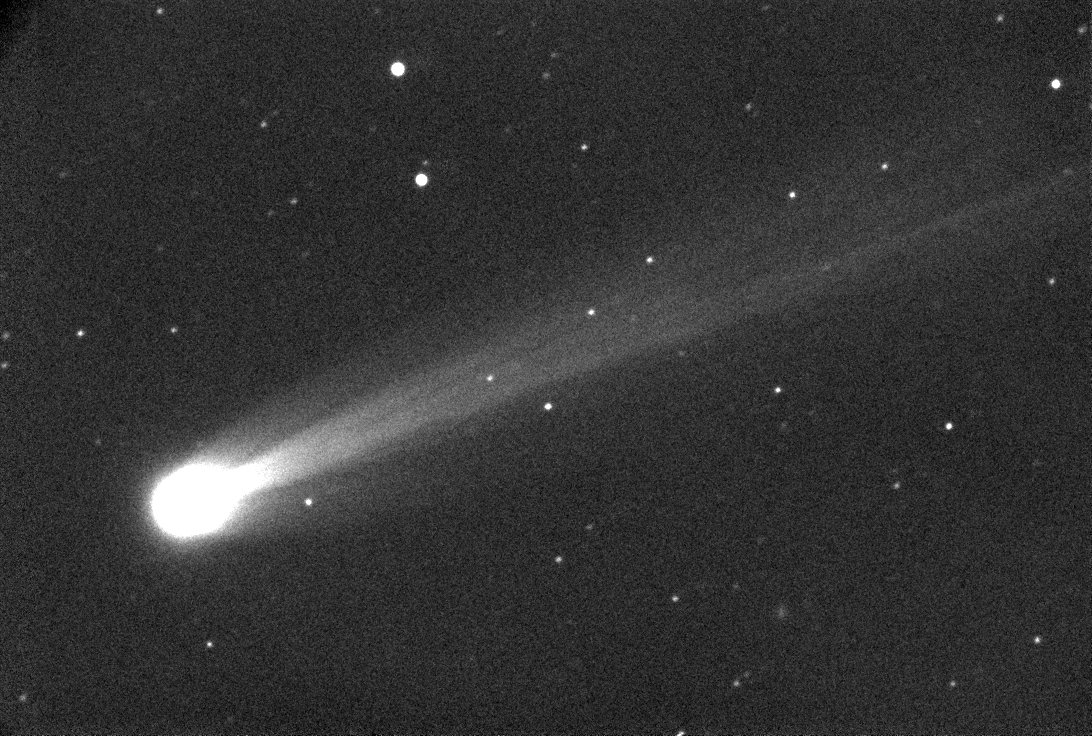
r'-band median combine of 4 20-second exposures. FOV = 31 x 31 'arc.
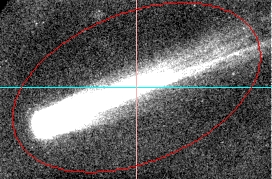
Determining total flux using APT's oval photometry aperture 131/31/22 (oval length, width & angle)Oval width 1x & 2.42x larger was used to establish total comet counts minus sky background counts.
A star-aligned stacked image was created from the same images used to create the comet-aligned image (used in the above APT measurement of total comet counts minus background counts), and manual readings of star fluxes were used to determine a conversion of counts to magnitude. This allowed for the determination of the following:
Total Rc-mag (coma plus tail) = 5.59 ± 0.02 (calculated SE).
Determining total flux using APT's oval photometry aperture 119/31/27 (oval length, width & angle)Oval width 1x & 2.12x larger was used to establish total comet counts minus sky background counts. A star-aligned stacked image was created from the same images used to create the comet-aligned image (used in the above APT measurement of total comet counts minus background counts), and manual readings of star fluxes were used to determine a conversion of counts to magnitude. This allowed for the determination of the following: Total V-mag (coma plus tail) = 5.29 ± 0.05 (estimated SE).
Coma r'-mag vs. photometry aperture diameter.
For a 60,000 km diameter Rc-mag = 6.89. Total V-mag will be < 6.04.
For coma diameter = 250,000 km, Rc-mag = 6.10.
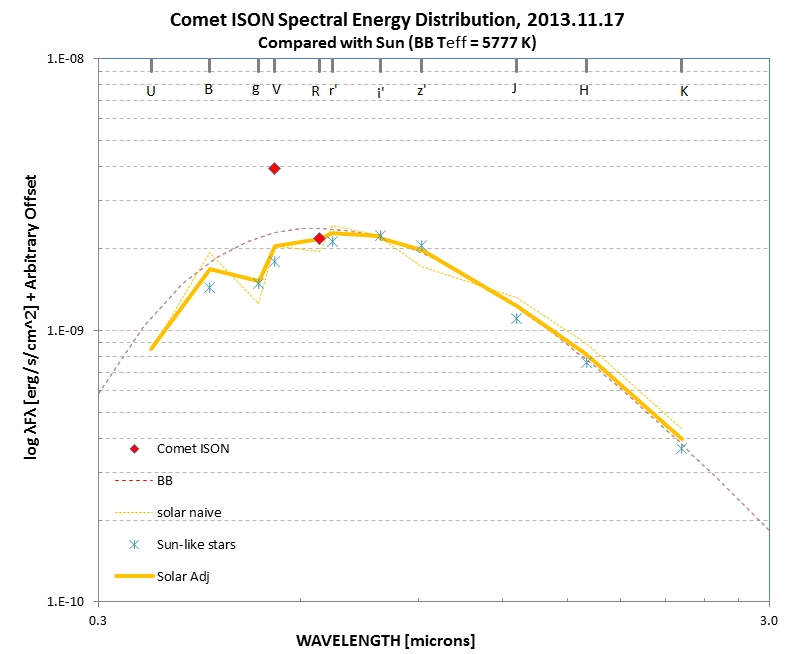
SED
Spectral Energy Distribution (SED), based on total V-mag and total Rc-mag, for Nov 17.
Using Rc-mag for setting an offset (since there should be no gas emission at this band), we can use V-mag to estimate the relative importance of the gas emission to the total (coma plus tail) comet flux within V-band. Gas emission within V-band is twice the flux expected if only dust were present (with uniform albedo versus wavelength). This is the same as measured Nov 06.
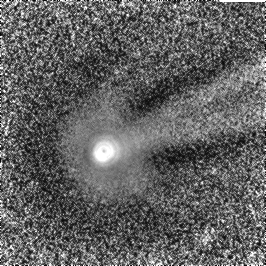
2013.11.17 Whitmer G
Whitmer obtained 96 G-band images under thin cloud & poor seeing conditions. I median combined the sharpest 11 out of 96 images to produce the following.
Whitmer Nov 17 G-band stacked image, FOV = 7.5 x 5.9 'arc. Seeing was bad, with FHWM = 5.4 "arc.
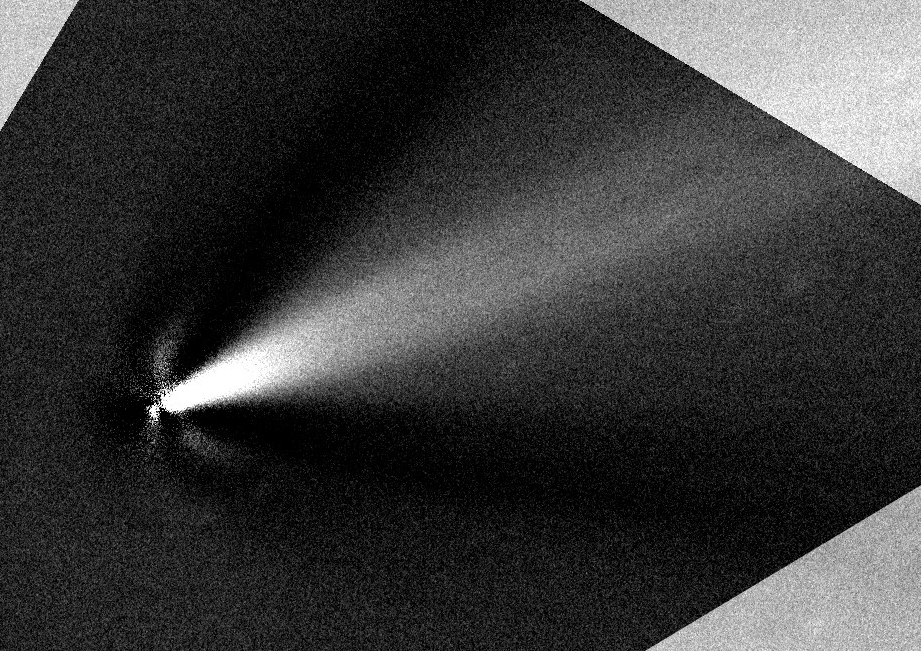
Here's my spatial structure enhancement:
Zoom of inner coma of Whitmer a G-band image (FOV = 4.2 x 4.3 'arc) after spatial enhancement using the PSI web site "Cometary Coma Image Enhancement Facility" (using Steve Larson's "Radially Variable Spatial Filtering," 3,3,0.2). Credit: Planetary Society Institute (PSI) "Cometary Coma Image Enhancement Facility" (Samarasinha, N. H., Martin, M. P., Larson, S. M, 2013. Cometary Coma Image Enhancement Facility, http://www.psi.edu/research/cometimen).
The above images are compatible with jets on the side that get swept back to form filaments that join the tail.
Here's Toni Scarmato's spatial enhancement:
Toni Scarmato spatial structure enhancement of Whitmer G-band Nov 17 image.
This spatially enhanced image shows jets on both sides, as did the PSI version, but also in front. All are bent backwards (by solar wind and sunlight). This pattern is consistent with the animation from Gary images made Nov 14.
2013.11.14 Whitmer G & R
Dennis Whitmer took 110 30-second images with G-band filter and 30 30-second images with R-band filter, from 12:28 to 12:45 UT with his 14-inch Celestron telescope. The following analysis is based on a subset of those images.
Whitmer G-band stacked image (10 median combine), FOV = 14.3 x 9.1 'arc. (Note that the coma width is greater than the length, consistent with jets on the side.)
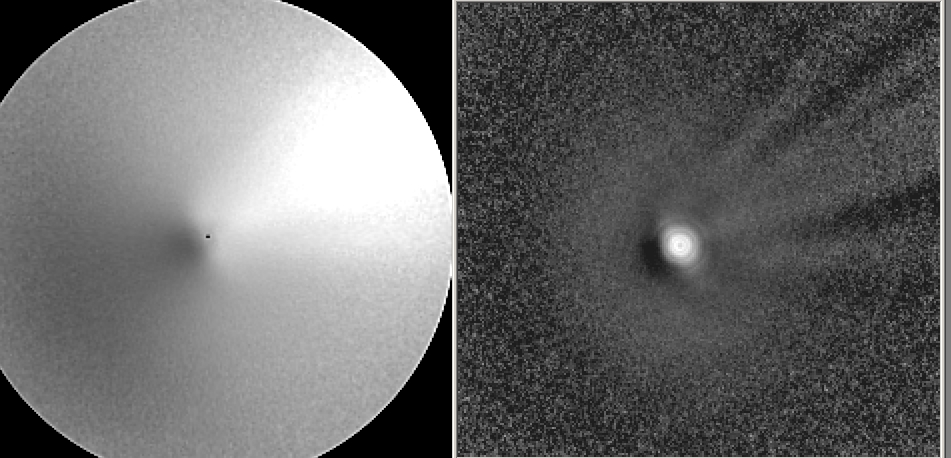
Zoom of inner coma of Whitmer a G-band image (FOV = 3.1 x 3.1 'arc) after spatial enhancement using the PSI web site "Cometary Coma Image Enhancement Facility" (division by azimuthal average). Credit: Planetary Society Institute (PSI) "Cometary Coma Image Enhancement Facility" (Samarasinha, N. H., Martin, M. P., Larson, S. M, 2013. Cometary Coma Image Enhancement Facility, http://www.psi.edu/research/cometimen). Left panel is "Division by Azimuthal Average" and right panel is "Radially Variable Spatial Filtering" filter (plus a MaxIm Dl "digitial development" enhancement).
The above images are compatible with jets on the side that get swept back to form filaments that join the tail.
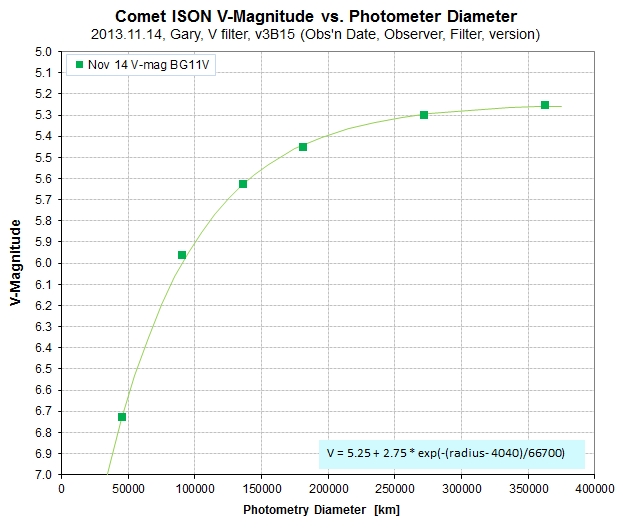
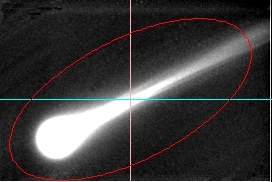
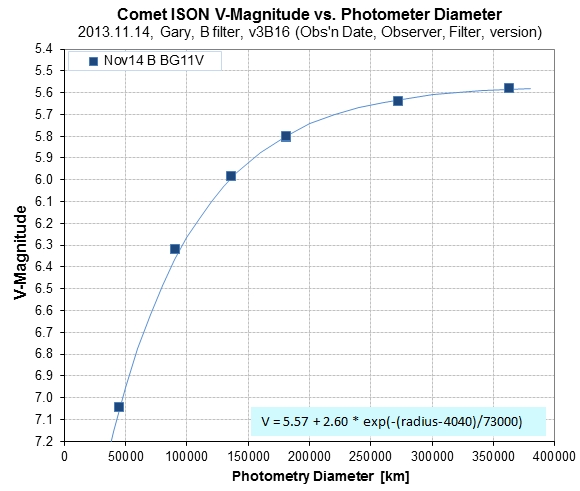
2013.11.14 Gary B,V, r' i' bands
Gary obtained 64 B-band, 48 V-band, 48 r'-band and 48 i'-band images between 11:21 and 13:00 UT. The B, V and r' images were used to create the following true color images.
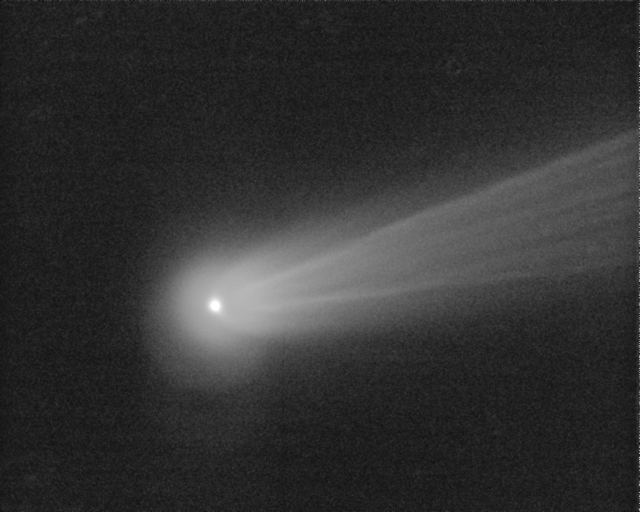
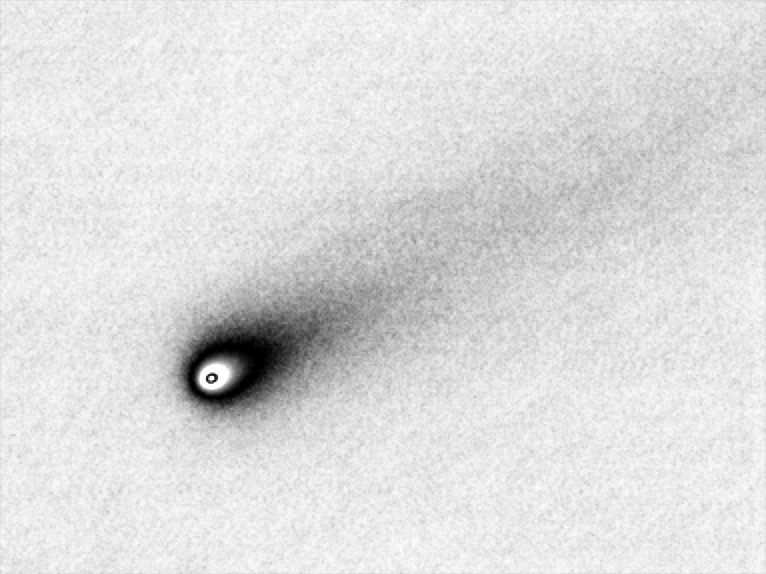
True color image based on 39 B-band, 34 V-band and 29 r'-band images, 20-second exposures, using a 11-inch Celestron telescope. FOV = 32 x 21 'arc, north up, east left.
Cropped version of above image (same image scale), with coma unsaturated.
Individual images showed more structure, changing with ~ 10 minute timescale.
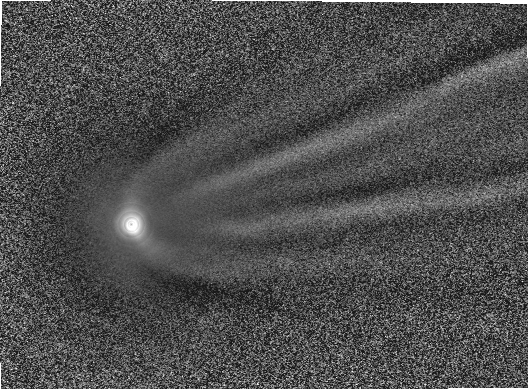
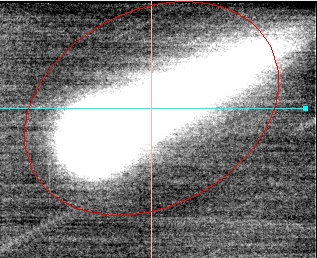
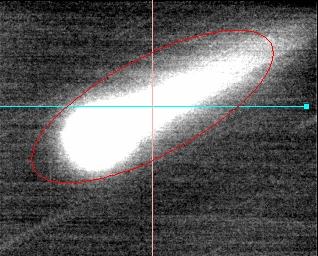
Median combine of 3 20-second r'-band images, showing structure within outer coma and tail, indicating the presence of many sources of dust (jets).
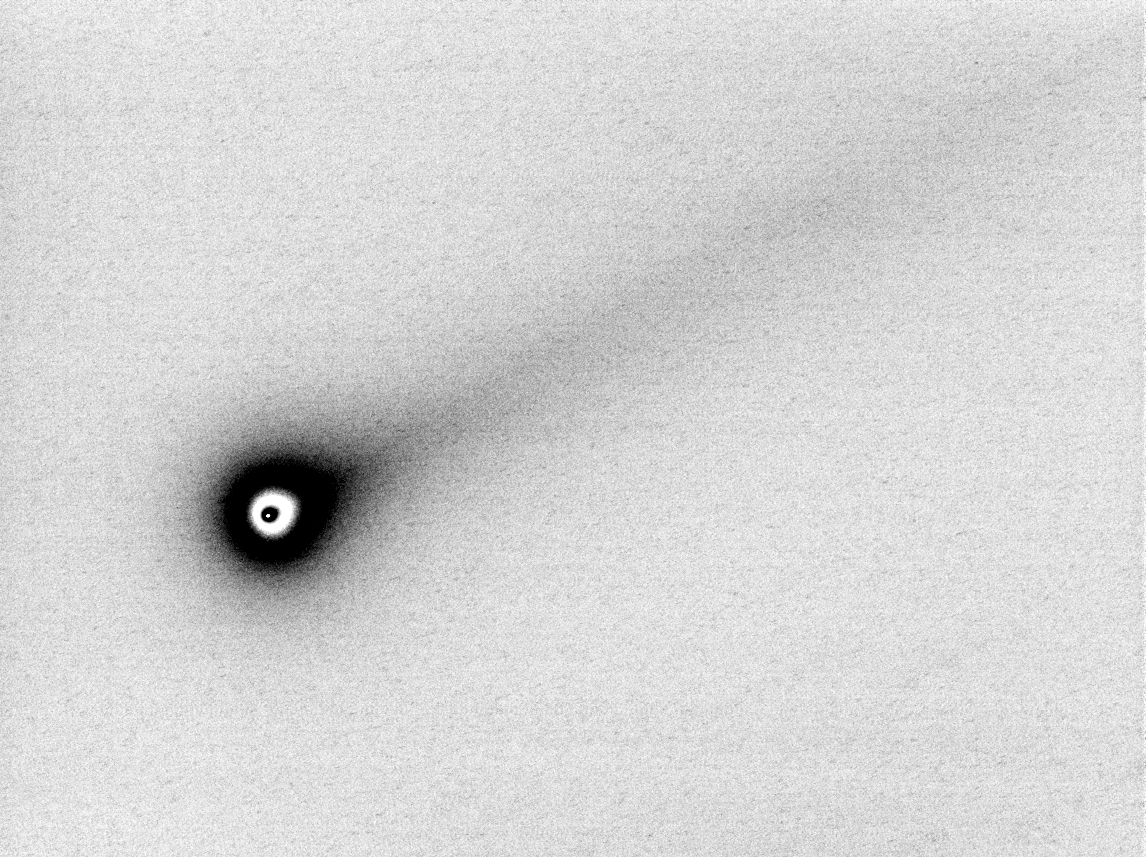
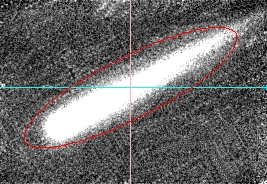
"Digital development" allowing coma to be seen in relation to nucleus position.
This animation consists of 8 images, each a 3-image median combine stack, all with a r' filter, from 11:43 to 12:53 UT, Nov 14, made by Bruce Gary using a Celestron 11-inch telescope. Filamentary structure can be seen moving away from the sun at high speed. The motion of jets that can be seen first on the side is backwards and toward the center of the tail; this must be cause by the pattern of solar wind enveloping the coma and coming back together on the back side (just my amateur speculation). The presence of many jet-like structures in the outer coma and tail show that there are many sources for gas-driven dust on the nucleus surface. (The coma isn't changing size; it just appears that way due to the contrast/brightness adjustments that were needed to keep the tail looking the same.)
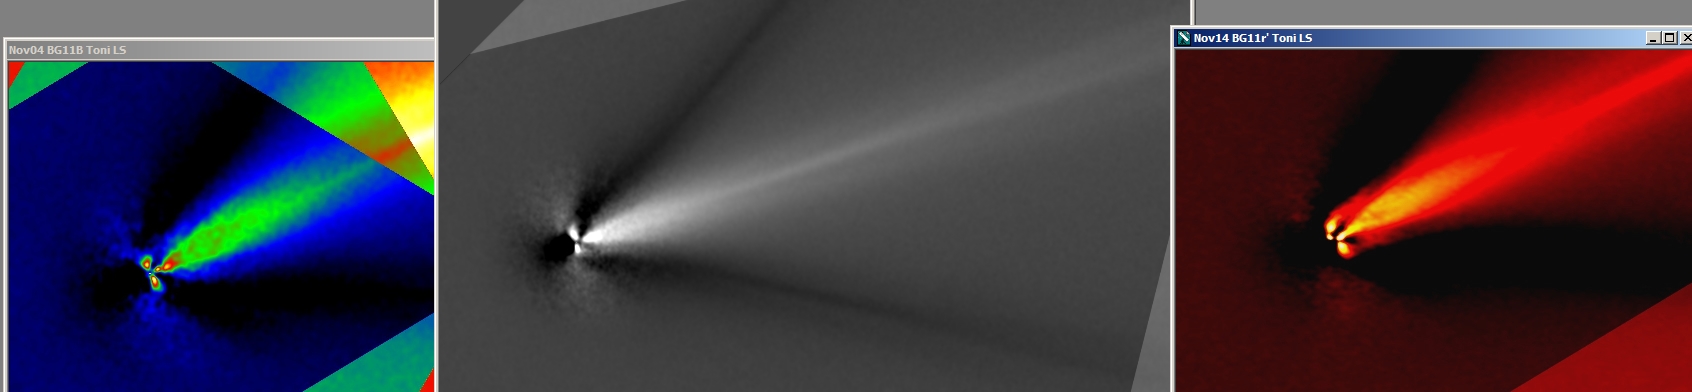
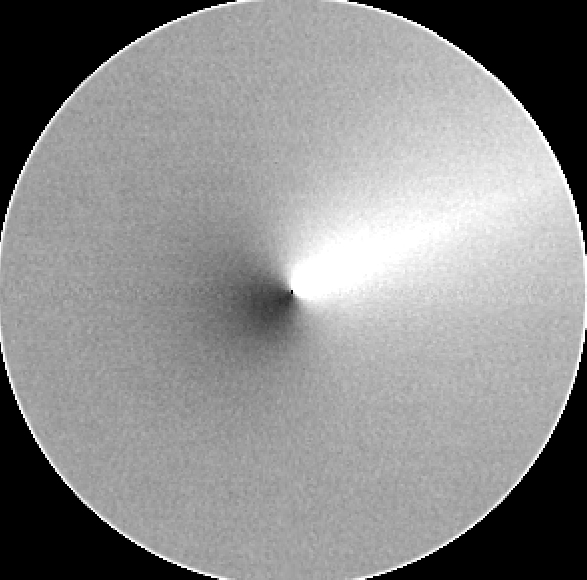
Toni Scarmato's spatial structure enhancement of my B, V and r' images (using a LS filter after 4x4 subpixelation). At all 3 bands there appear to be jet structures, which (in the case of r'-band, responsive to dust) are swept back into filaments that join the tail).
Zoom of inner coma of Whitmer a G-band image (FOV = 3.1 x 3.1 'arc) after spatial enhancement using the PSI web site "Cometary Coma Image Enhancement Facility" (division by azimuthal average). Credit: Planetary Society Institute (PSI) "Cometary Coma Image Enhancement Facility" (Samarasinha, N. H., Martin, M. P., Larson, S. M, 2013. Cometary Coma Image Enhancement Facility, http://www.psi.edu/research/cometimen). Left panel is "Division by Azimuthal Average" and right panel is "Radially Variable Spatial Filtering" filter (plus a MaxIm Dl "digitial development" enhancement).
All enhanced images are compatible with jets on all sides that are quickly pushed to the side and backward (by solar wind) to form filaments that join the tail.
V-band
Coma V-mag vs. photometry aperture diameter.
For a 60,000 km diameter V-mag = 6.44. Total V-mag will be < 5.25.
For coma diameter = 250,000 km, V-mag = 5.31.
Determining total flux using APT's oval photometry aperture 119/31/27 (oval length, width & angle).Oval width 1x & 1.525x larger was used to establish total comet counts minus sky background counts.
A star-aligned stacked image was created from the same images used to create the comet-aligned image (used in the above APT measurement of total comet counts minus background counts), and manual readings of star fluxes were used to determine a conversion of counts to magnitude. This allowed for the determination of the following:
Total V-mag (coma plus tail) = 5.12 ± 0.05 (estimated SE).
B-band
Coma B-mag vs. photometry aperture diameter.
A star-aligned stacked image was created from the same images used to create the comet-aligned image (used in the above APT measurement of total comet counts minus background counts), and manual readings of star fluxes were used to determine a conversion of counts to magnitude. This allowed for the determination of the following:
Total B-mag (coma plus tail) = 5.48 ± 0.05 (calculated SE).
For coma diameter = 250,000 km, B-mag = 5.65.
2013.11.12 Kaye V-band
Kaye obtained 34 images with the Tenagra 32-inch telescope, using a V-band filter.
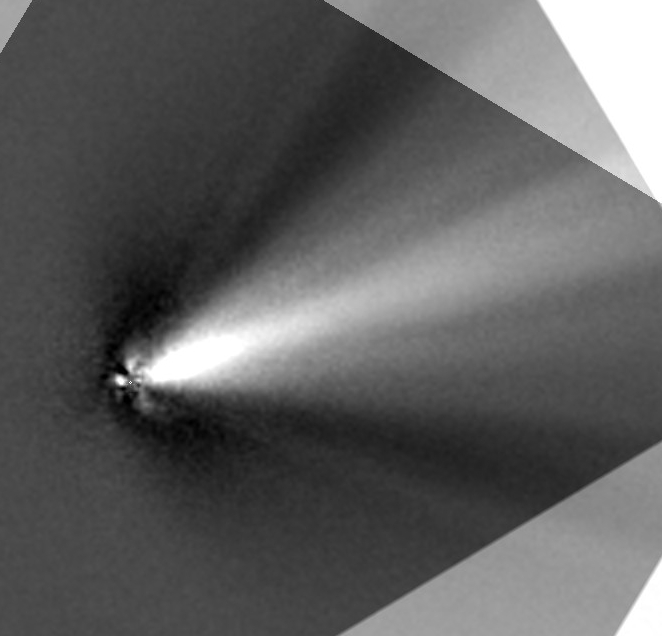
Complicated re-mapping of brightness to displayed brightness, intended to reveal presence of coma structure.
The PSI web site "Cometary Coma Image Enhancement Facility" is "down" so I can't show a fancy spatial image structure enhancement version of this image. No structure is evident in the above image, however.
2013.11.12 Whitmer V-band
Whitmer obtained 110 30-second images with G filter (~ V-band), using a14-inch telescope that was comet-guided. A group of 30 images in this sequence are used for the following analysis.
Complicated remapping of brightness to displayed brightness meant to show presence of structure within the coma. FOV = 13.6 x 9.5 'arc.
V-band brightness (based on Whitmer G-band images) of the coma versus coma diameter.
For a 60,000 km coma diameter V-mag = 9.50. Total V-mag must be < 8.5.
2013.11.11 Whitmer V-band
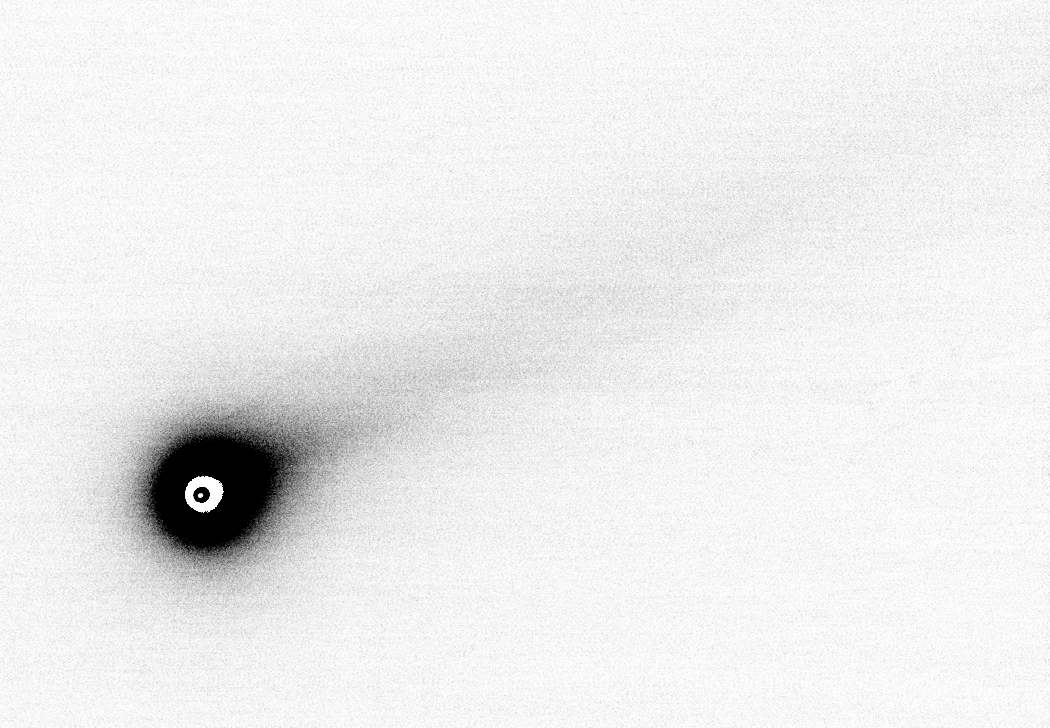
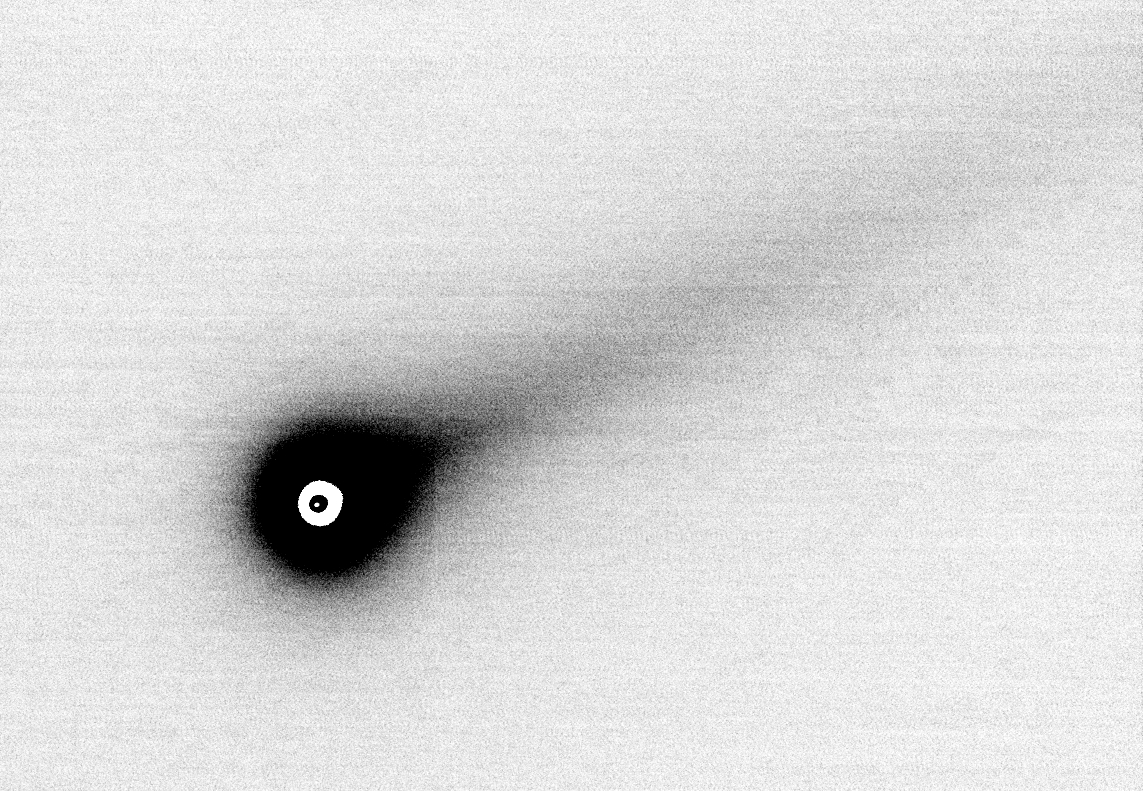
Whitmer obtained 110 30-second images with G filter (~ V-band), using a14-inch telescope that was comet-guided. A group of 53 images early in this sequence are used for the following analysis.
Complicated remapping of brightness to displayed brightness meant to show presence of structure within the coma. FOV = 14.7 x 10.1 'arc.
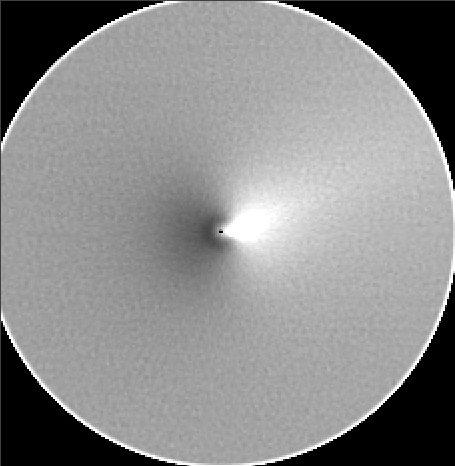
Zoom of inner coma (FOV = 2.9 x 3.0 'arc) after spatial enhancement using the PSI web site "Cometary Coma Image Enhancement Facility" (division by azimuthal average). Credit: Planetary Society Institute (PSI) "Cometary Coma Image Enhancement Facility" (Samarasinha, N. H., Martin, M. P., Larson, S. M, 2013. Cometary Coma Image Enhancement Facility, http://www.psi.edu/research/cometimen).
I see no evidence for coma structure (e.g., a jet) in this spatial structure enhancement.
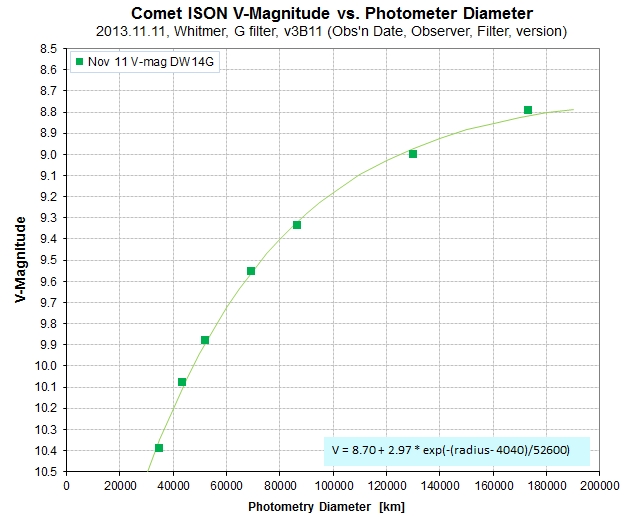
V-band brightness (based on Whitmer G-band images) of the coma versus coma diameter.
For a 60,000 km coma diameter V-mag = 9.73. Total V-mag must be < 8.70.
Note: Since the comet has come closer to us it is starting to "fill" the camera CCD FOV in a way that I've had to develop a new ay for measuring V-mag vs. aperture. From this date forward I will use the new method. It permits an accurate determination of magnitude vs. photometry diameter for a much larger coma region, but not large enough to extrapolate to "total magnitude." It will no longer be possible to use the Whitmer images for determining "total magnitude" because the comet's tail extends beyond the Whitmer FOV. The Gary FOV is currently sufficiently large to permit total magnitude estimates. (The Kaye FOV is too small for total mag's.)
2013.11.10 Whitmer V-band
Whitmer obtained 110 30-second images with G filter (~ V-band), using a14-inch telescope that was comet-guided. All images were used in the following analysis.
Complicated remapping of brightness to displayed brightness meant to show presence of structure within the coma. FOV = 15 x 10 'arc.
Zoom of inner coma (FOV = 3.7 x 3.7 'arc) after spatial enhancement using the PSI web site "Cometary Coma Image Enhancement Facility" (division by azimuthal median). Credit: Planetary Society Institute (PSI) "Cometary Coma Image Enhancement Facility" (Samarasinha, N. H., Martin, M. P., Larson, S. M, 2013. Cometary Coma Image Enhancement Facility, http://www.psi.edu/research/cometimen).
No coma structure is evident in this spatial enhancement.
Determining total flux using APT's oval photometry aperture 119/31/27 (oval length, width & angle). Oval width 1x & 2x larger was used to establish sky background counts.
Total Rc-mag = 8.04 ± 0.08 (estimated SE). This mg is too uncertain for including in the plot of mag's vs. date.
The comet is getting too close for measuring total mag's using Whitmer's images because of the size of his FOV. The analysis for an inner coma magnitude was hampered by a paucity of reference stars, so ther is no info on inner coma V-mag for this date from our group.
2013.11.09 Whitmer V-band
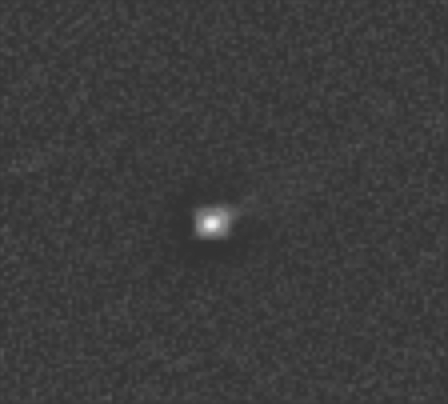
Whitmer obtained 140 30-second exposures with G-band filter (similar to V-band). The sharpest 34 of the last 40 images are analyzed below.
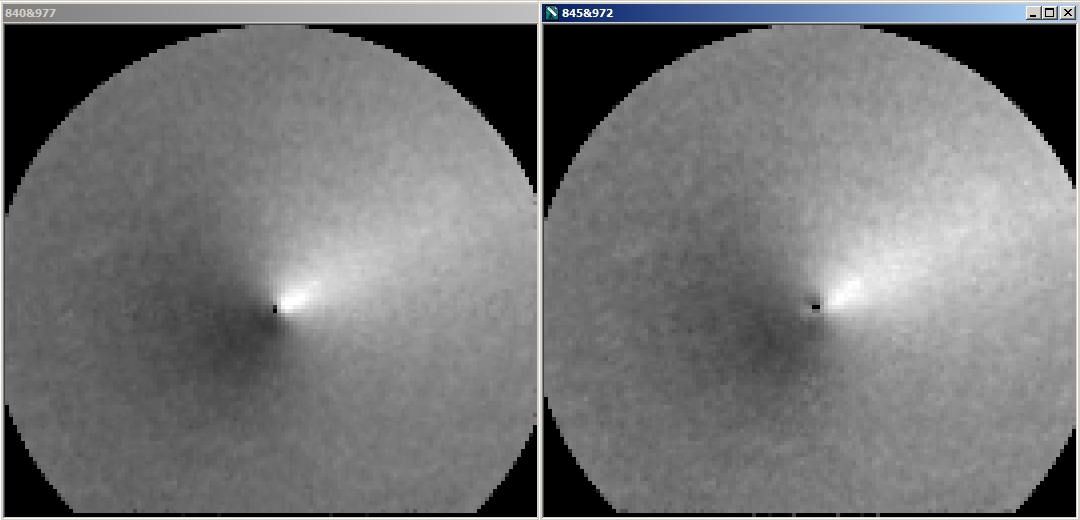
Complicated conversion of brightness to displayed brightness meant to show coma structure. FOV 14.7 x 11.0 'arc.
Spatially enhanced innermost part of the coma, FOV = 1.7 x 1.6 'arc, using the PSI web site "Cometary Coma Image Enhancement Facility" (division by azimuthal median). Credit: Planetary Society Institute (PSI) "Cometary Coma Image Enhancement Facility" (Samarasinha, N. H., Martin, M. P., Larson, S. M, 2013. Cometary Coma Image Enhancement Facility, http://www.psi.edu/research/cometimen). Division by Azimuthal Median algorithm. The two images use different filter placements along the x-axis.
Another spatially enhanced version of the innermost part of the coma, FOV = 1.4 x 1.3 'arc, using the PSI web site "Cometary Coma Image Enhancement Facility" (division by azimuthal median). Credit: Planetary Society Institute (PSI) "Cometary Coma Image Enhancement Facility" (Samarasinha, N. H., Martin, M. P., Larson, S. M, 2013. Cometary Coma Image Enhancement Facility, http://www.psi.edu/research/cometimen). Radially Variable Spatial Filtering (2,2,0.2). I see no evidence for coma structure.
Any coma structure is too small, or too faint, to show up in my spatial enhancements.
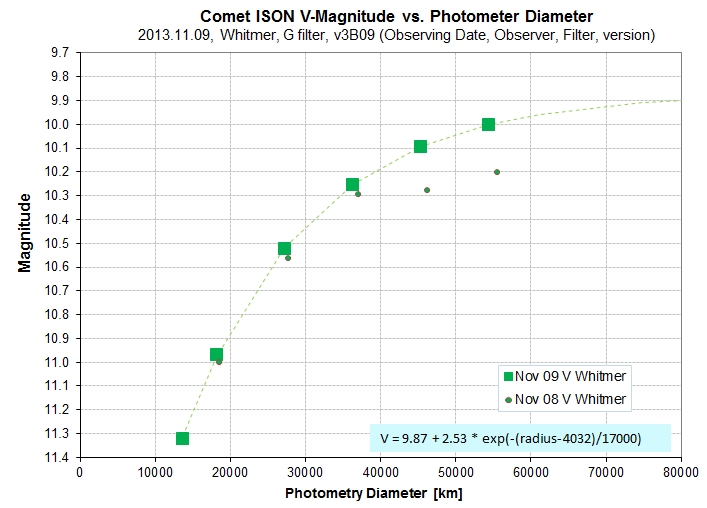
V-band brightness (based on Whitmer G-band images) of the inner coma versus coma diameter.
For a 60,000 km coma diameter V-mag = 9.97. Coma diameter ~ 40,000 km.
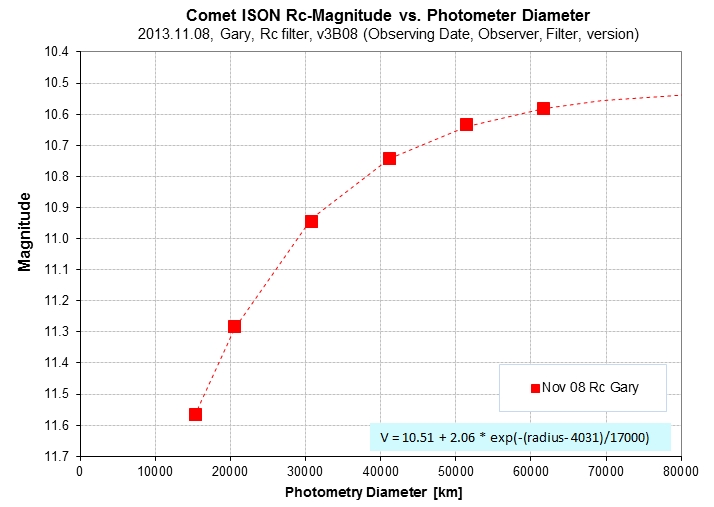
2013.11.08 Gary B, V, Rc-band
Gary observed with B, V and Rc filters from 11:39 to 12:42 UT with a Celestron 11-inch telescope.
Rc-band
27 Rc-band images were used in the following analysis.
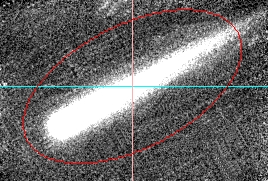
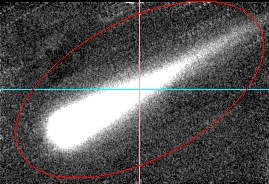
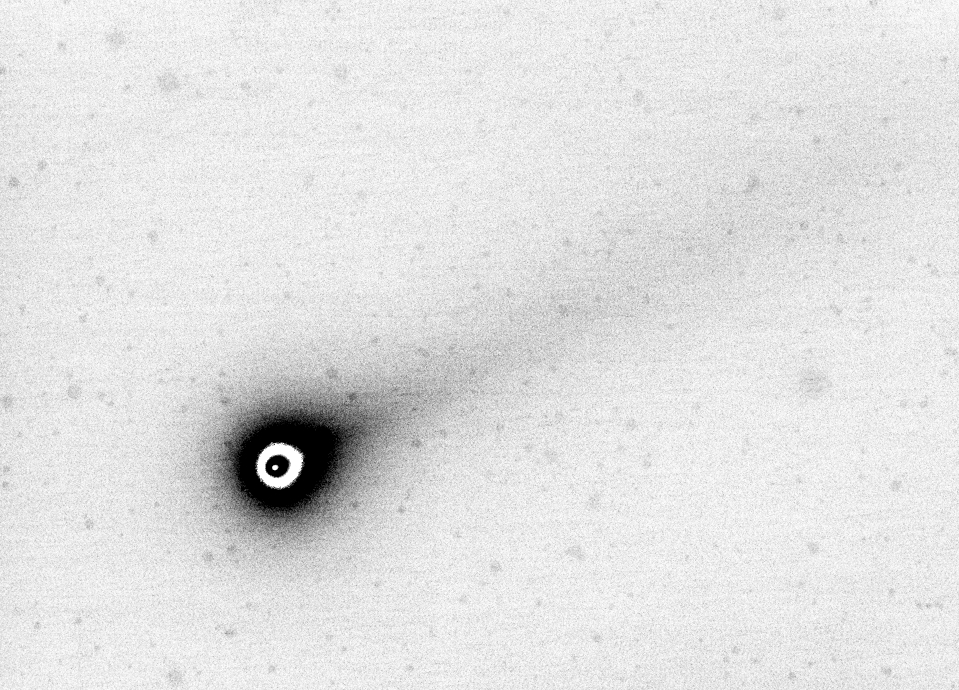
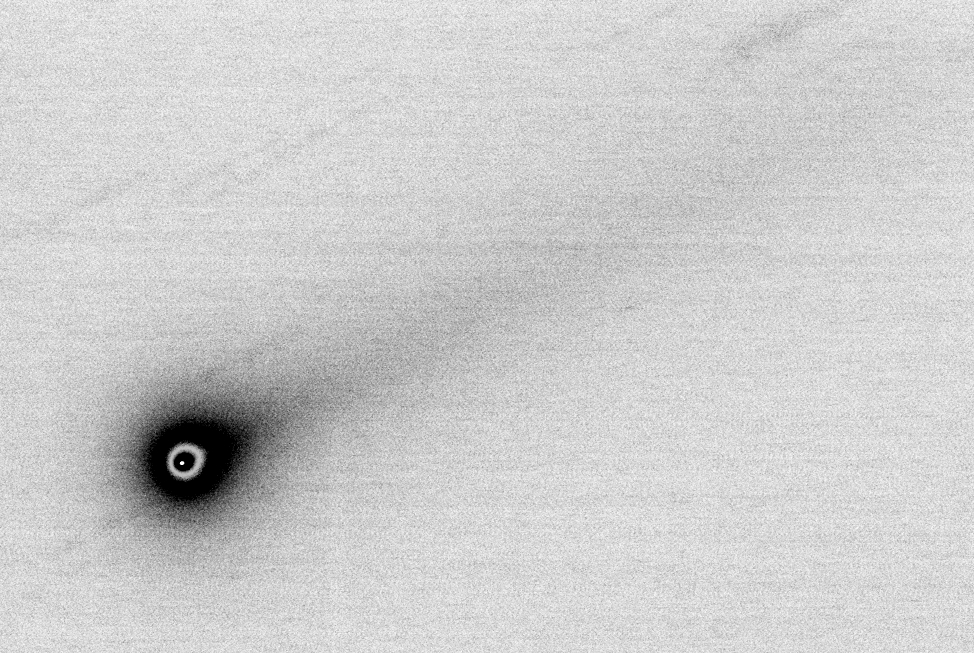
Complicated conversion of brightness to displayed brightness meant to show coma structure. FOV 28.5 x 19.1 'arc. (The tail is ~ 25 'arc long.)
Rc-band brightness (based on Gary Rc-band images) of the inner coma versus coma diameter.
For a 60,000 km coma diameter Rc-mag = 10.59. Coma diameter ~ 35,000 km (i.e, it's still compressed - due to solar wind pressure).
Determining total flux using APT's oval photometry aperture 119/31/27 (oval length, width & angle). Oval width 2x & 2.2.45x larger was used to establish sky background counts.
Total Rc-mag = 8.49 ± 0.03.
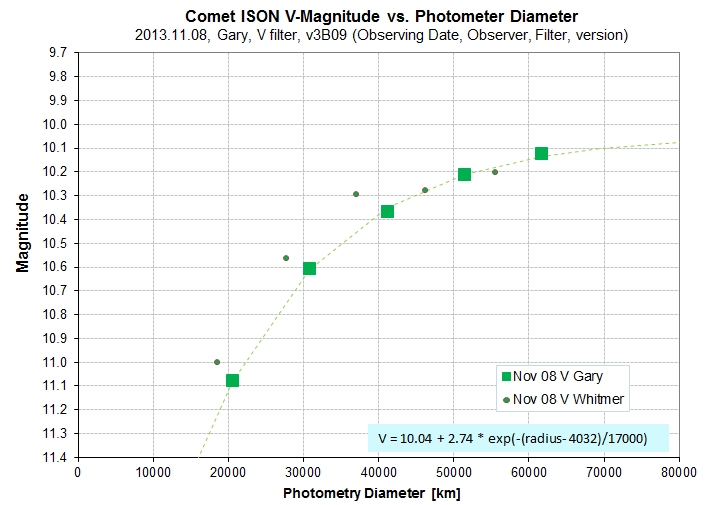
V-band
V-band brightness (based on Gary V-band images) of the inner coma versus coma diameter.
For a 60,000 km coma diameter V-mag = 10.15. Coma diameter ~ 41,000 km (i.e., it's still compressed - due to solar wind pressure).

Determining total flux using APT's oval photometry aperture 136/35/28 (oval length, width & angle). Oval width 2x larger was used to establish sky background counts.
Total V-mag = 7.90 ± 0.03.
True color using Gary's B, V and Rc-band Nov 08 images.
The coma is still green and the tail is still red.
2013.11.08 Whitmer G-band
Whitmer obtained 120 G-band, comet-guided, 30-second exposures. The sharpest 45 are analyzed below.
Complicated conversion of brightness to displayed brightness meant to show coma structure. FOV 12.3 x 8.9 'arc. (Spots are residuals of "hot pixels" that couldn't be removed.)
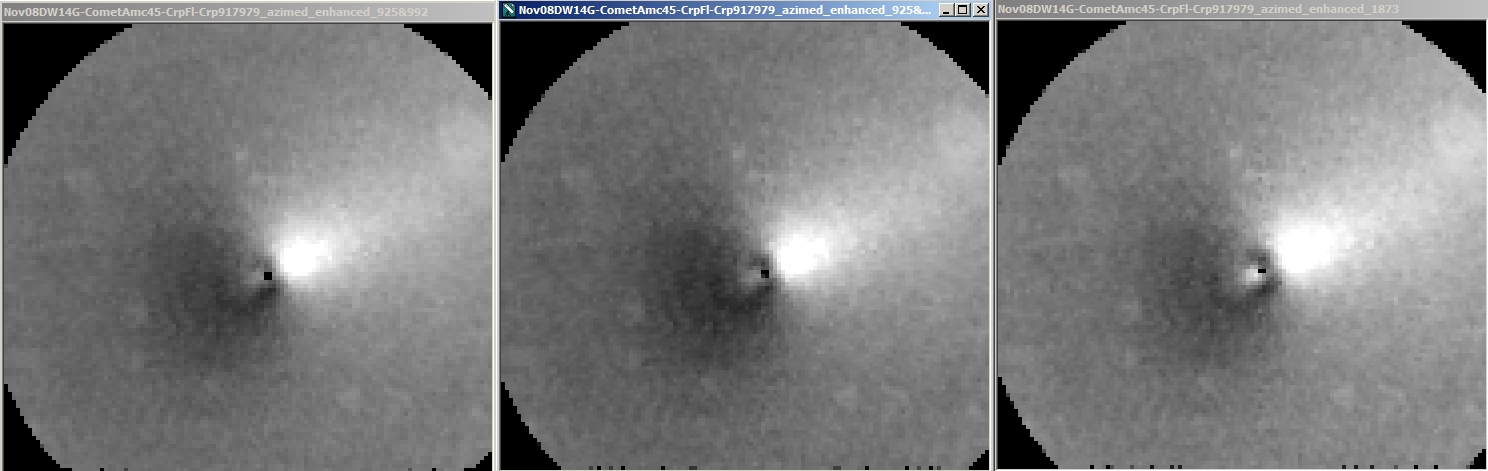
FOV = 1.6 x 1.5 'arc. Spatial enhancement using the PSI web site "Cometary Coma Image Enhancement Facility" (division by azimuthal median). Credit: Planetary Society Institute (PSI) "Cometary Coma Image Enhancement Facility" (Samarasinha, N. H., Martin, M. P., Larson, S. M, 2013. Cometary Coma Image Enhancement Facility, http://www.psi.edu/research/cometimen). Each image uses a different filter placement along the x-axis. Maybe there's structure on the sun-facing side.
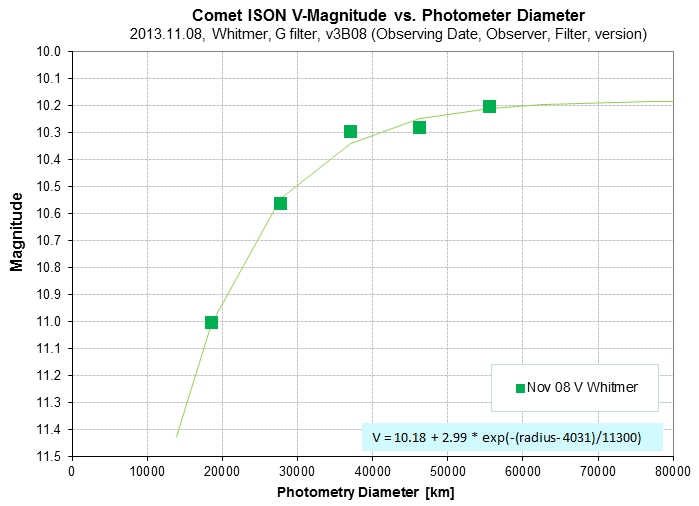
V-band brightness (based on Whitmer G-band images) of the inner coma versus coma diameter.
For a 60,000 km coma diameter V-mag = 10.20.
2013.11.07 Whitmer G-band
Whitmer obtained 140 G-band (Astrodon green filter) images, 30-second exposures, comet-guided.
Stack of sharpest 25 images used with the "curves tool" for re-mapping brightness to displayed brightness in an attempt to see the presence of coma structure. I see no evidence for anything.
Spatial enhancement using the PSI web site "Cometary Coma Image Enhancement Facility" (division by azimuthal median). Credit: Planetary Society Institute (PSI) "Cometary Coma Image Enhancement Facility" (Samarasinha, N. H., Martin, M. P., Larson, S. M, 2013. Cometary Coma Image Enhancement Facility, http://www.psi.edu/research/cometimen). Each image uses a different filter placement. I'm still clueless about the presence of any coma structure (e.g., "jet").
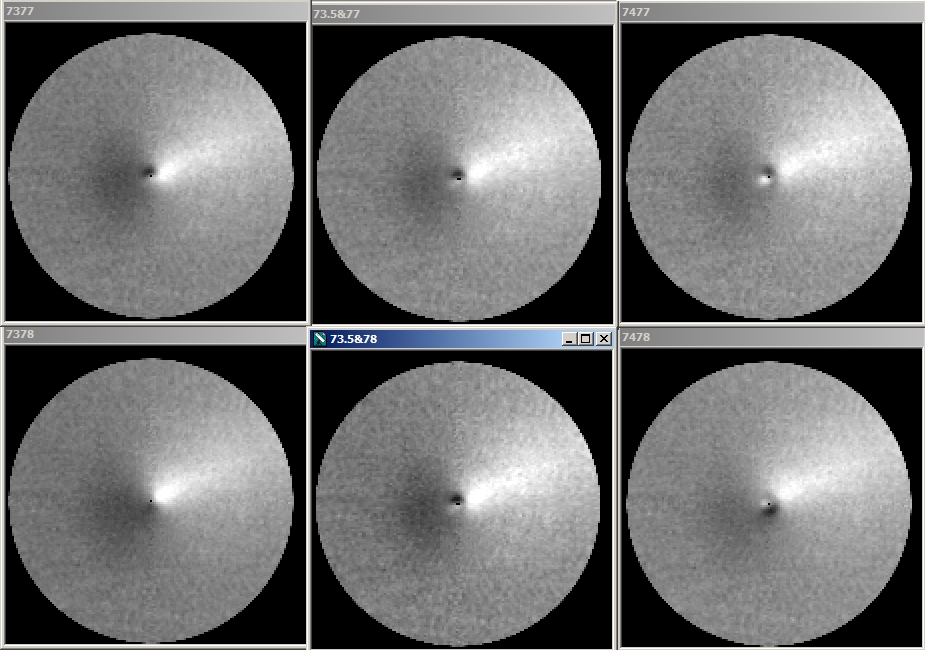
2013.11.06 Gary B, V, Rc, g', r', i'-band
Gary obtained 152 20-second images using 6 filters. The goal is to update the comet's SED (wide-band Spectral Energy Distribution). Since the pro's are using high spectral resolution for measuring an increased activity level of molecular emission (CN, C2, OH) this finding should be borne out by an increase in my B, V and g'-band magnitudes in a predictable manner. My plan is to compare the brightnesses in these 3 bands (that include emission by these 3 molecules) to see how compatible my magnitudes are with the quantitative molecular emission rates measured by the professionals.
B-band, median combine of 30 images, brightness re-mapped using "curves" tool. FOV = 29 x 20 'arc.
Zoom by factor ~ 10, FOV = 3.8 x 3.5 'arc, original image rotated 27 degrees clockwise, showing enhanced spatial structure using the PSI "Cometary Coma Image Enhancement Facility" (division by azimuthal median). Credit: Planetary Society Institute (PSI) "Cometary Coma Image Enhancement Facility" (Samarasinha, N. H., Martin, M. P., Larson, S. M, 2013. Cometary Coma Image Enhancement Facility, http://www.psi.edu/research/cometimen)
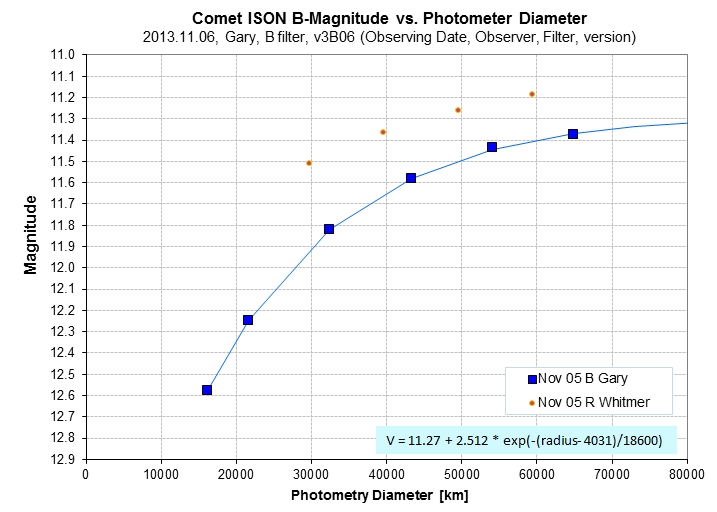
B-band brightness (based on Gary B-band images) of the inner coma versus coma diameter.
For a 60,000 km coma diameter B-mag = 11.40. "Diameter" of coma ~ 43,000 km.
V-band
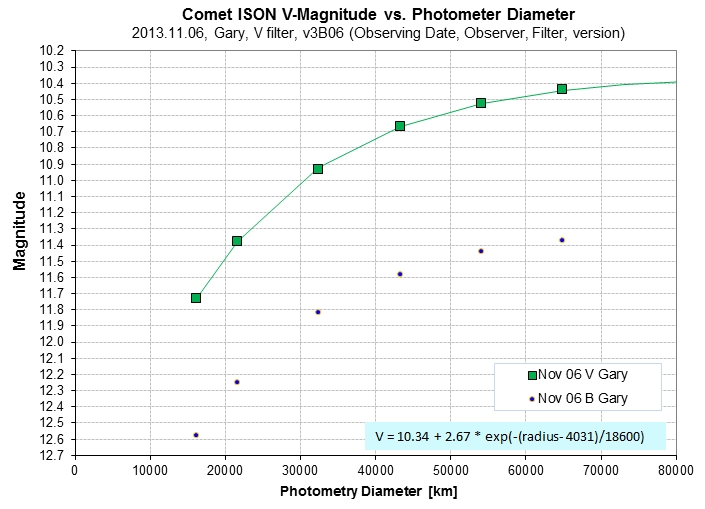
V-band, median combine of 19 images, brightness re-mapped using "curves" tool. FOV = 31 x 21 'arc.
V-band brightness (based on Gary V-band images) of the inner coma versus coma diameter.
For a 60,000 km coma diameter V-mag = 10.49. "Diameter" of coma ~ 43,000 km (same as for B-band).
Rc-band
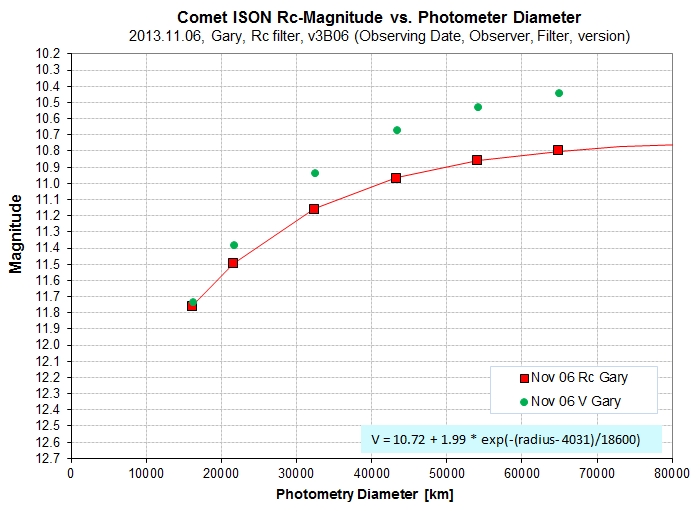
Rc-band, median combine of 23 images, brightness re-mapped using "curves" tool. FOV = 31 x 21 'arc. (The tail is => 26 'arc long.)
Rc-band brightness (based on Gary images) of the inner coma versus coma diameter.
For a 60,000 km coma diameter Rc-mag = 10.82. "Diameter" of coma ~ 38,000 km (same as for B-band).
Determining total flux using APT's oval photometry aperture 125/30/28 (oval length, width & angle). Oval width 2x larger was used to establish sky background counts.
Total Rc-mag = 8.57 ± 0.03.
With just B, V and Rc-band magnitudes we can evaluate the Spectral Energy Distribution (SED) to see how active the production of molecules is.
Spectral Energy Distribution (SED) for Nov 06.
Wow! Lot's of gas molecules are present in the inner coma (60,000 km diameter). At V-band the flux is twice what it would be in the absence of molecular emission.
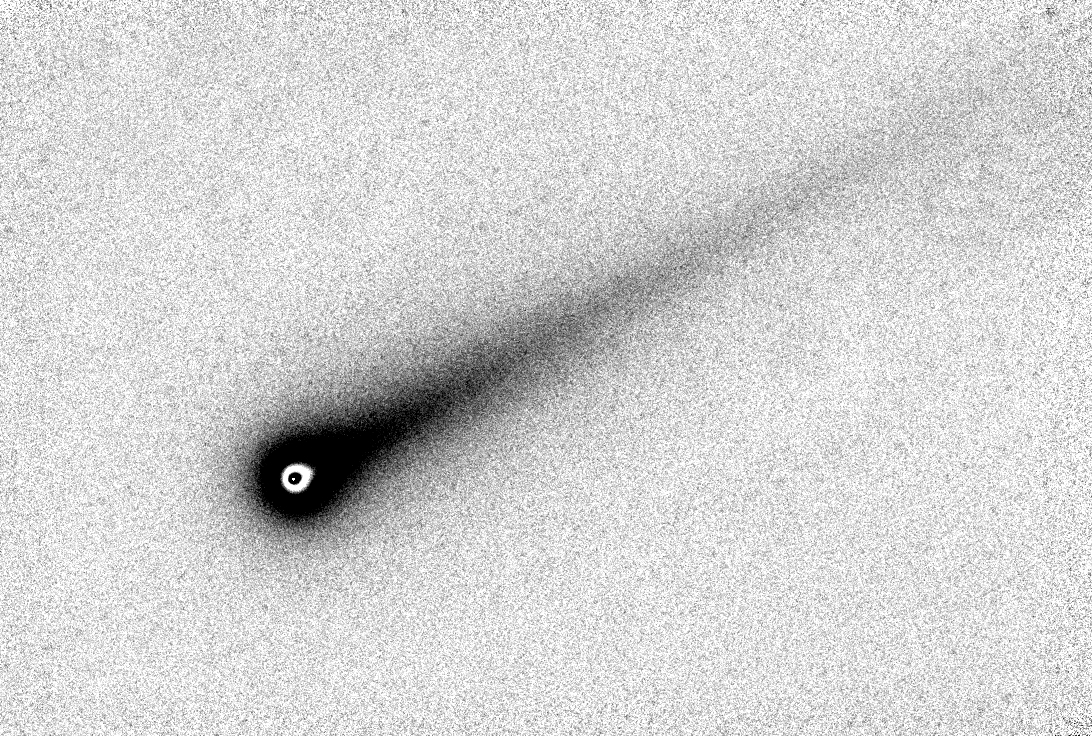
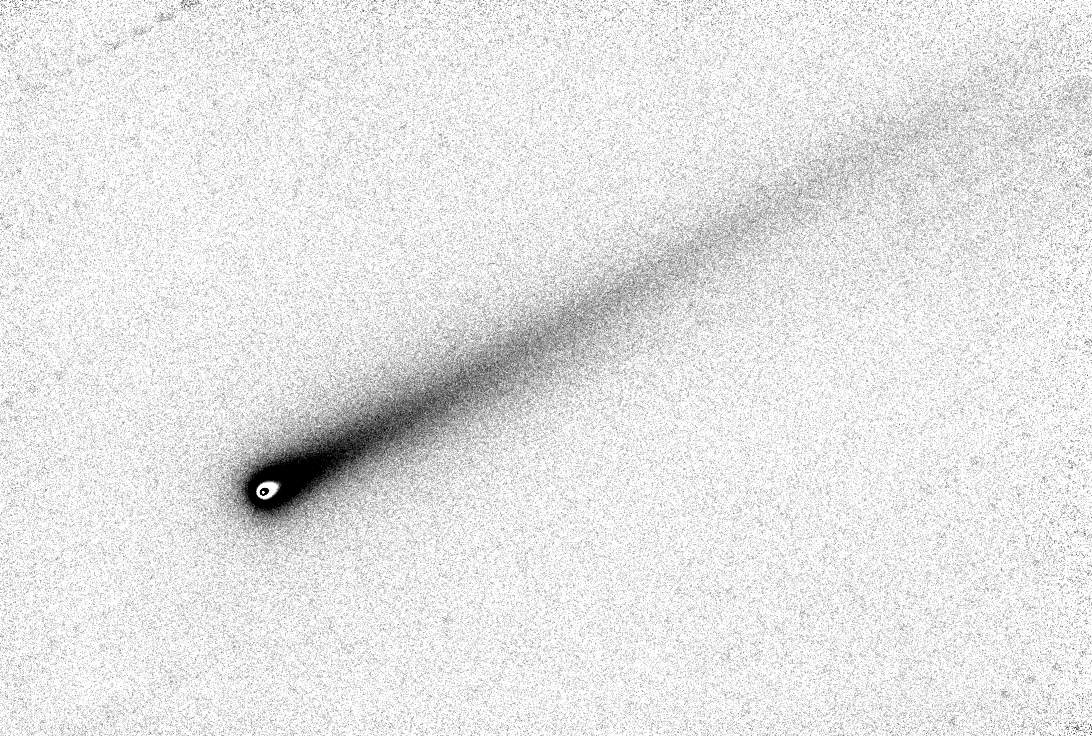
True color image of Comet ISON, Nov 06, made from 30 B-band, 19 V-band (green) and 23 Rc-band images (all 20-second exposures with a 11-inch Celestron telescope).
As I've written on this web page many times, the greenish coma is due to molecular gas emission whereas the red tail is due to dust particles reflecting sunlight with an albedo that increases with wavelength. The increase in coma brightness must be due to an increase in the production of gas molecules from the nucleus.
2013.11.06 Kaye R-band
Kaye obtained 66 20-second, R-band images. Just one problem: I submitted comet coordinates for the wrong date and the nice, big 32-inch telescope observed where the comet will be tonight, not last night!
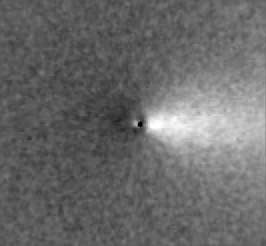
2013.11.06 Whitmer R-band
Whitmer obtained 100 30-second, comet-guided R-band images. I've used the sharpest 56 images for the following analysis.
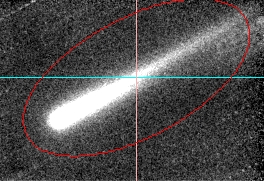
Left: Median combine, cropped to FOV = 2.6 x 2.1 'arc, and re-mapping of brightness using MaxIm DL's "curves" tool.
Middle: Radially Variable Spatial Filtering (RVSF) spatial enhancement (using PSI "Cometary Coma Image Enhancement Facility").
Right: Same as middle but remapping brightness using MaxIm DL's "curves" tool.
The RVSF spatial enhancement (above-middle image) was made using the Planetary Society Institute (PSI) "Cometary Coma Image Enhancement Facility" (Samarasinha, N. H., Martin, M. P., Larson, S. M, 2013. Cometary Coma Image Enhancement Facility, http://www.psi.edu/research/cometimen), using the experimental filter "Radially Variable Spatial Filtering" (RVSF) created by Steve Larson and not yet released to the public domain. I have insufficient experience with the PSI spatial enhancement facility to state that the coma structure in the above image is real, nor am I willing to state that there is no jet in the image.
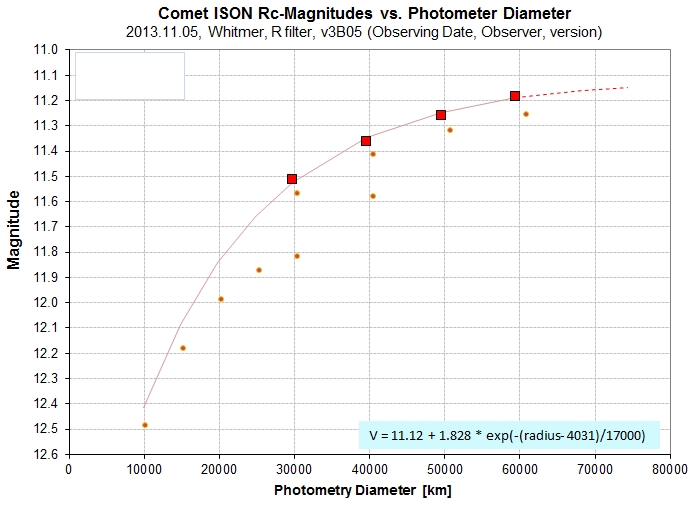
2013.11.05 Whitmer R-band
Whitmer obtained 80 30-second, comet-guided R-band images, but clouds ruined all but 3 images. These 3 were at least enough to rule-out a significant change in coma brightness.
Rc-band brightness (based on Whitmer R-band images) of the inner coma versus coma diameter.
For a 60,000 km coma diameter Rc-mag = 11.19. "Diameter" of coma is too uncertain for a measurement.
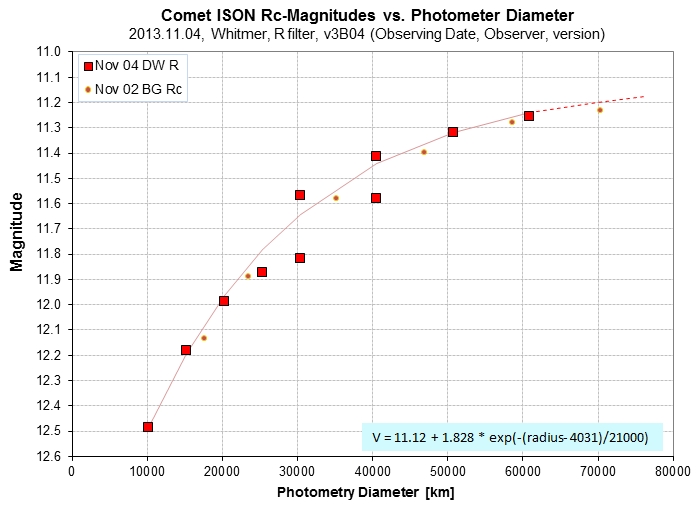
2013.11.04 Whitmer R-band
Whitmer obtained 80 30-second, comet-guided R-band images. The best 62 are used for the following analysis.
Greatly zoomed & cropped image, FOV = 1.9 x 1.9 'arc, using complicated conversion of true brightness to displayed brightness, meant to show presence of coma structure.
Rc-band brightness (based on Whitmer R-band images) of the inner coma versus coma diameter.
For a 60,000 km coma diameter Rc-mag = 11.26. "Diameter" of coma is ~ 39,000 km.
2013.11.02 Preliminary Comments
As the comet/Earth distance decreases it is appearing larger in a CCD's field-of-view (FOV). The three observers for this web site have the following FOVs (image scale and typical "seeing" are also listed) :
Gary 11-inch 31.1 x 21.0 'arc 0.86 "arc/pixel 3.0 "arc
Whitmer 14-inch 16.4 x 13.1 'arc 0.77 "arc/pixel 2.9 "arc
Kaye 32-inch 14.7 x 14.7 'arc 0.86 "arc/pixel 2.2 "arc
The Gary FOV will include more of the comet tail than the other FOVs. From now on, therefore, when Gary imaging is available on a given date those images will be given preference for measuring "total magnitude" brightness. The Gary images are usually binned 2x2 whereas the Whitmer images are unbinned (i.e., 1x1); this is by design, so that the Whitmer images can be used for evaluating the presence of coma structure. But the different image scale favors the Gary set for measuring coma brightness. The best "seeing" is at Kaye's Tenagra site, and the large telescope aperture translates to good signal-to-noise; both feature mean that the Kaye images are best suited for evaluating the presence of coma structure (e.g., jets). Gary has a complete filter set (BVRcIcu'g'r'i'z'Cb), so when a SED is needed his observations will be needed.
The purpose in presenting this information is to explain why on dates when more than one observer has images the image sets will be used for different purposes. On this date, for example, all three observers acquired images, so the Gary set is used for coma and total Rc-mag, the Kaye set is used for evaluating the presence of coma structure, and the Whitmer set is somewhat redundant to the Kaye set but can be used as an additional check for evaluating the presence of coma structure.
2013.11.02 Kaye R-band
Complicated conversion of measured brightness to displayed brightness for Kaye's Nov 02 R-band imaging (44 median-combine stack). No jet evident in this image.
I tried to enhance the original image using the Planetary Society Institute (PSI) "Cometary Coma Image Enhancement Facility" (Samarasinha, N. H., Martin, M. P., Larson, S. M, 2013. Cometary Coma Image Enhancement Facility, http://www.psi.edu/research/cometimen), using the experimental filter "Radially Variable Spatial Filtering" (RVSF) by Steve Larson (stated by Larson as an improvement over his earlier Larson-Sekanina, or LS filter, developed in the 1980s when both were at JPL). Here's the RVSF filter result:
Radially Variable Spatial Filtering spatial enhancement at the above-described PSI web site (which I enhanced using a "digital development" filter to show contrast more clearly.
And here's a "curves" version of the RVSF image:
Complicated conversion of RVSF image brightness to displayed brightness, meant to enhance contrast in a way that would show coma features more clearly.
I'm not experienced enough with spatial enhancing using the PSI web site to comment on whether or not coma structure is present.
Toni Scarmato enhanced the original image using the LS filter and other features found in Astroart, and he found a jet (link).
2013.11.02 Whitmer R-band
Complicated conversion of measured brightness to displayed brightness for Whitmer's Nov 02 R-band imaging (61 sharpest median-combine stack). No jet evident.
I used the PSI spatial structure image enhancing facility and found no jet, which is consistent with the above image.
2013.11.02 Gary B-, V- Rc-bands
True color image from Gary's B, V, Rc image sets. FOV = 31 x 21 'arc, north up, east left. Celestron 11-inch, 20-second exposures, 73 B, 59 V & 61 Rc, digital development.
Note: the brightest part of the coma looks white but that's because all colors are saturated; the brightest region is really reddish, suggesting that the very innermost part of the coma is dominated by dust (as the next image shows)!
2x zoom with lower brightness setting, showing the innermost coma (which is red). The transition from red to green occurs at a radius of 11,700 km. FOV = 15 x 9.7 'arc.
The coma is green and the tail is red, as with previous color images.
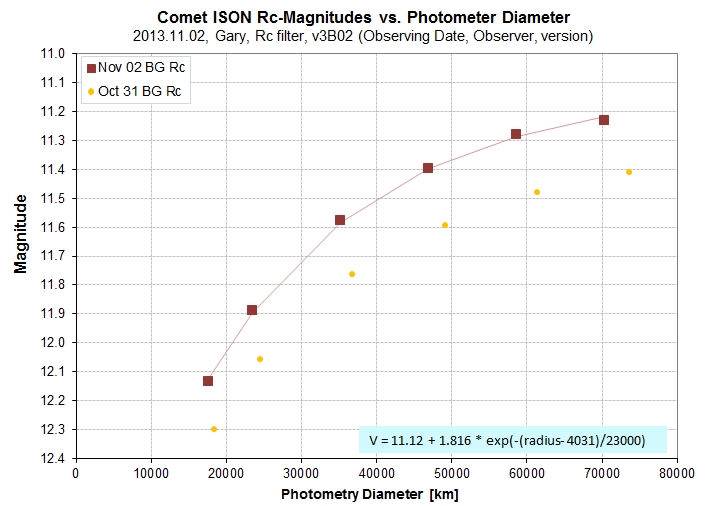
Rc-band brightness (based on Rc-band images) of the inner coma versus coma diameter.
For a 60,000 km coma diameter Rc-mag = 11.28. "Diameter" of coma is ~ 42,000 km.
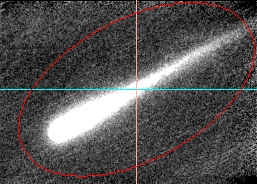
Determining total flux using APT's oval photometry aperture 129/30/28 (oval length, width & angle). Oval width 2x & 2.7x larger were used to establish sky background counts.
Total Rc-mag = 8.91 ± 0.03.
V-band brightness (based on Gary V-band images) of the inner coma versus coma diameter.
For a 60,000 km coma diameter V-mag = 11.10.
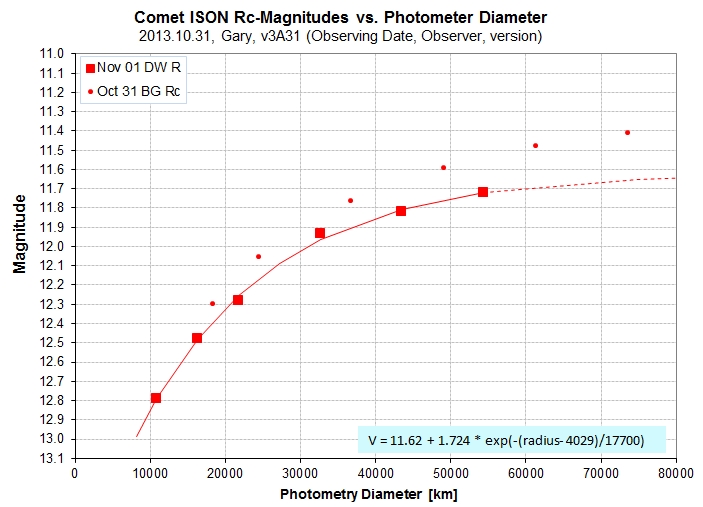
2013.11.01 Whitmer R-band
Complicated conversion of measured brightness to displayed brightness for Whitmer's R-band imaging (31 median-combine stack)
R-band brightness (based on Rc-band images) of the inner coma versus coma diameter.
For a 60,000 km coma diameter Rc-mag = 11.70. "Diameter" of coma is ~ 34,000 km.
2013.08.12 Recovery Observation
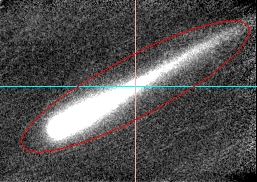
Here's a stacked image of Comet ISON made 2013 Aug 12, from 11:33 to 11:56 UT (with telescope having effective aperture of ~ 8 inches).
FOV = 32 x 22 'arc, north up, east left. Total number stars ~ 116; faintest has V~ 16.0. Median combine of 23 20-second exposures,
centered on 2013.08.12 11:40 UT. Elevation = 6.0 degrees, airmass = 8.7.
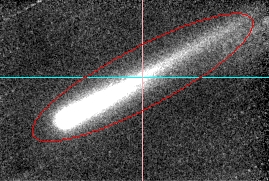
And here's a version where I star-aligned using the comet. The stars are oblong because the comet is moving.
FOV = 11 x 8.5 'arc of median combine using object of interest for image alignment (causing stars to become oblong). Coordinates of object: 08:14:31.81 +24:01:24.7 at 2013.08.12, 11:40 UT.
The images were made with a Celestron 11-inch telescope and SBIG ST-10XME CCD, providing a FOV = 32x22 'arc (the effective aperture was actually ~ 8 inches due to aperture blockage by my dome opening). Elevation = 6.0 degrees, airmass = 8.7. I used a Cb filter (clear with blue blocking), which has an effective wavelength similar to r'-band (also Rc-band), as determined by "star color sensitivity" analyses. It is perhaps noteworthy that in the above image there appears to be the beginnings of a tail, and it's pointed away from the sun (the sun is to left and slightly below this part of the sky).
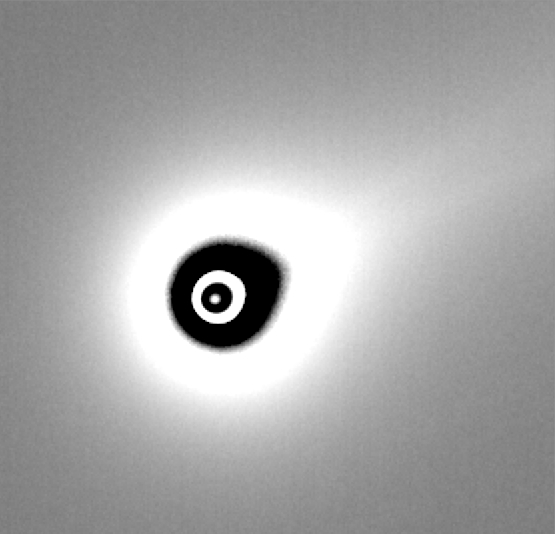
Magnitude vs. Photometry Aperture Size
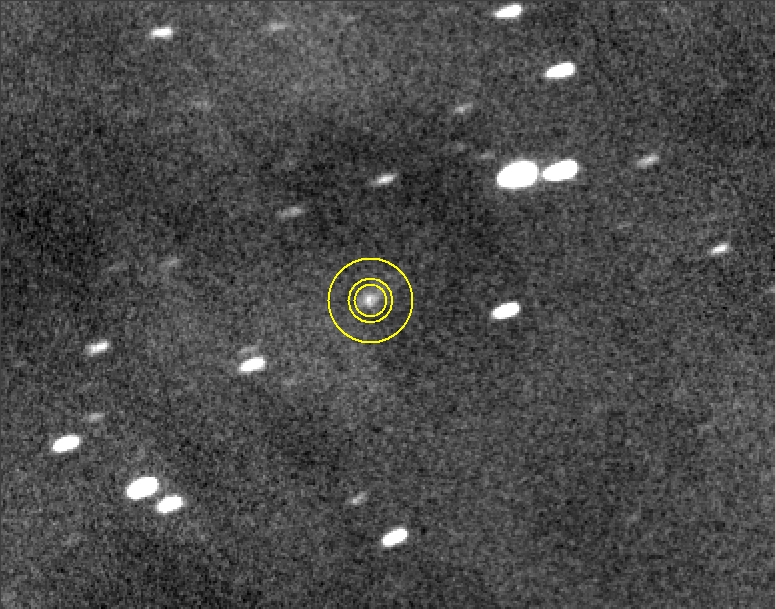
Example of a photometry aperture used for measuring the comet's magnitude (inner circle). For this example the radii are 8, 3 and 10 pixels (14, 5 and 18 "arc) for the signal aperture, gap annulus and sky background annulus. When the signal circle radius is increased the gap annulus is decreased, assuring that the sky background is the same for all photometry aperture sizes. Stars are "oblong" because image alignment was for the comet (to eliminate smearing of the comet).
Magnitudes were measured for photometry aperture radii ranging from 3 to 9 pixels (5 to 16 "arc). Seven nearby stars were chosen for establishing the calibration. APASS r'-magnitudes were used (accurate to ~ 15 mmag). A star magnitude versus star color (B-V) analysis was used to establish a magnitude offset that minimized chi-square (using a slope that has been established from other projects, +0.05 mag/mag). The RMS about this fit was typically 50 mmag; dividing by sqrt(6) yields an estimated SE for the magnitude calibration solution. (Another 15 mmag should be orthogonally added to account for the APASS calibration uncertainty, but that's a small oversight.)
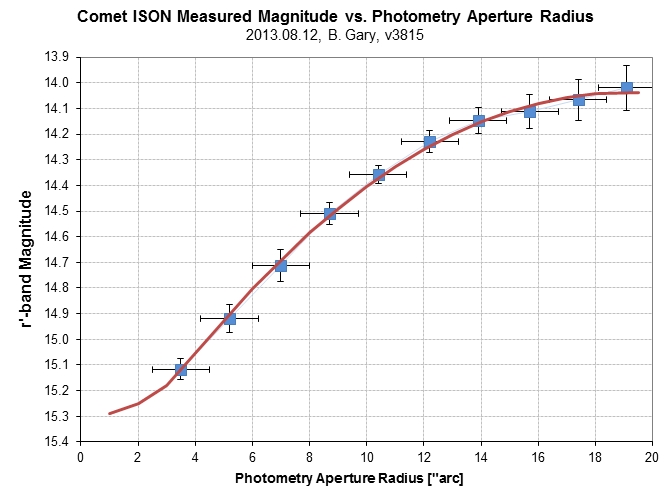
Comet r'-band magnitude versus photometry aperture radius, using 7 nearby stars with APASS r'-mag's for calibration.
The asymptote at a photometry aperture radius of ~ 17 "arc suggests that that's the size of the coma and only tail effects would increase brightness for further photometry aperture size increases. The small aperture end of this data doesn't level out, which of course is due to the fact that the nucleus is unresolved. I conclude that the integrated coma brightness has a r'-magnitude of 14.03 ± 0.08. Since Rc ~ r' - 0.21 ± 0.02 for a solar SED, I estimate that Comet ISON had Rc = 13.82 ± 0.08 (14.03 - 0.21) for the entire coma (photometry radius ~ 20 "arc). Using a 11.4 "arc photometry radius (corresponding to a 55,000 km diameter, as used by Scarmato & Morales), Rc = 14.08 ± 0.08 (14.29 - 0.21) on this date. Details and light curves for each of the 10 photometry apertures is given at : LCs
If the comet has a sun-like spectrum then it's V-magnitude should be ~ 14.20. This is intermediate between the JPL Horizons predicted "total" and "nucleus" magnitudes (13.43 and 14.78). If we interpret my 14.20 V-mag to include all of the coma and a small part of the tail then the comet is fainter than expected (using the JPL Horizons brightness model). It is fainter by ~ 0.77 ± 0.08 magnitude. Sorry about that!
Spectral Energy Distribution (SED) and Coma Size
"Spectral Energy Distribution" (SED) is a way to show how an object's brightness varies with wavelength. It offers a convenient way to compare the object's SED with the sun's SED, or a "blackbody" SED (an theoretical object that has 100% emissivity at all wavelengths at a designated temperature).
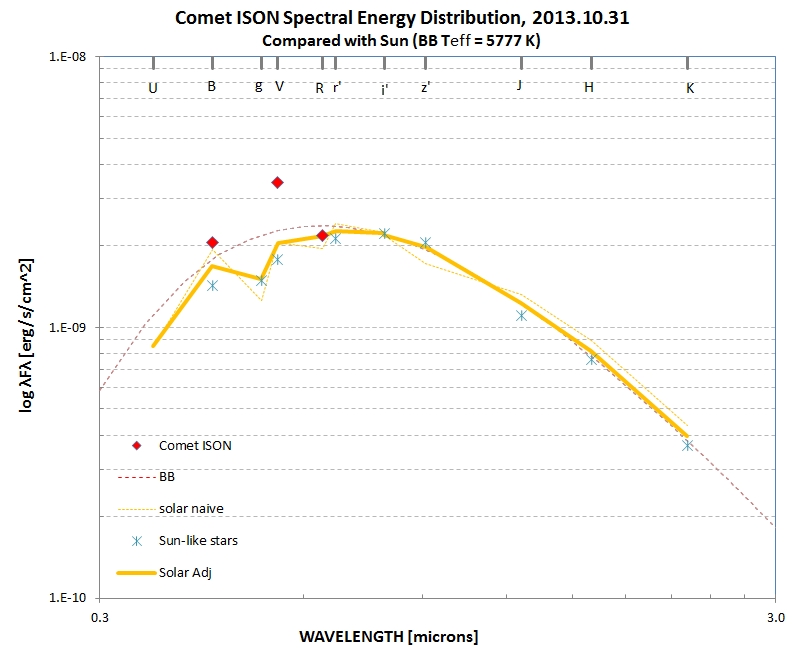
Spectral Energy Distribution (SED) on October 31, showing continued dominance of the coma's molecular emission at B and V bands compared with Rc-band (where none is expected).
Spectral Energy Distribution (SED) on November 06, showing an even greater amount of molecular emission (at B and V-bands) than at any time in the past. On this date the V-band flux is at least twice what it would be in the presence of only dust.
The coma is green due to molecular emission while the tail remains reddish, caused by dust particles that reflect sunlight with an albedo that increases with wavelength. The inner-most coma is reddish! This must be due to dust that has been recently ejected and not yet gotten a backwards push from sunlight. The rest of the coma is dominated by gas molecules that are not pushed back by sunlight, but instead absorb sunlight and re-emit in an excited state at short wavelengths (e.g., B, g' and V-bands).
Comet ISON appears to have become more active in ejecting volatiles (molecular CN, C2, OH, etc) and not especially active in ejecting dust.
Does the coma change size? Consider the following graph:
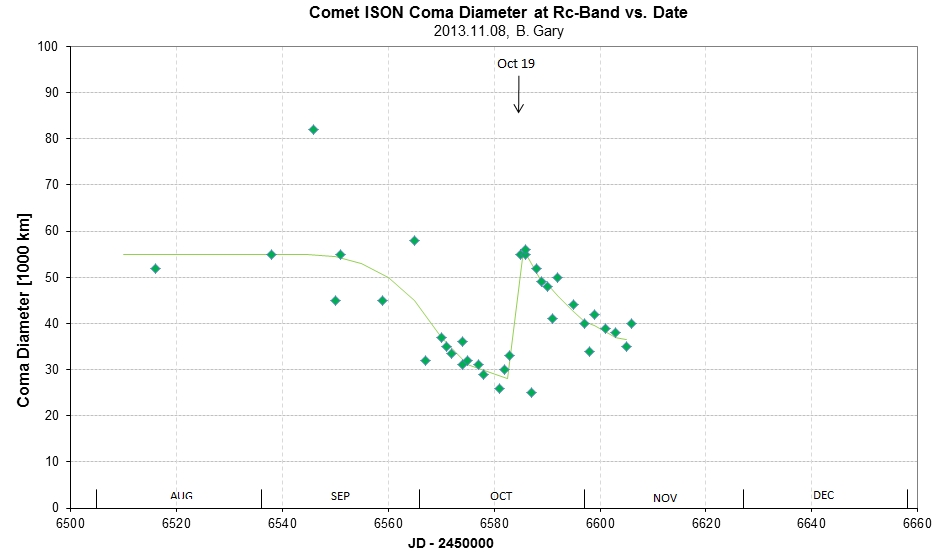
Size of coma (diameter, in 1000 km units) vs date. Diameter is defined by estimating large diameter asymptote Rc-mag, subtracting 0.3 mag, and finding the diameter with that brightness.
During Oct 01 to Oct 19 coma diameter appears to have decreased, and then abruptly rebounded to its original value? This is approximately when the coma faded ~ 0.5 mag and then returned to its original brightness. If the fade is due to snow evaporating then the snow would have to have been in the outer regions of the coma when it started evaporating (sublimating from ice to vapor). The size and brightness recovery in mid-October must be due to a new source of molecular outgasing, possibly due to new surface area being illuminated by sunlight. However, the coma began another decrease in size on Oct 19. Maybe this is due to increased solar wind pressure compressing the coma. Since the coma is brightening as it shrinks in size, so it have an increasing surface brightness.
Converting Magnitudes
If the comet has a solar-like "spectral energy distribution" (SED) then we can convert magnitudes using the following:
Rc = r' - 0.210 ± 0.006
V = r' + 0.166 ± 0.010
V = Rc + 0.376 ± 0.011
g'-r' = +0.457 ± 0.016
r'-i' = +0.168 ± 0.021
These conversions are based on 6 stars having the same B-V as the sun (~ 0.653) with accurate B, V and Rc magnitudes (Landolt (2009) and accurate g' and r' magnitudes (Smith et al, 2002).
If the comet's SED differs from sun-like, and it has a known color (B-V, or g'-r'), a slightly more complicated conversion from r' to Rc is possible:
Rc = r' - 0.1323 - 0.1081 * (B-V) RMS scatter off this fit = 0.010 mag
Some Thoughts About Measuring and Reporting Comet Magnitudes
There's an old saying by observationalist's that "A measured value without a specified uncertainty is not a measurement!" I have a similar comment about comet magnitudes. Any report of a comet magnitude without specifying the diameter of the coma included in the measurement is almost useless (since there's a several magnitude uncertainty due to what the included coma size could have been). I'm a newbie on comets, having had no interest in them before August 8, but a corollary of the previous statement should be that a "visual magnitude" report should be viewed as having an uncertainty of several magnitudes, and it therefore has marginal value unless a detailed description is given about how much of the comas was visible, etc. My version of the old observationalist's saying, applied to comets, is "A magnitude measurement without specifying how much of the coma was included, is not a measurement!"
Some observers have suggested that a reported magnitude should attempt to extrapolate to "total coma size" magnitude. I think that's a horrible idea, for it is impossible to define the extent of the coma; moreover, any extrapolation will add an uncertainty that will be far greater than the uncertainty of what can be measured for any specified size. A plot of magnitude versus photometry aperture diameter contains information that allows others to compare their magnitudes, which should be done for the same photometry aperture diameter. Since comets change their range to Earth, it makes sense to specify photometry aperture size in terms of diameter, in kilometers, at the comet's distance. For Comet ISON, for example, I have chosen a standard coma diameter of ~ 70,000 km, to be consistent with the Scarmato and Brosio magnitudes from before conjunction with the sun. By adopting a standard coma size for reporting magnitudes there is no uncertainty introduced by extrapolating to some coma size not capable of being measured. Even if an observer reports a magnitude for a non-standard photometry aperture (in "arc), this information can be converted to coma size in kilometer units and by assuming that the plot of magnitude versus coma size is the same for all observers at a given epoch a magnitude correction to a standard coma size can be made.
Another possible issue when reporting magnitudes has to do with different filter passbands. The SBIG R-band filter, for example, has an effective bandwidth of ~ 640 nm (for typical star colors), whereas the Cousins Rc-band filter has an effective wavelength of 624 nm. The SDSS r'-band filter has an effective wavelength of 620 nm. These values will differ from one telescope system to another due to differing CCD QE functions, differing atmospheric extinction versus wavelength functions, and differing transmissions of corrector plate optics. There's a way to correct for all of these effects, but I doubt that many observers go to the trouble to do it. You need to plot reference star magnitude versus reference star color (e.g., B-V), and adjust an offset for a zero crossing at the target's (estimated) color. I do this as a matter of course since photometry is my hobby, and I like dealing with these matters, but I doubt that any other Comet ISON magnitudes have been made with this attention to detail.
Finally, there's the matter of which magnitude catalog to use. By now it should be obvious that APASS is the one to use; it is even better than CMC14. The UCAC4 catalog includes APASS (DR 5) magnitudes, to V ~ 17. I recommend using the planetarium program C2A for this purpose. If you're observing with a R-band filter (either SBIG R, Rs, or Cousins R, Rc), it's a simple matter of converting the APASS BVgri magnitudes to Rc-magnitude using the equation Rc = r' - 0.1323 - 0.1081 * (B-V). If you're using a r'-band filter, then use the APASS r'-magnitudes, and later correct the comet's r'-mag to Rc-mag using the same equation, or if you want to assume that the comet has a solar-like spectrum just use Rc = r' - 0.205.
Whenever I read that measuring comet magnitudes is difficult, as if there's something inherently difficult about it, I roll my eyes and wonder how much laziness one should expect from observers. Any conscientious observers should be able to achieve an accuracy of ~ 0.05 magnitude for a standard coma size. Combining data by observers with this accuracy should be commonplace.
If something's worth doing, then it's worth doing right!
Primer on Asteroid/Comet Surface Temperatures
This section endeavors to account for the fading of Comet ISON since the July solar conjunction (refer to 2nd figure from top, on this web page). It makes use of an idea that three other people have independently thought about, and mentioned to me. Because it's such an obvious idea, I'll state it here. Comet ISON rotates with a pole facing the sun!
Why could this account for a fading behavior? Because only one small area, the sun-facing pole, receives sunlight in full force (normal incidence). Solar photons absorbed at the surface of this one region will produce a thermal wave of heating that penetrates into the subsurface.
Since all asteroids, and presumably all comets, have a regolith that resembles the moon's, let's review some of what has been learned about the moon's temperature field. The lunar regolith consists of a very porous layer ~ 2 centimeters deep, below which density (and thermal conductivity) increase asymptotically to a compacted value. Large vertical temperature gradients occur in the upper 10 cm because the rate of flow of heat (e.g., low thermal conductivity) into the regolith is slow. For the moon the diurnal thermal wave has an e-folding distance of ~ 7 cm, and at a depth of ~ 1/2 meter there is essentially no change in lunar regolith temperature during a lunar month. For an asteroid (or comet without a coma) rotating with a pole facing the sun, which is equivalent to a non-rotating asteroid, there will be a thermal wave that keeps penetrating deeper day-after-day, month-after-month, etc.
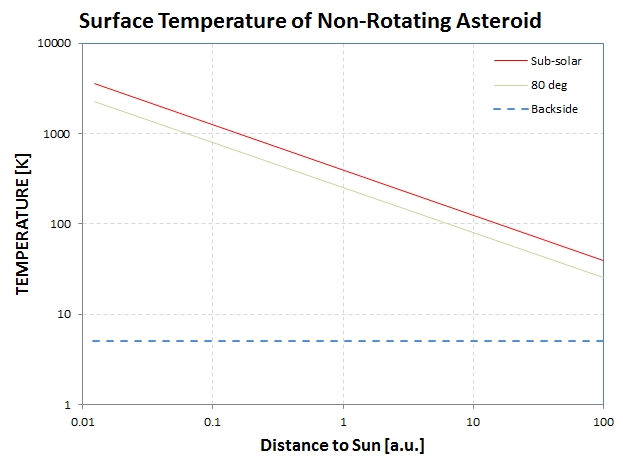
The most relevant publication on this subject is the recently published Icarus paper by Stephen Keihm et al (2103). But let's begin by first calculating the surface temperature around a spherical body versus distance from the sun using the moon as a reference. The moon's sub-solar surface temperature is ~ 380 K. Because of the lunar regolith's low thermal conductivity this temperature is an equilibrium temperature: incident flux equals outgoing flux. This allows us to imagine placing the moon at other distances and calculating the sub-solar temperature using the following equation:
Emissivity * StefanBoltzmanConstant * (Tsurf)^4 = (1-A) * SolarIncidentFlux * cosine(ø)
where ø is sunlight incidence angle (zero degrees at sub-solar point). Substituting and rearranging, and assuming that (1-A) = Emissivity, we have (provided by Keihm):
Tsurf (ø) = (394 / sqrt(r) ) * (cos (ø) )1/4
where r = comet/sun distance [a.u.]. The following graph was calculated from this equation.
Surface temperature of a non-rotating (or pole facing sun rotater) asteroid or coma-less comet.
Notice that the backside of the object is close to cold space temperature (2.7 K). Conduction horizontally across the surface will raise that temperature, but since I haven't modeled this the 5 K line is just a reminder that the backside will be very cold.
There's no single temperature where sublimation occurs in a vacuum; a finite sublimation rate exists at all temperatures. But a rule-of-thumb is that sublimation rate is proportional to T4 in the inner solar system. This is true for CO, CO2 and H2O for distances < 100, 10 and 2.5 a.u., respectively. Another way to state this is that sublimation rate is proportional to T4 for CO, CO2 and H2O for temperatures > ~ 40, 125 and 250 K. For greater distances (or cooler temperatures) the sublimation rate has a steeper dependence upon temperature.
Temperature decrease with sun-solar angular distance on the surface in accordance with the equation T(ß) = T(sub-solar) / (cos(ß))1/4, where ß is the sub-solar distance on the surface.
A consideration unique to comet nuclei is the presence of a coma that scatters and absorbs sunlight. It shields the nucleus surface from solar insolation that an asteroid would receive. Optical depths exceeding one could have a significant cooling effect on the nucleus surface. A detailed model must exist that considers scattering as well as absorption, and the redistribution of solar flux to all surface elements (even the back side). I haven't done this so I merely mention the coma as having a potentially important cooling effect on at least the front surface of the nucleus.
Great Amateur Images
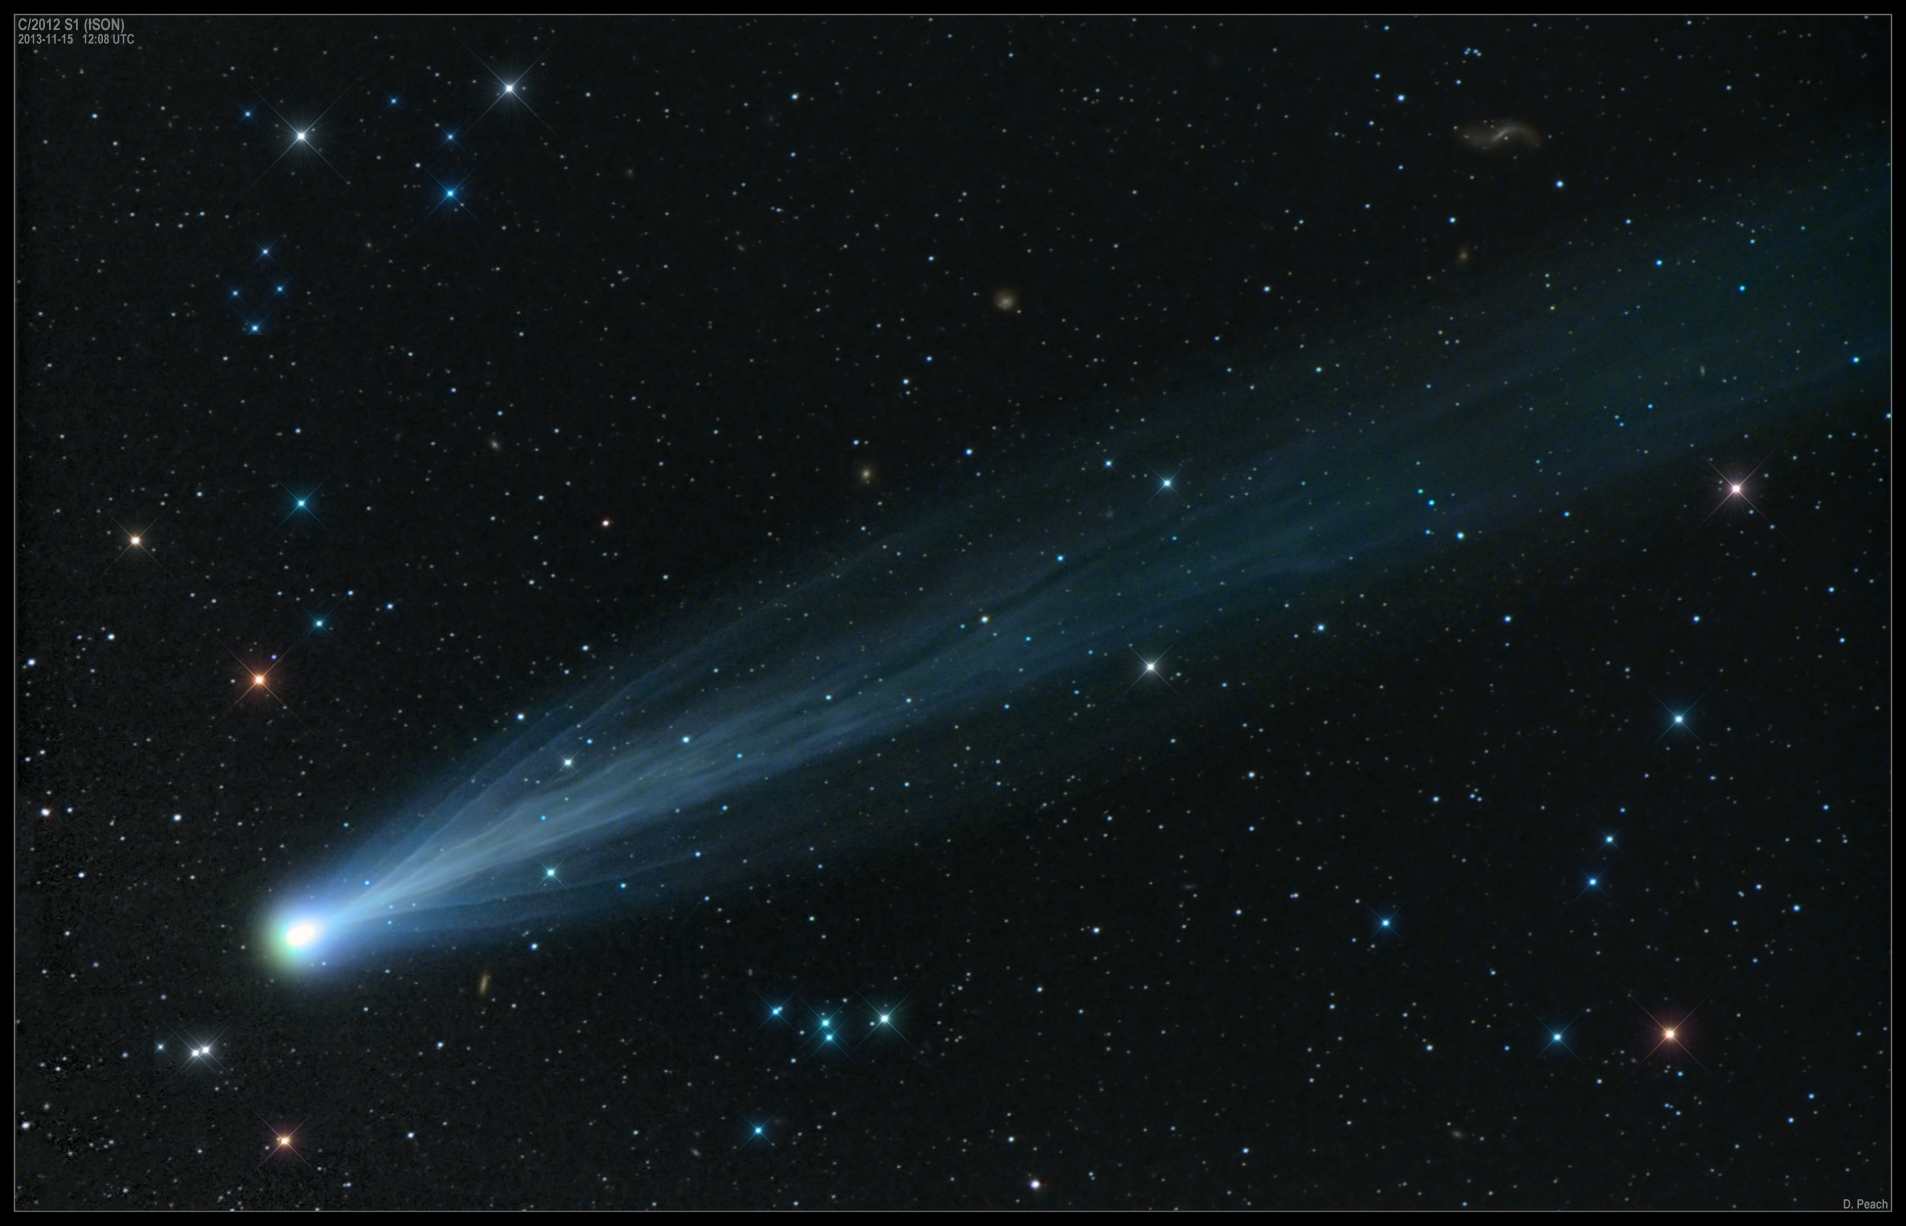
I take my hat off to some really good amateur astronomy photographers. Here are a couple that just acme to my attention, and are now in the public domain (Nov 17):
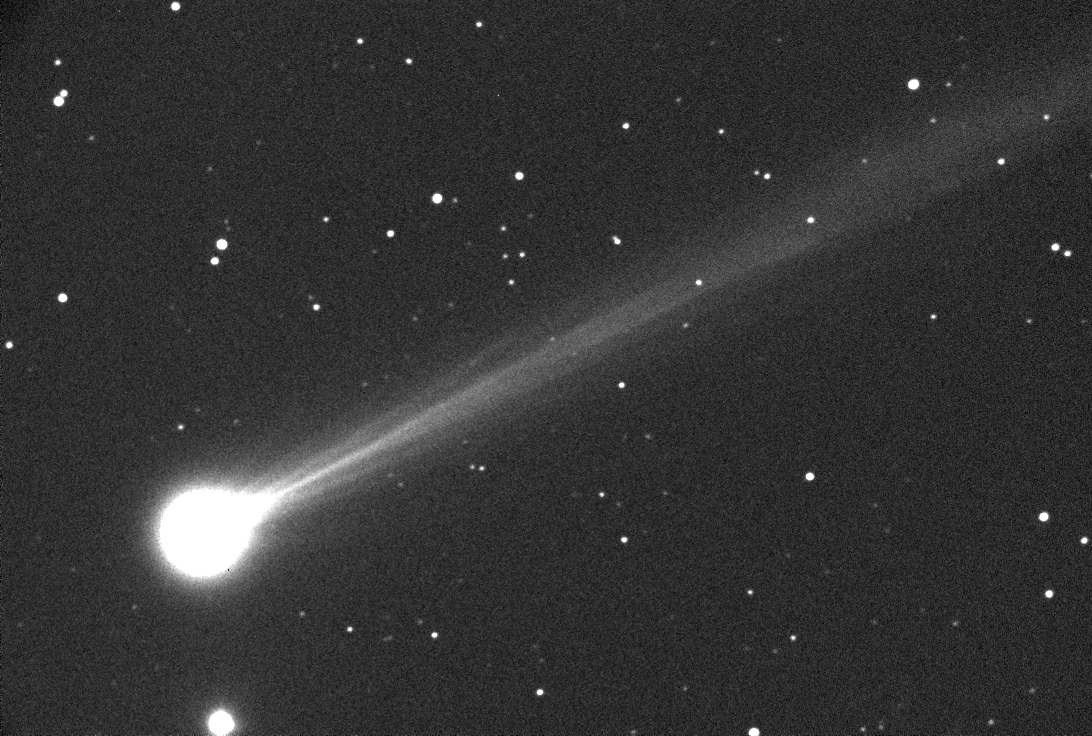
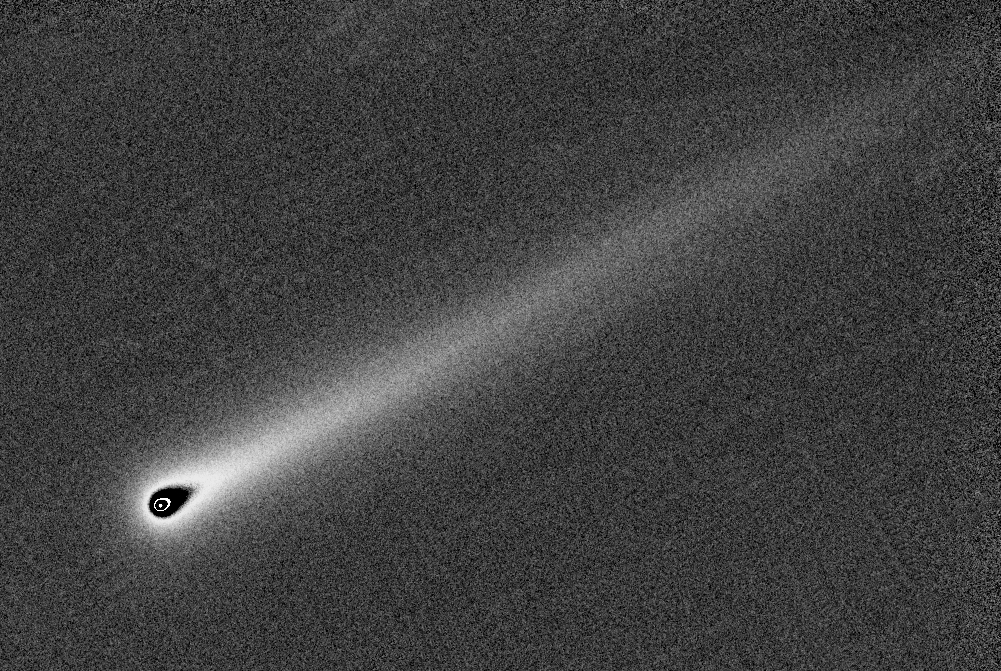
I think Damien Peach took this image recently. I'll try to get more info about it & put it here. Damien Peach is located on the south coast of the UK, at Selsy, West Sussex. He's also an expert of planetary imaging.
Comet ISON image taken Nov 16 by Waldemar Skorupa, located in Kahler, Germany.
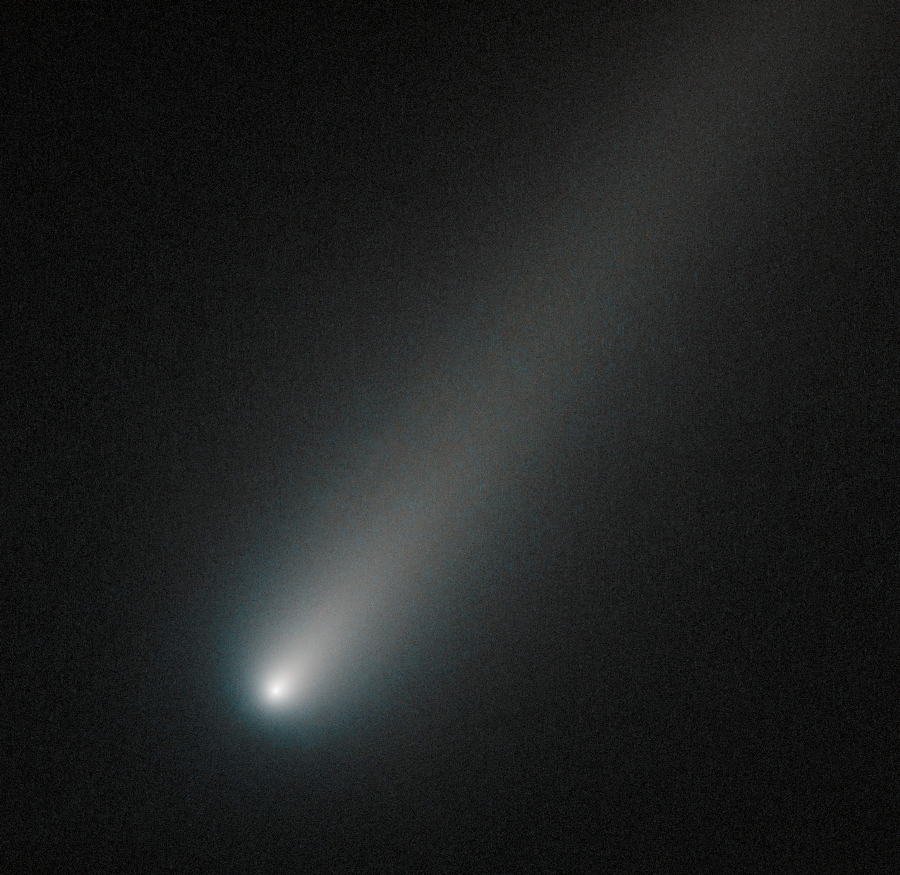
Hubble Space Telescope Image (Oct 9)
Hubble Space Telescope image taken Oct 09 and released Oct 17. The image was constructed from two B-band images (~ 8 min exposures, each) and two I-band images (~ 6-min exposures, each). The image pairs were joined to provide a larger field of view. An image public release (by STScI) states that the tail appears redder than the coma. A 56-minute web video chat involving several astronomers was held on Oct 17, hosted at STScI, to discuss the image (video at link). I don't recommend watching it, partly because most of the participants were unprofessional (childishly giddy and dismissive of lay people), but also because the information rate was quite low. The coma/tail color difference was explained as possibly due to more gas in the coma and/or more scattering by dust in the tail (that would require dust grain sizes smaller than visible wavelengths; i.e., Rayleigh scattering regime). The lack of a jet was a major topic, with a cautious suggestion that the use of a typical coma model for subtracting from the HST image might not be appropriate. Someone hinted that using a coma brightness distribution model that's based on many comets (that eject dust in all directions, i.e., isotropically) may not be suitable for a comet that (like ISON) ejects dust preferentially in the forward direction (they didn't say so in those words, but surely that's what was on their giddy minds). I don't think that's a problem that could account for a forward-facing jet, since another matter is probably more important (relating to placement of a LS filter). The participants had two main messages: 1) the nucleus is still intact (no surprise), and 2) there's no jet. I'm OK with both conclusions.
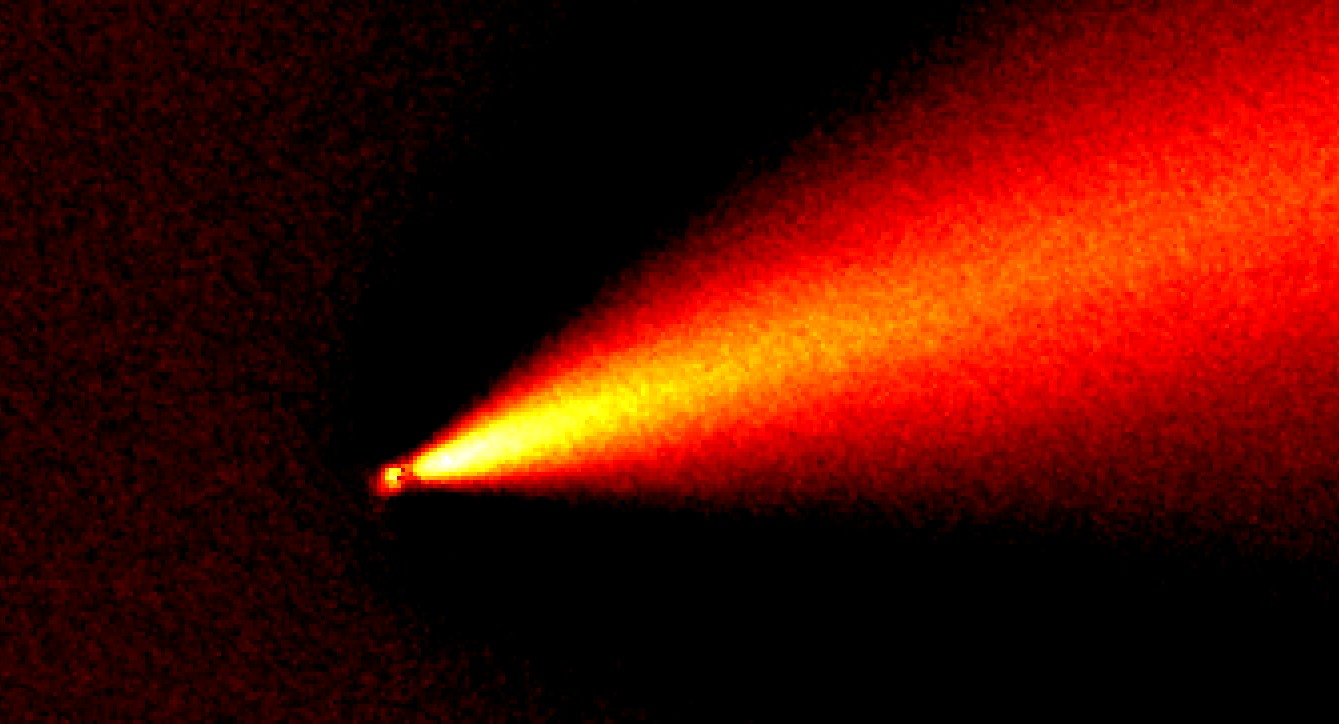
My false-color contrast enhancement of a TIFF image that STScI released Oct 17; I'm sure NASA and STScI hate to release TIFF and FITS images because they can be manipulated like this, but they released it and I enhanced it. I see no evidence for a jet in this image, and that's the position of Dr. Jianyang Li, who found a jet in his April image. This causes me to question Toni Scarmato's image processing procedure, that finds a jet in all images studied (including those of Oct 5, 11, 12 - which bracket Oct 9).
Could the jet have been pointed toward or away from Earth during the Oct 9 HST observations? If so it wouldn't show up in the above image. But if the jet isn't pointed toward the sun then there must have been a change in the comet's rotation pole orientation since May, which assumes that the April and May jets in HST images were correctly interpreted as being persistently pointed toward the sun, which was the original basis for stating that one pole was aimed sunward. Speculating that the rotational pole orientation has changed also assumes that if a pole is pointed to the sun that's where a jet would be located. Maybe the jet has altered the rotational axis orientation during the past 5 months. Maybe the rotation state has changed from a simple one-axis, sun-pointing orientation to a two-axis tumbling ("tumbling" is a technical term common among asteroid people; it means that an object has more than one axis of rotation: imaging a rolling cigar that is also rotating about an axis perpendicular to the cigar's length.) If our comet is tumbling, for example, then all surfaces are being illuminated by the sun and the activity level of the comet should have increased during the transition to a tumbling state. This is opposite of what has been observed. Bottom line: we don't understand Comet ISON's jet or rotational status.
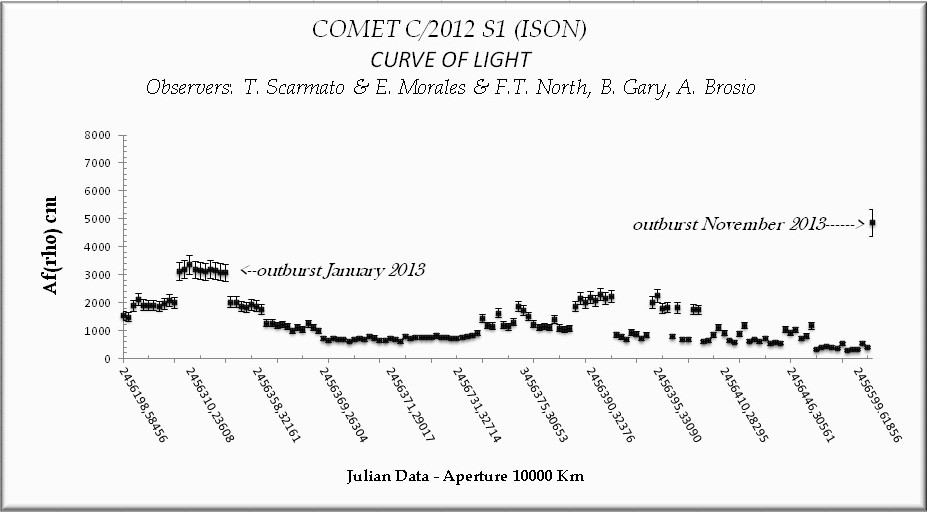
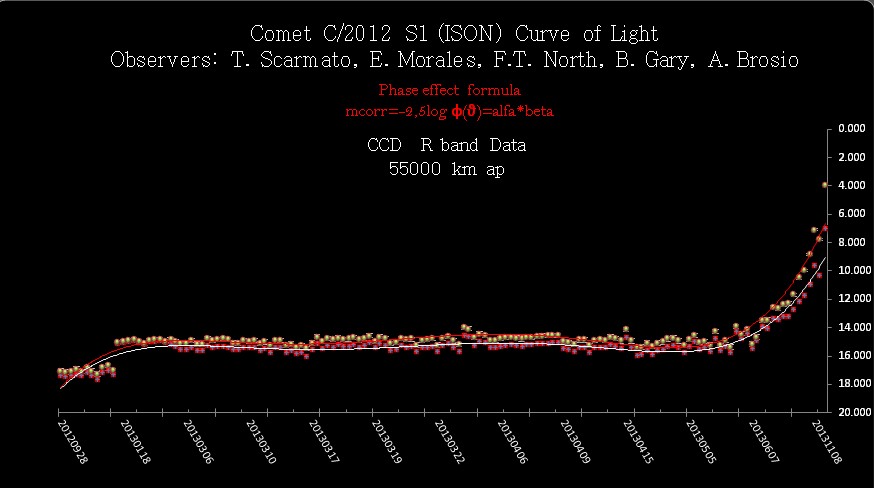
Toni Scarmato's Analyses: Coma Structure, Jets, Af(rho) & Rc-mag vs. Date
Toni Scarmato has used AstroArt to enhance spatial structure in Comet ISON images. He finds a jet pointed toward the sun, similar to what was seen in HST images taken in April and May, 2013. This is an important thing to verify, for it might allow for the determination of the nucleus rotation period, and possibly it's orientation. Knowing if one pole is pointed to the sun is an important goal, for it could explain the fading brightness of the inner coma since conjunction (after adjustment for changes in Earth/comet distance). Here are some enhanced images that Toni has produced (I don't know how real this structure is, but you have to say that it's provocative):
Toni Scarmato spatial enhancement of Gary's B, V and r'-band images, showing possible "breakup" of the nucleus.
Toni's enhancement (using Astroart's LS filter) of Nov 02 image by Kaye with 32-inch Tenagra telescope; median combine of 44 images with 3.8 "arc FWHM seeing.
Scarmato's spatial structure enhancement (using false color) of Whitmer's Oct 15 stack of the 50 comet-guided images (90-sec exposure, 14-inch telescope, R filter).
Scarmato's spatial structure enhancement (using false color) of Gary's Oct 08 stack of the 41 sharpest out of 95 images (30-sec exposure, 11-inch telescope, Cb filter).
Spatial structure enhancement is tricky, and I am trying to verify the presence of the many jet structures found by Scarmato in the Whitmer, Gary and other images. The most serious concern is with the placement of the LS (Larson-Sekanina) "rotational gradient filter" that has to be manually centered on the nucleus); it can produce jet-like artifacts separated from the nucleus and oriented at almost any direction. The entire jet matter is undergoing review and I cannot take a final position on the validity of the jet images that are (or have been) posted on this web site. Until more work is done on this I want to caution readers that the jets shown above, and in previous editions of this web page, may not be real. (Thanks, Tom Kaye, for performing some spatial structure enhancements that illustrate the dangers of LS placement.)
Toni Scarmato's plot of Af(rho) measurements (x-axis is measurement number, not proportional to date). [Version 2013 Nov 15]
Toni Scarmato's plot of R-band, corrected to a view from a standard distance of 1 a.u., with a "phase effect" correction, plotted vs. observation number (not linear with time). [Version 2013 Nov 15]
Toni's phase effect correction is intended to show what the comet's brightness would be if viewed from a distance of 1.0 a.u., and the same angle (which corrects for the fact that small dust particles scatter light preferentially back to the light source, called "backscatter"). Notice the long quiescence after an initial dramatic brightening (that led to unwarranted speculation that this could be the "comet of the century").
What's the Meaning of Comet ISON to a Non-Scientists?
Someone asked me to include a section for the layman on the meaning of Comet ISON, and my observations of it.
Like everything in life, this comet has no more meaning than a person is willing to invent! Well, that's my opinion, which you're free to disregard. Even if this comet were to become bright, and visible to the "naked eye" in late November and December, it would have no more meaning to the non-scientist than a viewing of Halley's Comet - or a beautiful sunset, etc.
To a comet scientist, however, this comet's behavior has more meaning (beyond competing with exoplanet astronomers, and cosmologists, for NASA and NSF funding). Comet ISON has come from the Oort cloud, which is a spherical shell of leftover material from the solar system's formation located beyond the solar system of planets, beyond the Kuiper Belt, beyond the sun's heliosphere (recently measured by Voyager 1 to be located at ~125 astronomical units, in one direction) and actually within interstellar space. There's an abiding fascination with the solar system's formation among astronomers, and since this comet consists of material that must be very similar to the material that formed the sun and planets it may be possible to learn about the formation of Earth 3.6 billion years ago. For example, how much water was present throughout the solar nebula as the sun and planet's were forming. And what was the gas to dust ratio as a function of distance from the solar nebula's center? One challenge to answering these questions by studying Comet ISON is that until recently it has never been within the solar system, and instead has spent 3.6 billion years in interstellar space - where it was bombarded by cosmic "rays" (fast-moving protons), encounters with slow-moving hydrogen atoms and molecules, an interstellar magnetic field, the coldness of interstellar space, etc. I personally don't care about these questions, but some astronomers do. Anybody who wants to know more about this should ask one of those astronomers for why they're excited by this comet.
Primer on Comet ISON for the Lay Reader
I recently posted a statement of my intention to discontinue updates to this web page. In response I received many e-mails encouraging me to continue. I have decided to continue! In addition, I perceive the need to "translate" some of the scientific material into layman's language. I will eventually move this "comet tutorial" section to the bottom of the web page. Any professionals who may read this section are invited to correct me on anything, or suggest new material. After all, I didn't know "diddly" about comets until two months ago, when I obtained a recovery image on Aug 12.
Comet ISON has had the disadvantage of rotating with one pole facing the sun ever since it entered the solar system last year. This means that only a small portion of the nucleus surface area has been heated by sunlight. This may account for it's slow brightening since the July solar conjunction (when it appeared behind the sun, and was therefore unobservable for a couple months). Last Fall and Winter it brightened at a normal comet rate due to sublimation of CO band CO2 (dry ice). Sublimation is the evaporation from a solid to a vapor (skipping the liquid state). Every time a flake of dry ice near the surface sublimated it kicked some overlying dust out, which became the main contributor to the coma's reflected sunlight. Since there must be water ice throughout the comet body some of the ejected material would be ice crystals (snow flakes).
The depth where this could take place is determined by a "thermal wave." Sunlight that is absorbed at the surface heats material on the surface, which in turn heats material in the next layer down, and so forth. The uppermost layer facing the sun is always the warmest, and temperature just decreases as you go deeper. At the present time the hottest place on the comet should be ~ 155 F (68 C), and this would be at the rotational pole facing the sun. Go down a couple feet and the temperature would be much cooler (sorry, I haven't calculated that), probably too cool for sublimating CO2. So all the dust (and snow flakes) being ejected from the comet nucleus comes from close to the surface.
Why did Comet ISON's rate of brightening slow down sometime in June or July? Maybe because the volume of material that was heated enough to sublimate dry ice had become limited by the fact that only one polar region was being illuminated by sunlight. Imagine the "thermal wave" progressing slowly into just a polar region; at first it would convert large expanses of the surface to being warm enough to sublimate dry ice, but the only way for a comet that rotates with one pole facing the sun to convert more dry ice to vapor is for the thermal wave to penetrate deeper. The sides and backside of the comet nucleus remain un-illuminated and too cold to participate in the dry ice sublimation process.
Water ice is also present throughout the primitive comet body. Water ice changes from solid to liquid in the Earth's atmosphere at 32 F. But in a vacuum (like space) when ice is warmed it changes from a solid to a vapor (skipping the liquid state). When cold comet material is warmed the first thing to sublimate is CO2; at a warmer temperature water ice sublimates. During that middle temperature time the coma consists of dust grains and snow flakes that were ejected by the sublimation of CO2. When sunlight is sufficient to heat the snowflakes they will sublime into water vapor. Since snowflakes are bright (they reflect and scatter almost all light), and since water vapor is transparent to light (it doesn't scatter or reflect sunlight), the coma will fade at some time during its journey toward the sun. Sublimation of snow flakes in the coma probably started on Comet ISON in early October. This might account for the 0.5 mag fade on ~ Oct 5 for the inner coma.
I'm defining the "inner coma" as having a diameter of ~ 60,000 km (mostly because that's a size that's easy to measure on our images). Comet ISON's inner coma used to consist of dust and snow flakes, but now what we see is scattered light from just dust; gases (such as CO, CO2 and water vapor) are there, but they're not contributing to the coma's brightness. For most comets, which rotate in a manner that causes all of the surface to receive sunlight, all of the surface is active in sublimating dry ice (and later water ice). Therefore they eject material into the coma in all directions. But if a comet has a simple rotation with one pole facing the sun (and if it doesn't tumble, causing the rotational pole to itself rotate), only one small region of the surface will be active, and there will be a jet of ejected dust that initially moves in the forward direction, toward the sun. But the solar wind (protons, electrons and some atoms) will eventually bump into the dust and force it to move with the solar wind, forming a tail. The pressure of sunlight reflecting off a dust gran surface will do the same. For a typical comet, rotating in some random manner, the coma will consist of dust that is ejected in all directions, and the inner coma will have a spherical shape. Only the outer coma becomes distorted by the solar wind, producing an oval shape. Comet ISON's innermost coma should be offset toward the sun from the nucleus (assuming that the pole-facing finding is correct), and the outer coma should be an oval offset in the backward direction. Future observations may show this.
It takes time for dust to move from the inner coma to the outer coma and tail. Therefore, the "total brightness" (coma plus tail) is a record of current plus past activity of the comet nucleus. Brightness of the inner coma, in contrast, is a record of recent activity. The best way to view activity levels on both timescales is to separately plot brightness of the comet's "inner coma" and "inner coma plus tail" in a way that does not depend on how close we on Earth are to the comet. These magnitudes are called "reduced magnitude." (By the way, magnitude is defined so that a 1.0 magnitude decrease corresponds to a 2.5-times increase in brightness. A 2.0 magnitude decrease corresponds to a 2.5 x 2.5 = 6.3-times increase in brightness. The general equation is: BrightnessRatio = 2.512 ^ MagnitudeDifference.) Reduced Rc-band magnitude (which I refer to as rRc-mag) can be calculated this way: rRc-mag = Rc-mag - 5 x LOG (d), where d is the distance of the comet from Earth in astronomical units (a.u.). (An astronomical unit, 1.0 a.u., is the average distance of the Earth to the sun, 149,600,000 km.) Therefore, reduced magnitude shows how bright the comet would be if viewed from a constant distance of 1 a.u.. In my plot of reduced magnitudes versus date, repeated here, you can see that the comet as a whole (coma plus tail) continues to brighten, whereas the inner coma is usually stable but underwent a decrease ~ Oct 5.
The steady increase of "total comet brightness" (i.e., decrease of magnitude, because that's the way magnitudes are defined) just means that the nucleus is continuing to produce coma material that the solar wind pushes backward into the tail. The drop of inner coma brightness is probably due to a one-time sublimation of snow in the coma to water vapor (which doesn't reflect sunlight the way snow does). Aside from this one-time fade the inner coma exhibits a constant brightness versus date (when viewed from a standard distance of 1 a.u.), and this must mean that the activity level (production of dust at the surface of the nucleus) is constant. This is a coincidence, and it bothers me. Coincidences are rare, but that's what the data show.
If we extrapolate "total comet brightness" into the future, using a model that fits the data, we can foresee a peak in "reduced magnitude" brightness corresponding to Rc ~ 7.5, before the comet becomes too close to the sun for observation (~20 degrees away). In terms of brightness as viewed from Earth the peak brightness will correspond to Rc ~ 6.7 (refer to graph at top of this web page). These are Rc-band magnitudes, so for V-band we have to add ~ 0.4 magnitude. In other words, the peak brightness called for by my model fit to recent data is V-mag (visual magnitude) ~ 7.1, as viewed from Earth. This is a brightness level that can't be seen without the use of binoculars, at least. We're talking about late November, close to the American Thanksgiving holiday.
However, consider the fact that the comet's polar axis is fixed in space (as far as we know). As it approaches the sun there will be a change in the direction of sunlight, and this will illuminate the comet from directions it has never seen. In other words, more of the comet's surface will become warm enough to sublimate dry ice and water ice, causing an enlargement of the surface area that is ejecting dust. We may therefore look forward to a brightening above my model, which could make the comet visible to the naked eye. I have no idea how much brighter than 7th magnitude the comet could become.
Ignacio Ferrin has predicted that Comet ISON will ade dramatically in early November. This is based on the brightening versus date during the past year, where he sees a pattern that resemble 3 other comets that faded dramatically before reaching the part of their orbit closest to the sun. I am not convinced of this, but Ignacio has much more experience with comets than me so I'm reluctant to take a position on the matter.
The brightening due to sunlight reaching previously un-illuminated surfaces has been calculated by someone (?) to occur in early- to mid-November. Mid-October is therefore probably too early to expect any brightening above my model fit. Observations in early November should be interesting, and exciting for those of us who have been patiently monitoring this unusually sedate comet.
"Stay tuned"
Comment on "Why Couldn't NASA Recover Comet ISON?"
Some in the amateur astronomy community have barraged CIOC with that question: "Why couldn't NASA recover Comet ISON?" Karl Battams posted an answer at his blog. The following are my thoughts, and they're meant for other amateurs (the professionals would be laughing at the obviousness of what I'm about to write.)
First, how do we know NASA didn't recover Comet ISON before my August 12 imaging? Would they bother to notify the amateur community about their recovery image, and the fainter-than-modeled brightness? I'll bet that NASA has hundreds of images with plenty of multi-band magnitudes starting from early August. They probably have plots of albedo vs. wavelength from u' to z' already, as well as emission line spectrae in the 380 - 550 nm region, and polarization maps at several wavelengths across the coma and tail.
You need to understand two things about professionals vs. amateurs: 1) professionals have MUCH better hardware, and 2) professionals don't share right away! The first point is obvious, which was the basis for the question. Professionals may have learned to share in kindergarten, but by the time they get a PhD they've learned to keep their observations secret until publication. After all, why would they want to share with other professionals, who are competing with each other for grants from NASA and NSF. It would be self-defeating to give one's competitors useful information ahead of publishing. Remember, publish or perish! It's true. Another reason professional scientists in all fields don't share their findings right away with the general public is because the peer-reviewed publication process requires that the manuscript reporting the findings be reviewed by colleagues. This is a wonderful process for keeping bad science from being published, but it slows the movement of legitimate discoveries to the public domain.
Consider the notion that NASA didn't give a high priority to a recovery image, thinking that such an image would be "just a stunt" because it would be of such low quality that nothing useful could be learned from it. Karl Battams hinted at this by stating that a recovery image would have "somewhat limited science return." I sort of disagree. One thing of possible science value from my recovery image was a magnitude. And this almost immediately generated concern that ISON was not brightening the way an optimistic ("Comet of the Century") model required. Subsequent magnitude measurements have supported this early suspicion. It's theoretically possible that NASA didn't realize that magnitudes could be reliably measured at elevations as low as 8 degrees. And what about the comet's SED? This could have been measured before I did it (Sep 3). My SED suggests that there's a paucity of molecules in the coma since g'-band is no brighter than it should be if the coma consisted of only dust reflecting the sun's spectrum. The same conclusion can be made from the fact that the coma is no larger at g'-band than r'- or i'-band. In other words, NASA could have easily recovered Comet ISON, and made measurements with constraints on the molecular component of the coma, well before I did it. And as I stated above, NASA probably has done all these things but we won't know about them until they're published (or presented as a poster at the October DPS meeting in Denver).
Another suggestion to explain an assumed NASA not being first with a recovery image was that imaging the comet in early August was difficult. It is alleged that what I did was "a remarkable feat." Well, let's be honest here: imaging the comet as early as August 12 was really not difficult; the main problem I had was getting up at 4 AM and looking at the wrong coordinates because I made a mistake in querying the JPL Horizons web site by accepting their default of "apparent" instead of "astrometric" coordinates. Since that first imaging session I've observed it on 4 other occasions, and nothing could be easier. I am frankly puzzled why CIOC wasn't flooded with amateur images of this comet before mid-August. However, I'm not surprised that CIOC wasn't flooded with professional images, for the reasons given above.
I suspect that my observations were useless to the pro's because they've been doing much better work: only one pro has contacted me to clarify what I did. If I had an image that was scientifically useful a pro would simply assume that I didn't know what I was doing photometrically, and he would ask for a FITS image to perform his own analysis. This never happened, so I assume that the professionals think that none of my images have scientific value above what they already have.
So why would NASA invite amateurs to observe Comet ISON, as if these images would help NASA? I'd better leave this to your imagination.
P.S. During the 1960's I was a professional astronomer (in radio astronomy). At that time, and before, sharing among professionals was common; trust and good will existed. After moving on to the atmospheric sciences I kept track of my old field of astronomy, and I watched as competition replaced cooperation. There were a finite number of university teaching positions, so a greater proportion of PhD astronomers were competing for research grants. Too many PhDs were competing for limited funds starting in the 1970's. The forces that operate when supply exceeds demand were unmerciful to the person with an IQ of less than 145 who just wanted to do astronomy for the love of it; that person was simply born a few decades too late. Such people can't compete today, so they leave the field - even if they've acquired a PhD. Those who remain employed in astronomy are super-smart, and also super-competitive. No one holds your hand, these days, encouraging you as a student to join the ranks of professionals. If you don't already have a competitive nature, and a genius IQ, you won't make it as a professional astronomer. That's my story, and I'm sticking to it!
P.P.S. The above is NOT meant as a criticism of professional astronomers, or of NASA. It's just an explanation of the way things are within most scientific communities these days, whether they're at a government agency, a university or a private research institution. Non-scientists don't appreciate the need for discretion prior to publication. The professional scientist shouldn't publicize his work until it has been reviewed by colleagues, which is part of the peer-reviewed publication process. An amateur, like me (now), is less encumbered by this requirement. I have great respect for the scientists and engineers at the NASA centers, and some respect for management (the lowest levels are competent). I can't imagine any scientist at NASA withholding important information from the public, past a public relations review; the notion that any NASA scientist could be part of a conspiracy is ridiculous! The many web sites critical of NASA is a disappointment for me, and they just reinforce my belief that at least half of all people lack critical thinking skills and are uninformed, and maybe 5% are pathetically gullible for idiotic notions. I felt the need to write this as an introduction to an appeal for readers of this web page to NOT e-mail me with a compliment for criticizing NASA. I don't want e-mails from anyone believing that scientists are capable of conspiring to hide information from the public. Also, please don't e-mail me with your secret theory for whatever is central to your being. E-mails, however, with a legitimate question, comment or suggestion are welcome. (By the way, I was employed at Caltech's JPL, a NASA center, for 34 years as a scientist before retiring in 1998.)
Notice that I won't Discontinue Updating this Web Page
A couple days ago [Oct 15] I stated that "updates to this web page would soon be discontinued." I stated a belief that the professional astronomical community has no need for these amateur observations (because they have their own database that is much better, but not in the public domain), and the amateur astronomy community had no interest in quantitative analyses (because all they want are "pretty pictures"). Although I still believe that these two things are true, I neglected to take into account the far greater community of interested lay people, who simply want to follow the progress of Comet ISON. (There's another community of readers who are simply "critical thinking challenged" - to put it politely - who are concerned about "the end times" or something that doesn't make sense to me. They're welcome to read this web page, of course, but I'm not taking them into account in any of my decisions about continuing the page.) Because of this larger group of readers who simply want to follow Comet ISON, and who prefer my page to others for that purpose, I have decided to continue observing and processing and updating this web page. With these lay people in mind I have added a section "Commentary on Current State of Comet ISON for the Lay Reader."
Acknowledgements
First, I want to thank Doug Snyder for challenging members of my local astronomy club (Huachuca Astronomy Club) to be the first to recover Comet ISON. Doug is an esteemed member of the club because he recently was a co-discoverer of a comet; I took on the challenge because I like observing challenges, the more difficult the better. I won the challenge of becoming the first member of the club to recover Comet ISON after the July solar conjunction, and was surprised to learn that I was also the first amateur in the world to recover Comet ISON. Richard Miles (UK) explained that my recovery image showed the comet where it should be, and that I must have mis-interpreted the JPL Horizons ephemeris when I was looking for the comet elsewhere on Aug 12. I want to thank NASA's CIOC (Karl Battams and Padma Yanamandra-Fisher) for determining that I was the first to recover Comet ISON, and for including my my "recovery story" on a CIOC web page. Richard Miles also has graciously performed spatial structure enhancement to reveal a jet in 2 of the 3 images sent to him. Dennis Whitmer, my neighbor 3 miles away, has provided most of the images that I've processed and included on this web page. I admire his willingness to get up at 3 AM to start observing. We collaborate closely on observing strategy. I acknowledge Jakub Cerny (Czech Republic) for suggesting that I consider measuring "total magnitude." He pointed out that other observers were getting total magnitudes brightening while I was getting inner coma magnitudes fading. He explained that my decreasing inner coma brightness could be due to the comet's approaching the sun where at some point (the frost line) snow flakes in the coma would sublime, and become transparent water vapor. Jakub also suggested that I reduce image scale (by a factor 3, for example) before doing photometry, and that I use a large oval photometry aperture to include the entire comet (coma plus tail). I want to thank Ignacio Ferrin (Columbia) for suggesting I use APT (Astronomical Photometry Tool) for doing elliptical photometry on the entire comet. Ignacio also suggested I fit the measurements of "magnitude versus coma diameter included in photometry aperture" with an exponential equation to provide an objective estimate of "infinite aperture magnitude." Jakub Cerny described a tradition of monitoring nucleus activity by measuring the coma with an oval photometry aperture that is offset behind the brightest spot because ejected material moves back faster than the forward ejected material. Toni Scarmato (Italy) explained Af(rho) to me, and the need to use a photometry aperture that achieved the same diameter in kilometers at the comet for different observing dates. He has graciously enhanced spatial structure to reveal a jet in all of the stacked images that Whitmer and I have sent to him. Dr. Li (Univ. Md & PSI) explained how his April images with HST showed a jet facing the sun, and that one rotational pole must be close to sun-facing because of the jet's lack of angular movement. I also want to thank Ignacio Ferrin for sharing several of his publications, which impressed me with the merits of monitoring brightness using a "reduced magnitude" (corresponding to the comet's magnitude if viewed from 1.0 a.u. distance); this makes eminent sense to me. His log(r) also makes sense to me, but I haven't adopted the practice yet. Finally, I want to thank Arne Henden for initiating the APASS project when he became director of the AAVSO. I have come to rely upon APASS magnitudes on almost a daily basis. If APASS didn't exist the quality of all of my photometry would suffer for both my Comet ISON observing and all my asteroid observing.
References
Keihm, Stephen, Lucas Kamp, Samuel Gulkis, Mark Hofstadter, Seungwon Lee, Michael Janssen and Mathieu Choukroun, 2013, "Reconciling Main Belt Asteroid Spectral Flux Density Measurements with a Self-Consistent Thermophysical Model," Icarus, 226, 1086-1102.