Webmaster: Bruce Gary, Last updated: 2013.08.15, 00.0 UT
This website is where I show Comet C/2012 S1 (ISON) light curves by amateur observer Bruce Gary, using a Celestron 11-inch telescope at the Hereford Arizona Observatory (G95). My long-term goal is to determine a rotation period. CometHomePage
Update: Aug 13, added light curves
for the 20-minute period on Aug 12, showing effect of photometry
aperture size changes.
2013.08.12 Recovery Observations
Warning: I've never tried to do photometry for targets at ~ 10 air masses before, and this is my first observation of a comet, so there probably are systematic errors that I'm not aware of in the following analysis.
This section investigates the brightness of comet ISON versus photometry aperture size. It's an attempt to distinguish between the coma's brightness and that for the nucleus. The comet's PSF (point-spread function) was greater than nearby stars in all images (~ 10.6 px vs 6.0 px, FWHM). We therefore expect brightness to increase with aperture size. Indeed, it does!
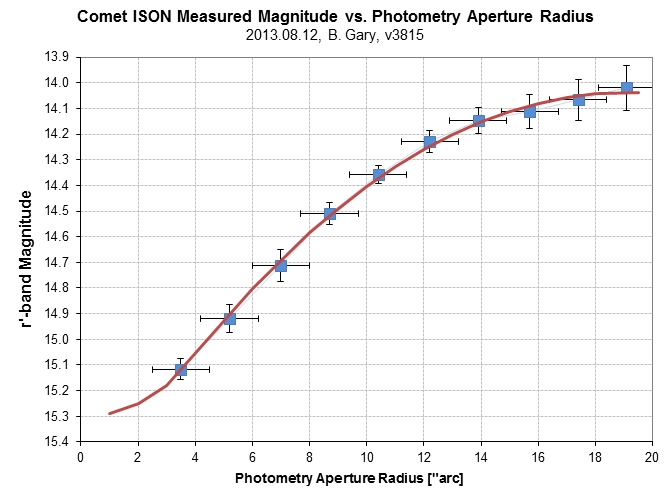
Apparent magnitude versus photometry aperture, using 7 nearby reference stars for calibration (using APASS r' mag's).
When the photometry aperture radius was changed, a corresponding change was made to the gap annulus; when one increased the other decreased. This assured that the same sky background annulus was used for all photometry measurements.
The coma appears to extend to at least ~ 16 "arc from the coma center (i.e., nucleus). Most of the coma's flux is captured for photometry radii of ~ 18 "arc, where a "total" flux corresponds to r'-mag = 14.03 ± 0.08 (estimated SE).
Here are the light curves for each photometry size. The relevant info box is the one in the UR corner, giving magnitude for the photometry aperture circle.
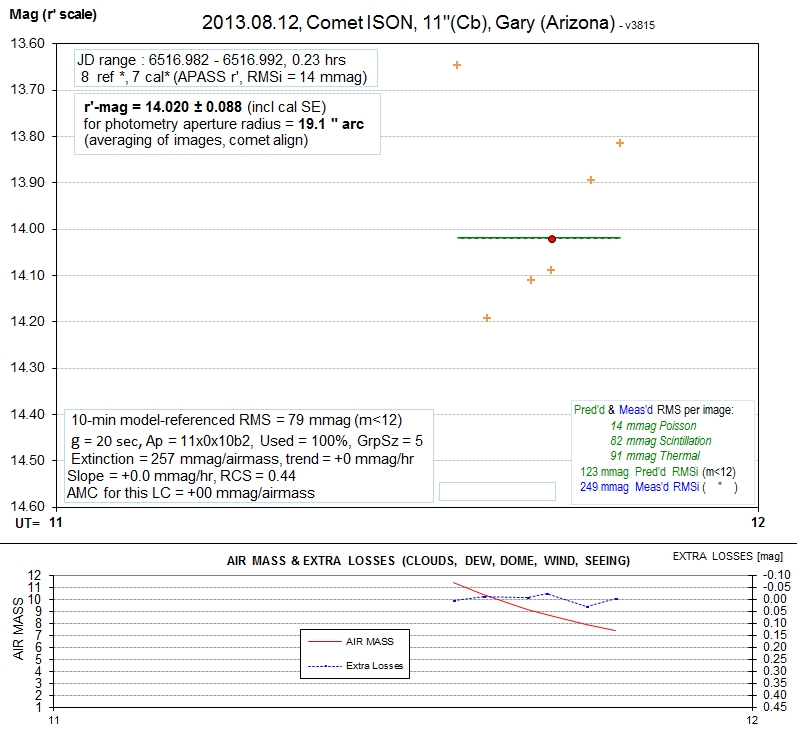
r'-mag versus UT for 6 images (each image an average of 4 or 5 individual images). The first group average (5.0 degree elevation)
was noisy so it wasn't included in determining an average for the following 5 groups; it is displayed merely to indicate the level of
systematics that can be introduced by very low elevation angle observations.
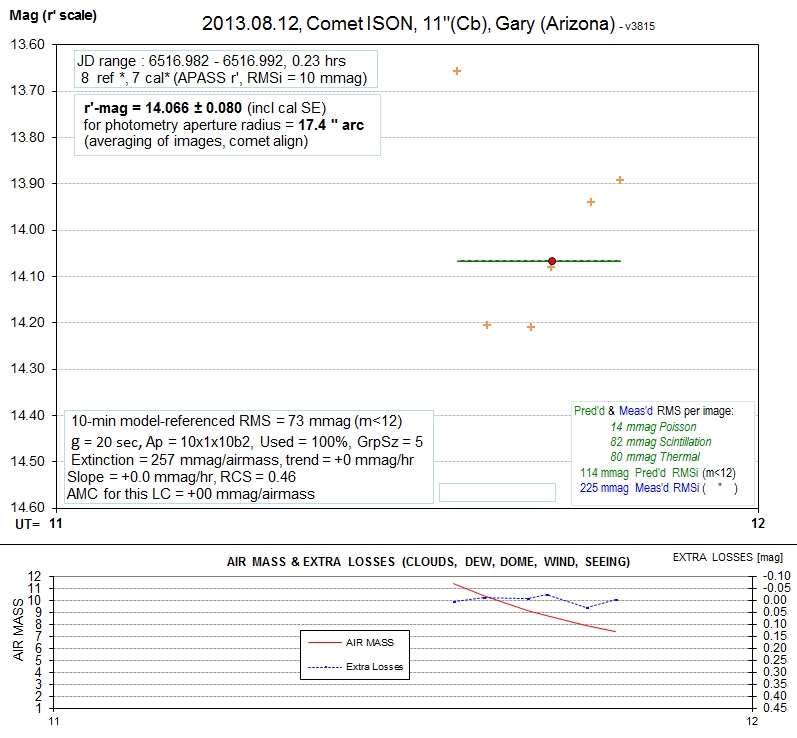
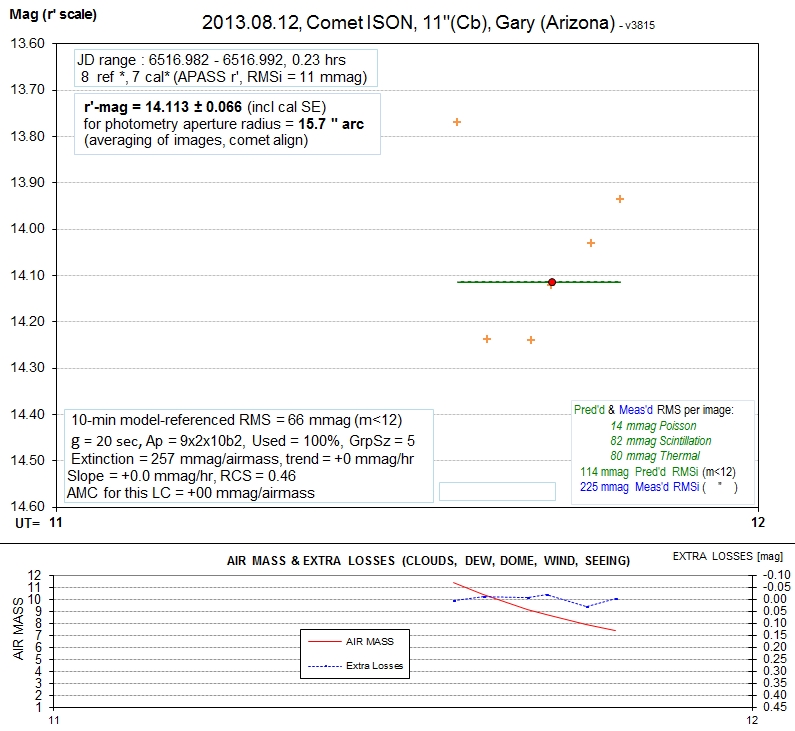
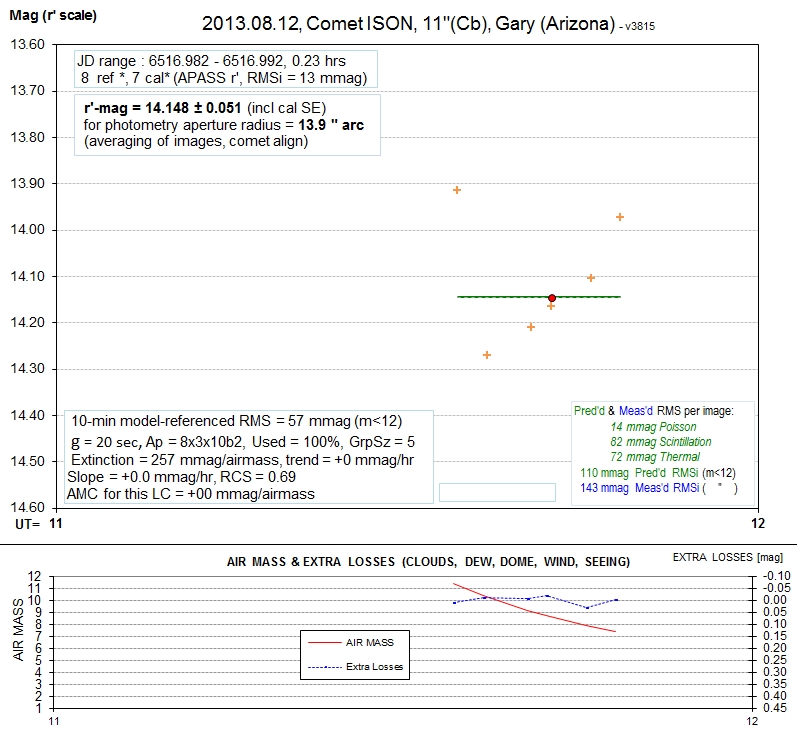
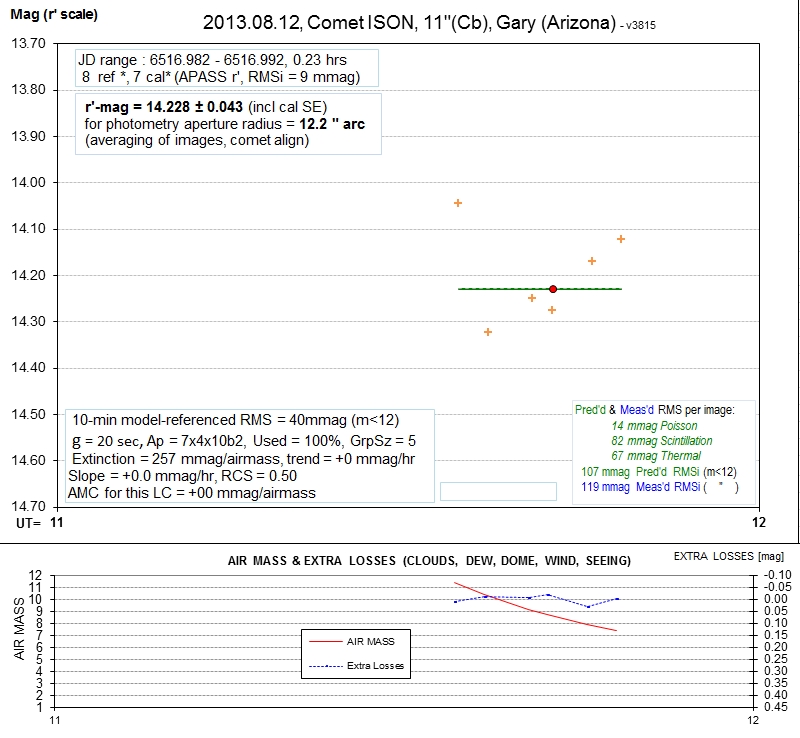
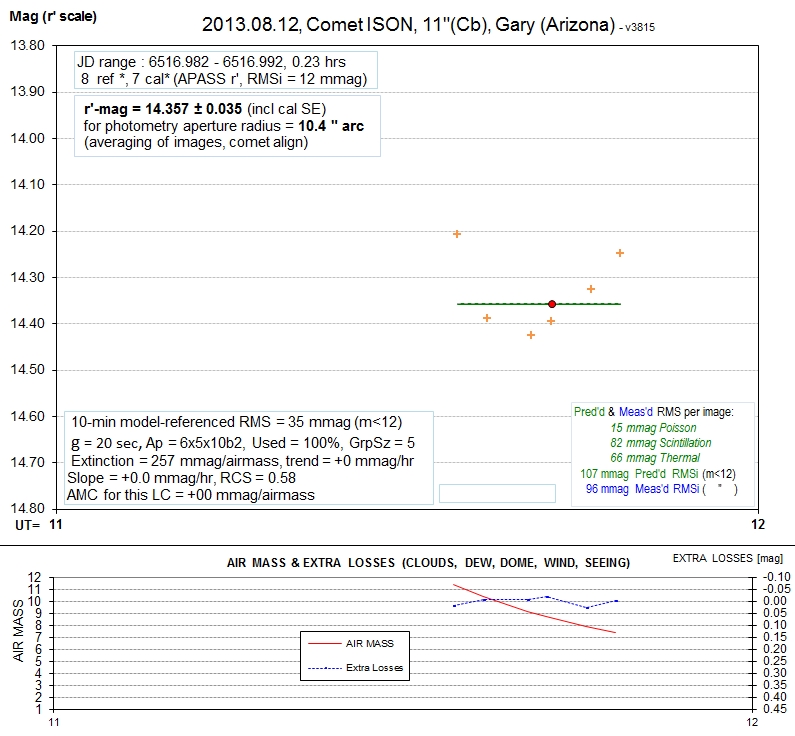

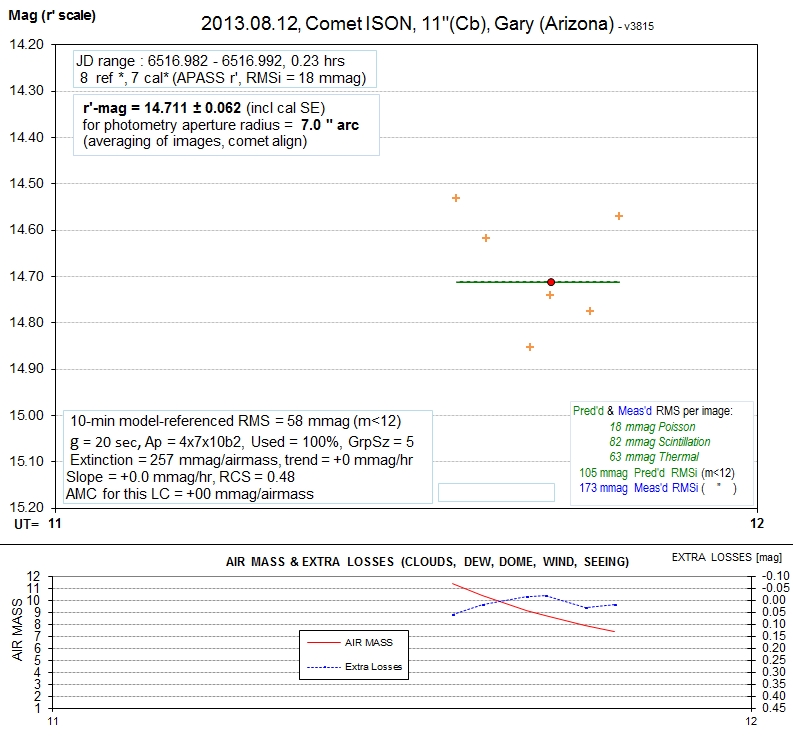
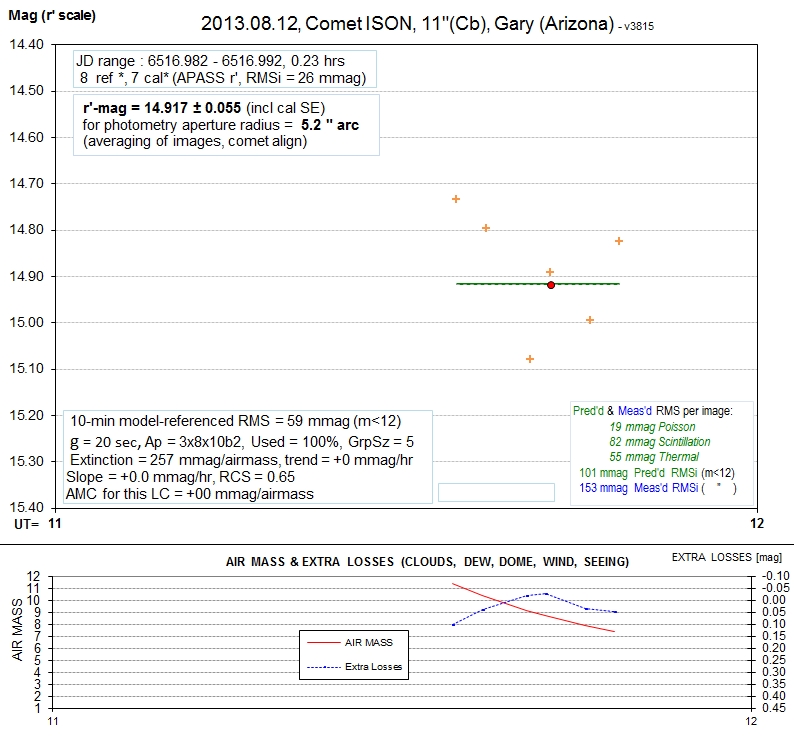
There's a trend for the highest air mass magnitudes (the first ones) to be fainter. Someone has suggested that this might be caused by blockage of my telescope aperture by the dome opening (bottom edge) and the scattering of light that this might produce. I'm currently working to determine if this is likely and will update this section later today.
I am making the fits images used to create the above LCs available to anyone who can convince me that they are competent and serious about using them for scientific purposes. Just e-mail me and ask, at:

Return to calling web page
____________________________________________________________________
2013.08.12 Recovery Observations
Warning: I've never tried to do photometry for targets at ~ 10 air masses before, and this is my first observation of a comet, so there probably are systematic errors that I'm not aware of in the following analysis.
This section investigates the brightness of comet ISON versus photometry aperture size. It's an attempt to distinguish between the coma's brightness and that for the nucleus. The comet's PSF (point-spread function) was greater than nearby stars in all images (~ 10.6 px vs 6.0 px, FWHM). We therefore expect brightness to increase with aperture size. Indeed, it does!
Apparent magnitude versus photometry aperture, using 7 nearby reference stars for calibration (using APASS r' mag's).
When the photometry aperture radius was changed, a corresponding change was made to the gap annulus; when one increased the other decreased. This assured that the same sky background annulus was used for all photometry measurements.
The coma appears to extend to at least ~ 16 "arc from the coma center (i.e., nucleus). Most of the coma's flux is captured for photometry radii of ~ 18 "arc, where a "total" flux corresponds to r'-mag = 14.03 ± 0.08 (estimated SE).
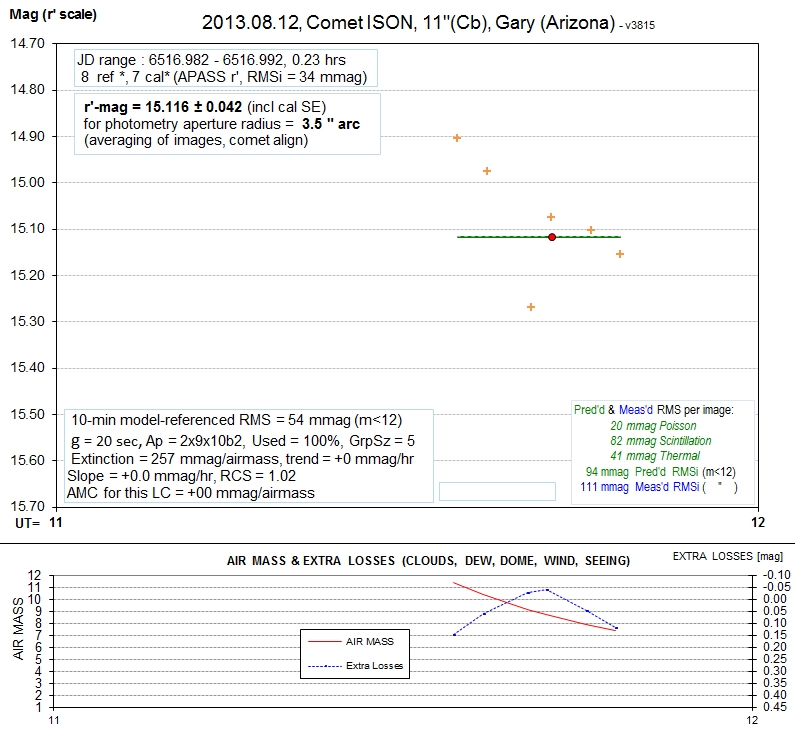
Here are the light curves for each photometry size. The relevant info box is the one in the UR corner, giving magnitude for the photometry aperture circle.
r'-mag versus UT for 6 images (each image an average of 4 or 5 individual images). The first group average (5.0 degree elevation)
was noisy so it wasn't included in determining an average for the following 5 groups; it is displayed merely to indicate the level of
systematics that can be introduced by very low elevation angle observations.
There's a trend for the highest air mass magnitudes (the first ones) to be fainter. Someone has suggested that this might be caused by blockage of my telescope aperture by the dome opening (bottom edge) and the scattering of light that this might produce. I'm currently working to determine if this is likely and will update this section later today.
I am making the fits images used to create the above LCs available to anyone who can convince me that they are competent and serious about using them for scientific purposes. Just e-mail me and ask, at:
Return to calling web page
____________________________________________________________________