Webmaster: Bruce Gary
This website is a "continuation" of a main web site (Comet ISON Observations by Three Non-Professional Observers) that became too long and had to be trimmed to include only observations from November. Go to main Comet ISON web page.
Observations
by Date (for August, September & October, 2013)
2013.10.31 Gary, B, V, Rc, g', r', i'
Gary observed with Cb filter from 10:58 to 11:45 UT (EL = 17 to 27 deg), g'r'i' filters from 11:48 to 12:09 UT (EL = 27 to 32 deg), and with BVRc filters from 12:10 to 12:42 UT (EL = 32 to 39 deg).
B-band
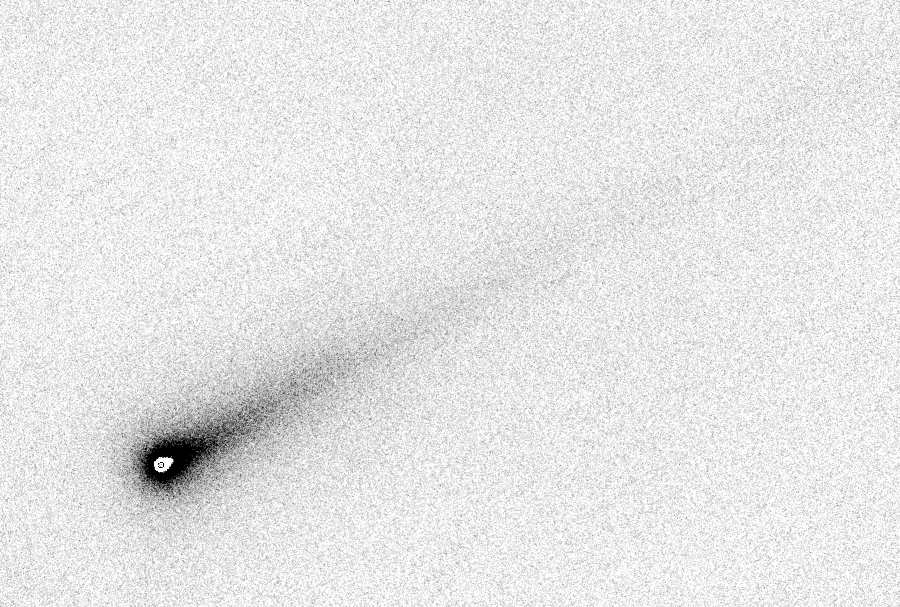
Complicated re-mapping of brightness to displayed brightness for Gary B-band image (26 median combine).
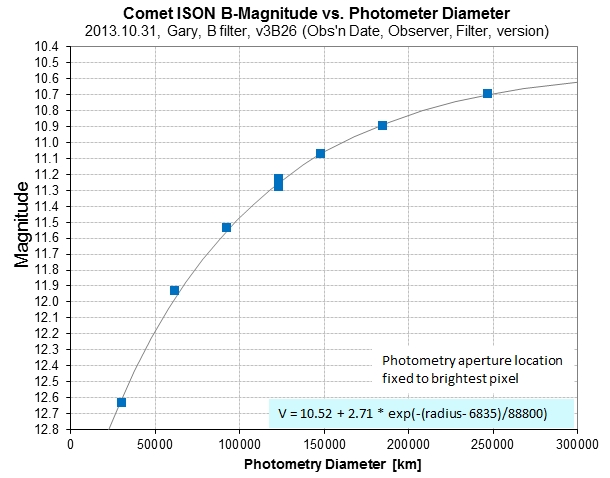
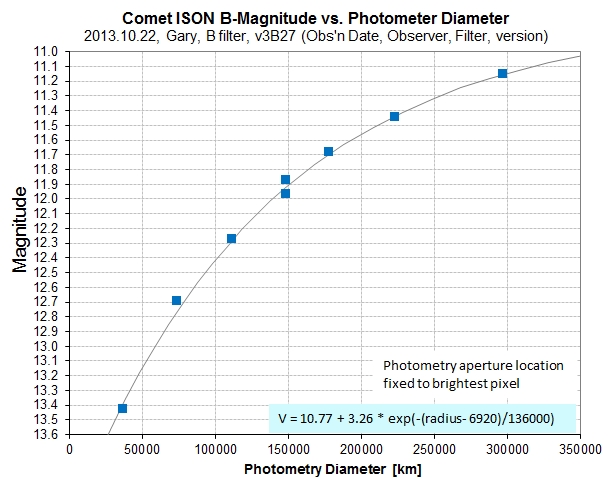
Gary B-mag (using B-band filter) vs. coma diameter included in photometry aperture.
For a coma diameter of 50,000 km V-mag = 12.19. For 200,000 km diameter B-mag = 10.83.
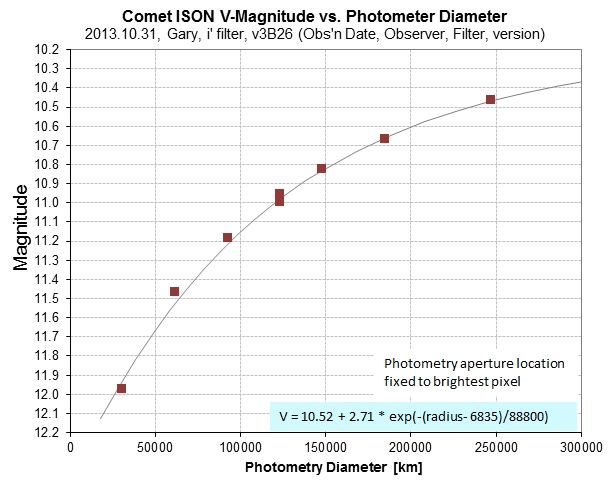
V-band
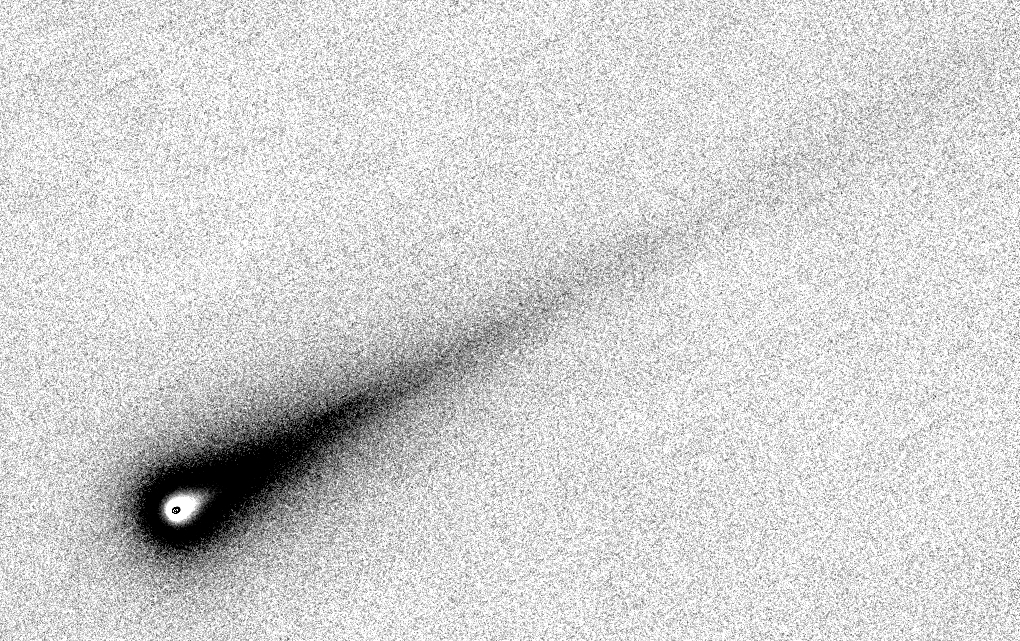
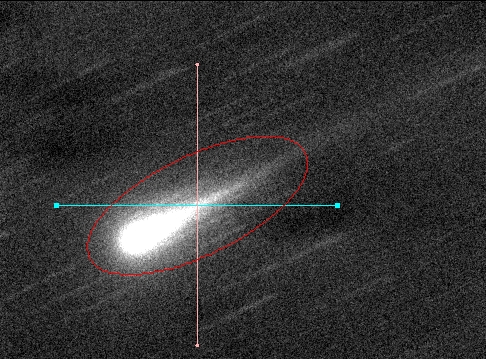
Complicated re-mapping of brightness to displayed brightness for Gary V-band image (21 median combine).
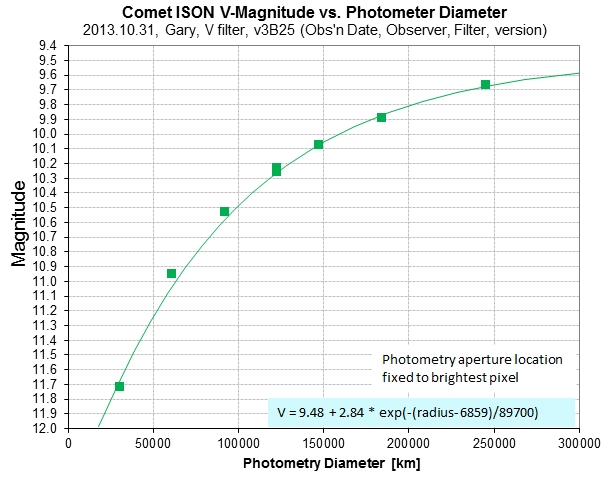
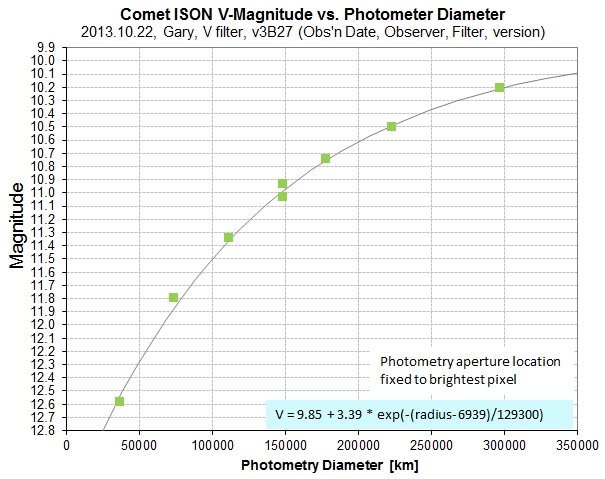
Gary V-mag (using V-band filter) vs. coma diameter included in photometry aperture.
For a coma diameter of 50,000 km V-mag = 11.23. For 200,000 km V-mag = 9.81.
Rc-band
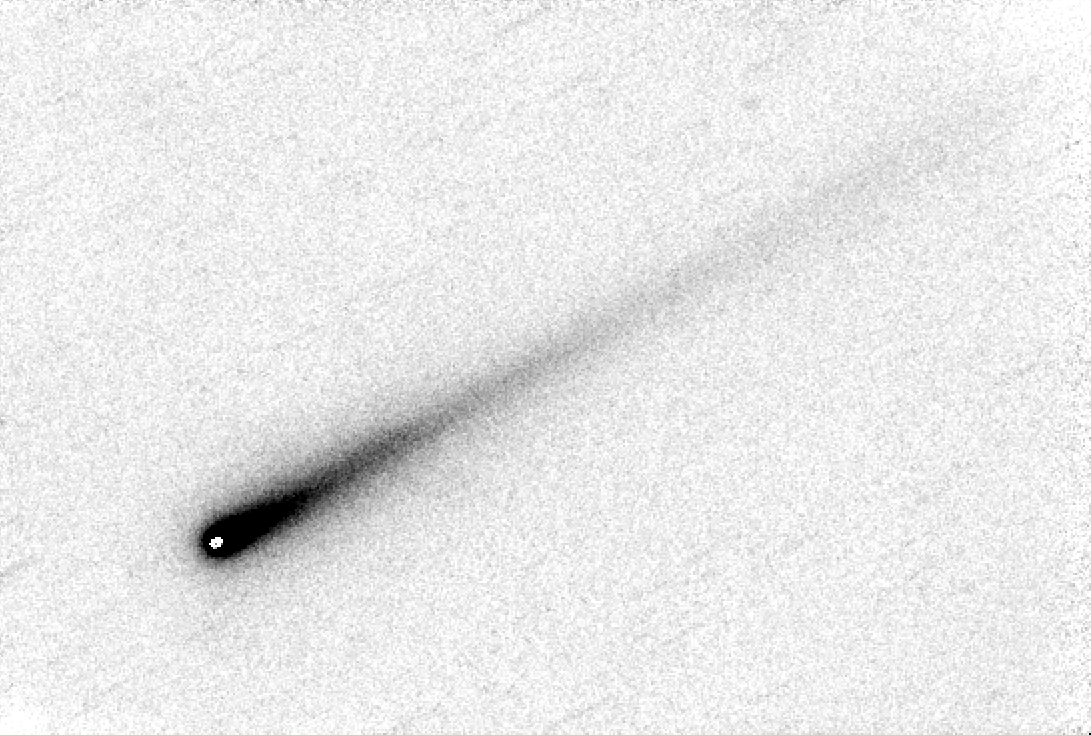
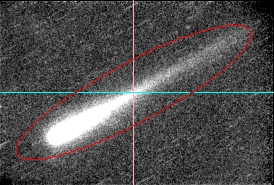
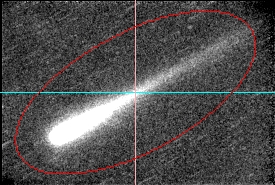
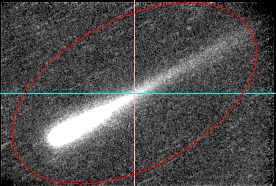
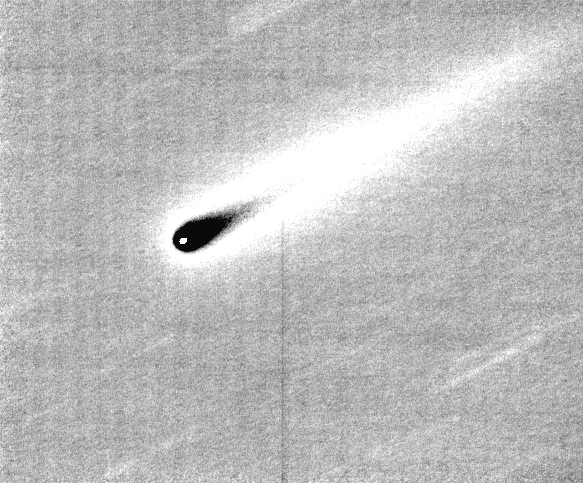
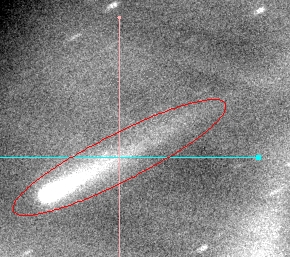
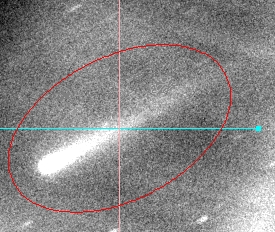
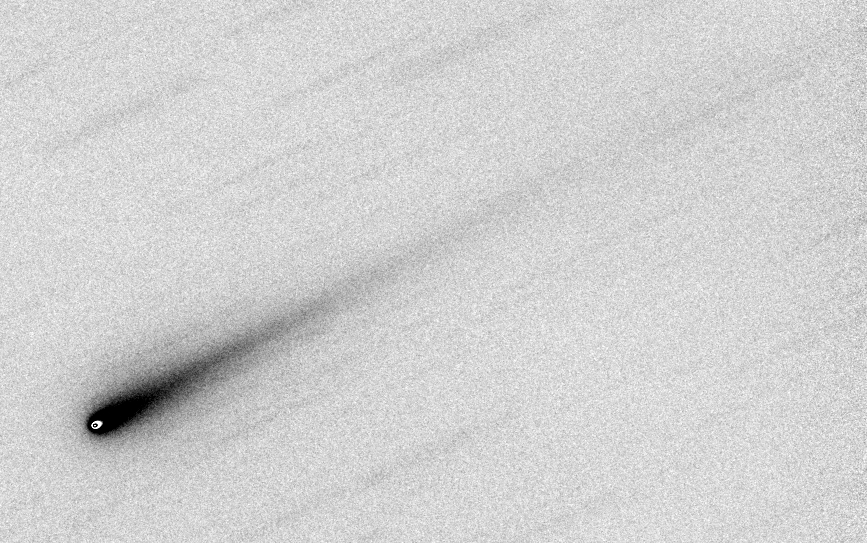
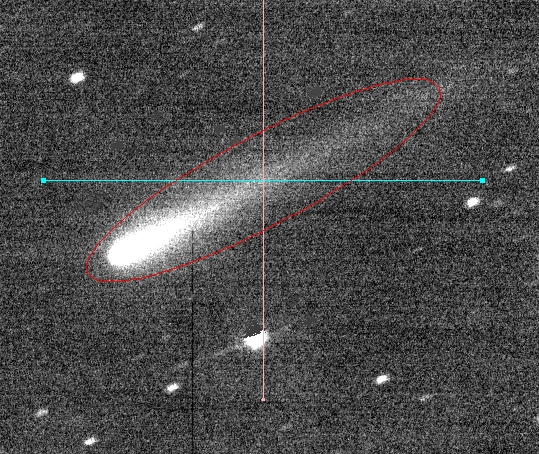
Complicated conversion of measured brightness to displayed brightness for Gary Rc-band stacked image (21 median-combine). FOV = 31 x 21 'arc, north up, east left.
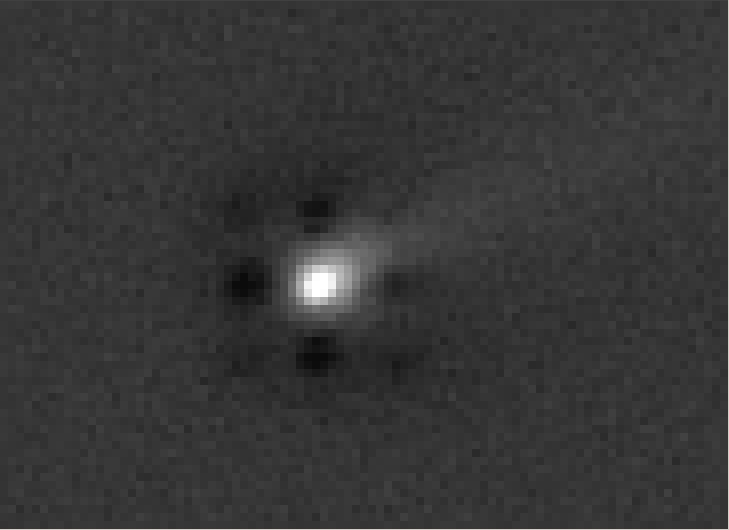
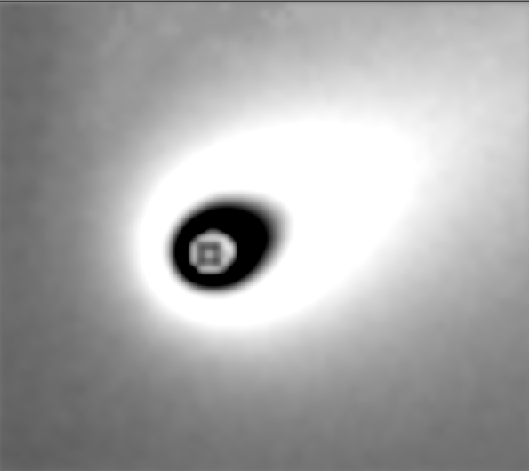
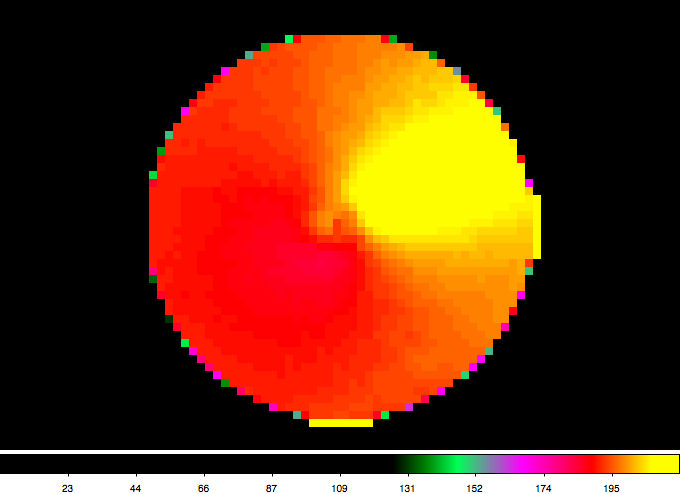
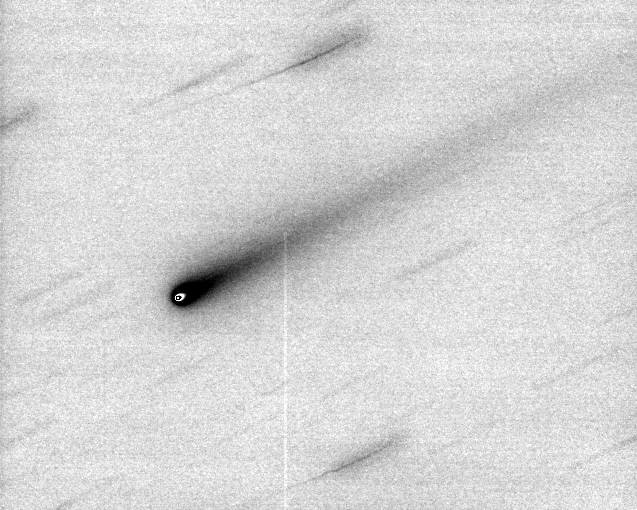
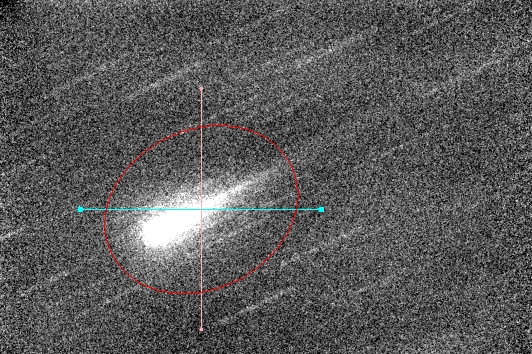
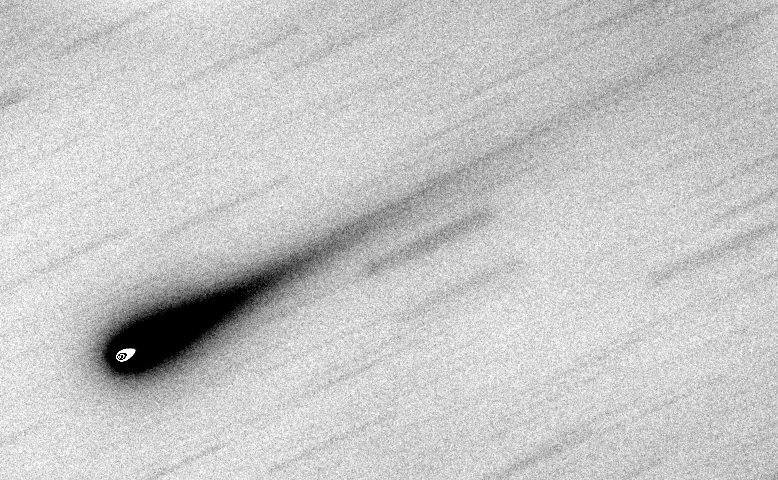
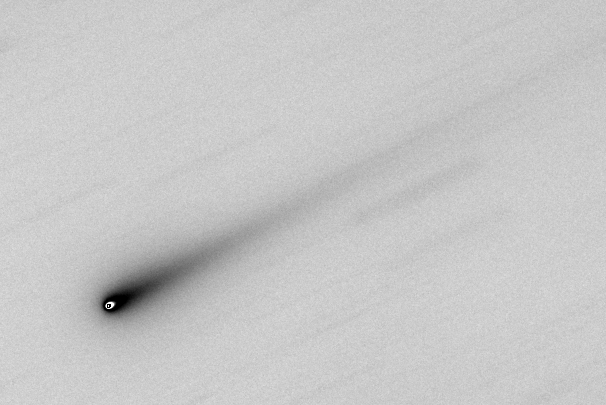
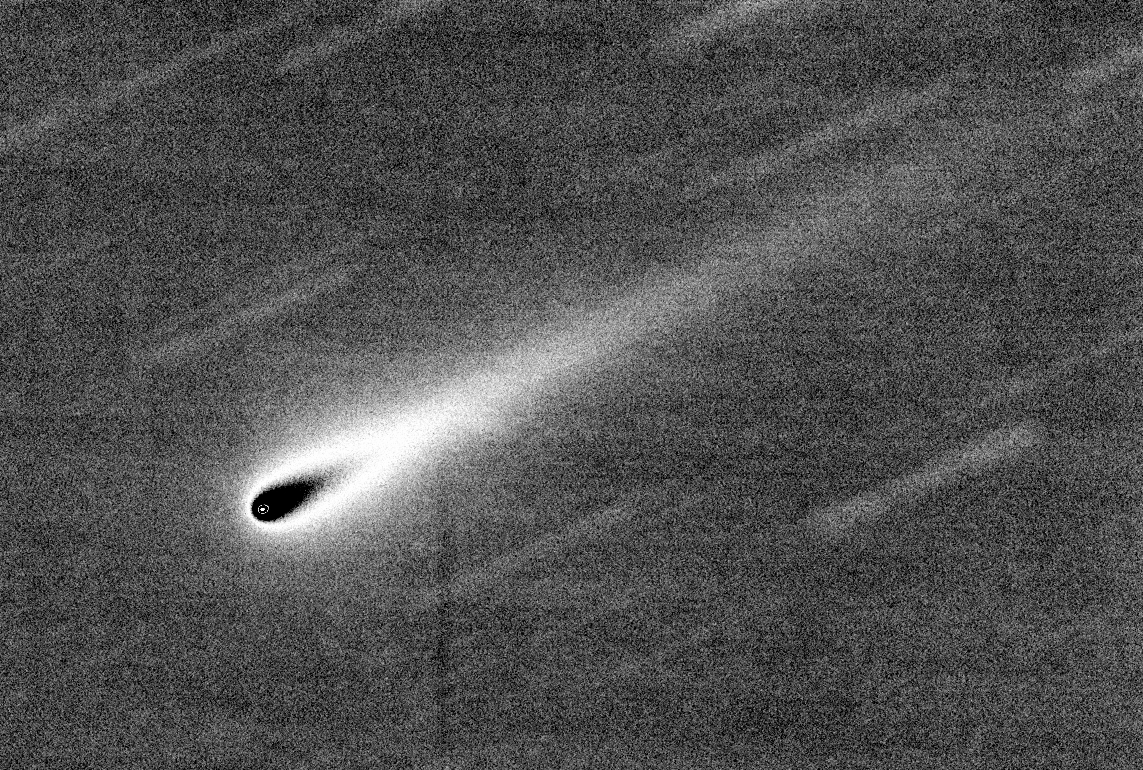
8x zoom of coma (FOV = 2.6x1.9 'arc), after spatial enhancement using the PSI web site "Cometary Coma Image Enhancement Facility" (using Steve Larson's "Radially Variable Spatial Filtering," 3,3,0.3). Credit: Planetary Society Institute (PSI) "Cometary Coma Image Enhancement Facility" (Samarasinha, N. H., Martin, M. P., Larson, S. M, 2013. Cometary Coma Image Enhancement Facility, http://www.psi.edu/research/cometimen).
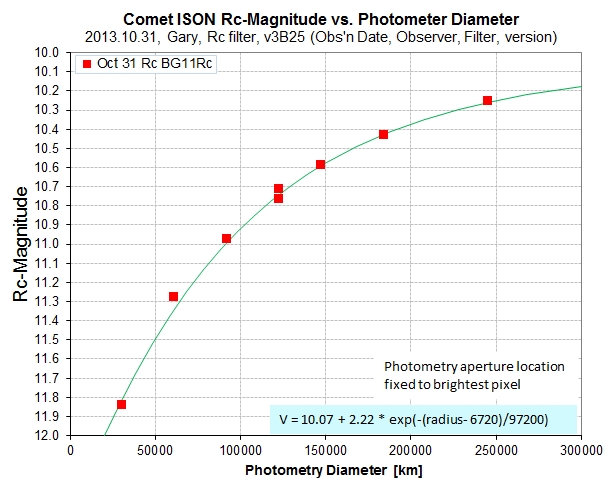
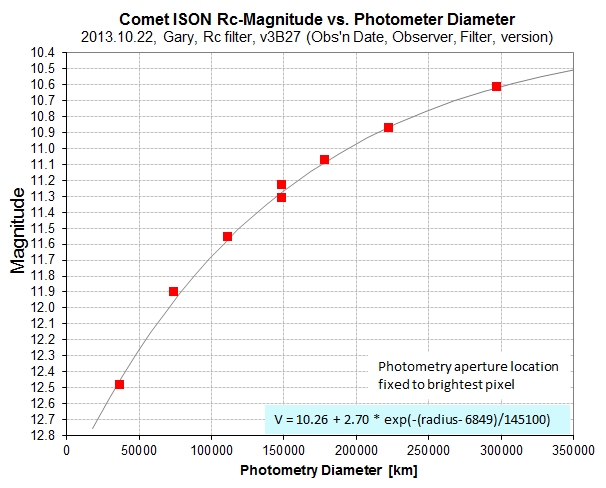
Gary Rc-mag vs. diameter of comet coma included in the photometry aperture.
For a coma diameter of 50,000 km Rc-mag = 11.50. For 200,000 km Rc-mag = 10.37.
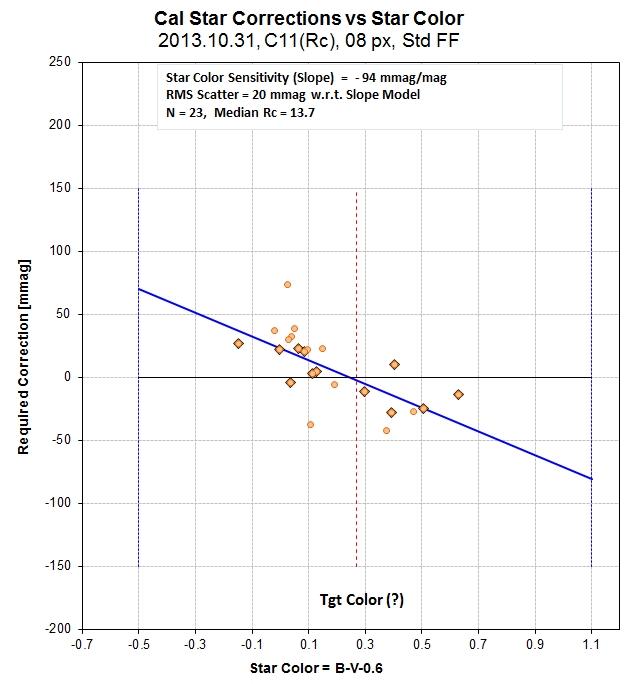
Example of internal consistency for reference star indicated magnitude minus Rc-mag (based on converting B, V and r' mag's) versus star color (B-V - 0.6). Indicated mag's are adjusted for agreement, which then allows any other indicated mag to be converted to APAS-based Rc-mag (provided the target object's color can be assumed). The RMS scatter with respect to the model (fitted line) is 20 mmag, so the SE for N = 23 such stars is 4.3 mmag. This is greater than the APASS systematic SE for r'-band, which I estimate to be ~ 15 mmag.
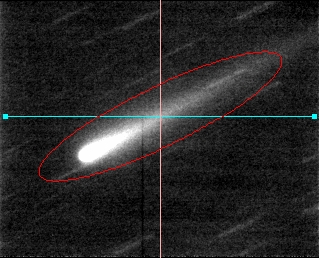
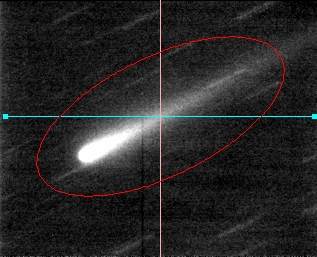
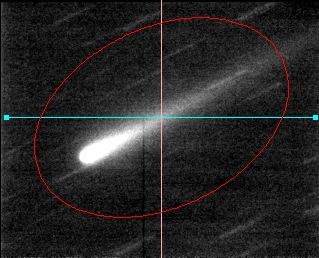
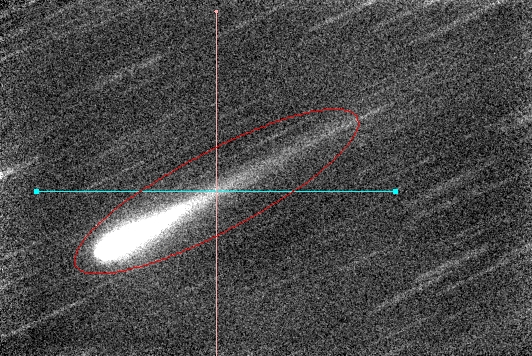
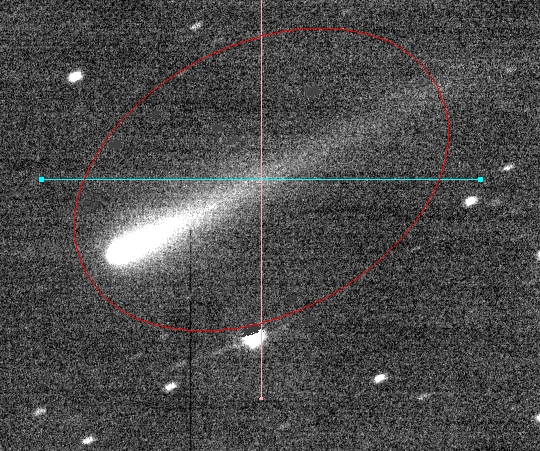
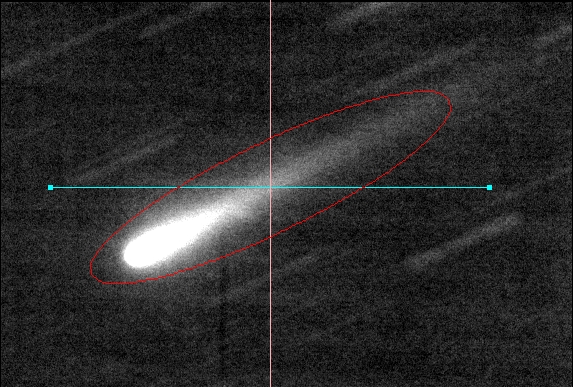
Oval apertures used to determine "total magnitude." Total counts within the ovals are compared in a way that is equivalent to using oval differences to establish sky background counts level. The program APT is used.
g'-band
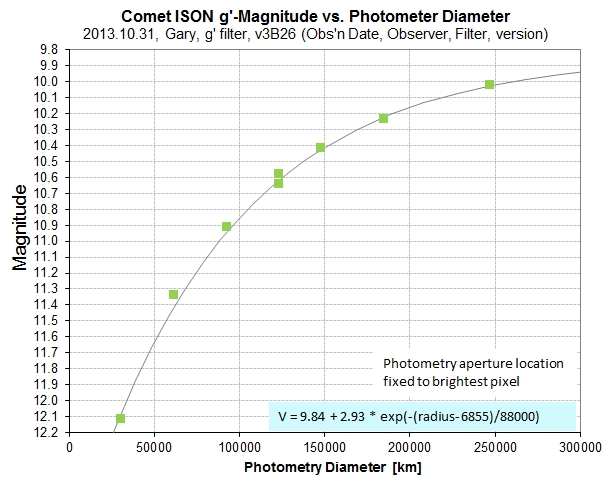
Gary g'-mag vs. diameter of comet coma included in the photometry aperture.
For a coma diameter of 50,000 km g'-mag = 11.63. For 200,000 km g'-mag = 10.16.
r'-band
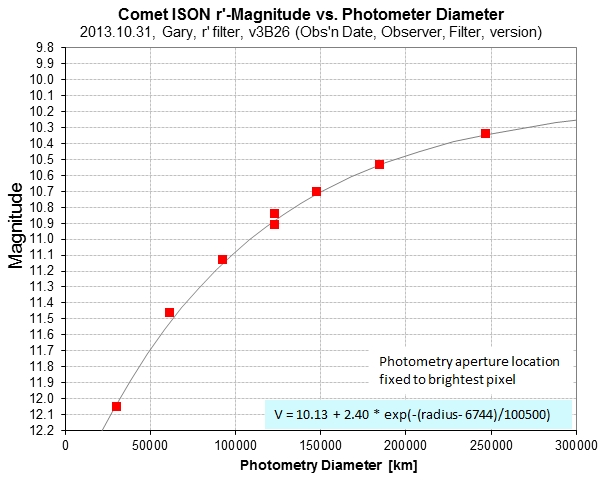
Gary r'-mag vs. diameter of comet coma included in the photometry aperture.
For a coma diameter of 50,000 km r'-mag = 11.69. For 200,000 km r'-mag = 10.48.
i'-band
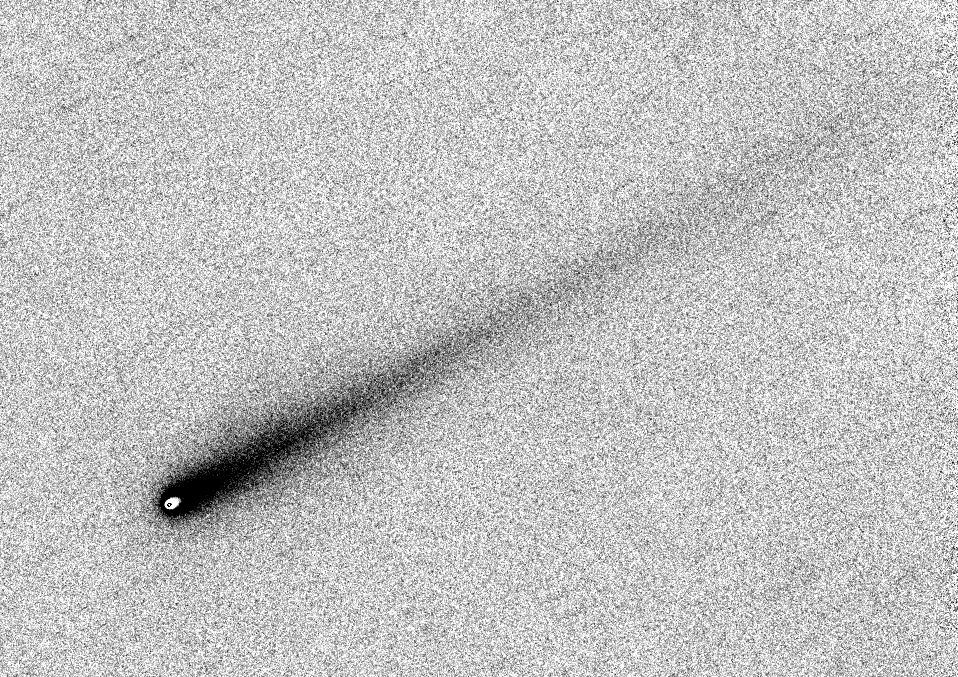
Complicated conversion of measured brightness to displayed brightness for Gary r'-band stacked image (10 median-combine). FOV = 31 x 21 'arc, north up, east left.
i'-mag versus coma diameter.
For a coma diameter of 50,000 km r'-mag = 11.66. For 200,000 km r'-mag = 10.60.
SED
The above magnitudes contain information about flux, which are used to produce a "spectral energy distribution" (SED).
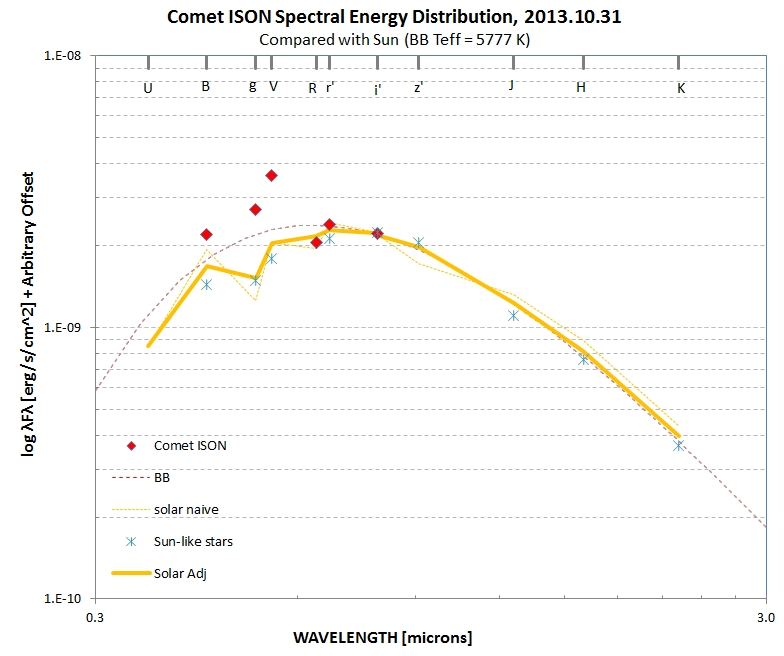
SED for coma diameter 50,000 km (aperture center fixed at brightest pixel).
Flux ratios (comet/sun):
B = 1.30
g' = 1.79
V = 1.77
Rc = 0.94
r' = 1.05
i' = 1.00
Gas molecules are emitting mostly within the g' and V bands, with some in the B band. This assumes that no gas emission is present in the Rc, r' and i' bands, which the measurements are consistent with.
2013.10.31 Whitmer R-band
Dennis obtained 70 90-second exposures with R-band filter. The last 30 images have been processed.
Complicated conversion of measured brightness to displayed brightness for Whitmer's R-band imaging (30 median-combine stack)
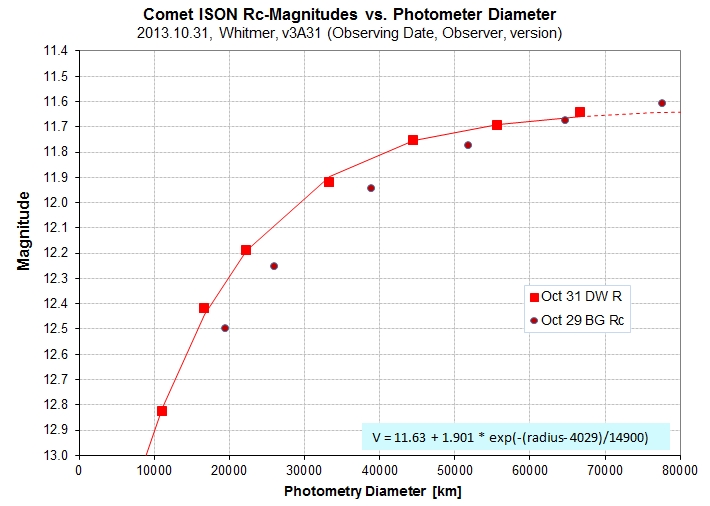
Rc-band brightness (based on R-band images) of the inner coma versus coma diameter.
For a 60,000 km coma diameter Rc-mag = 11.68. "Diameter" of coma is ~ 33,000 km.
2013.10.30 Kaye
Among the 100 images taken most were too close to a very bright star to be useful. The only product that's worth presenting is a zoom of a enhanced coma.
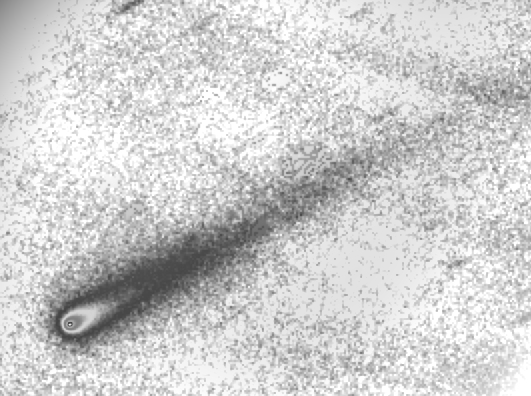
Complicated conversion of measured brightness to displayed brightness for Kaye's Oct 30 R-band imaging (61 median-combine stack). No jet evident.
2013.10.29 Gary Rc-band
Nature was trying to thwart me this morning: Clouds, wind (28 mph peaks) and a nearby moon caused all but 16 of 345 images to be rejected. Telescope was Celestron 11-inch; exposure time = 15 seconds.
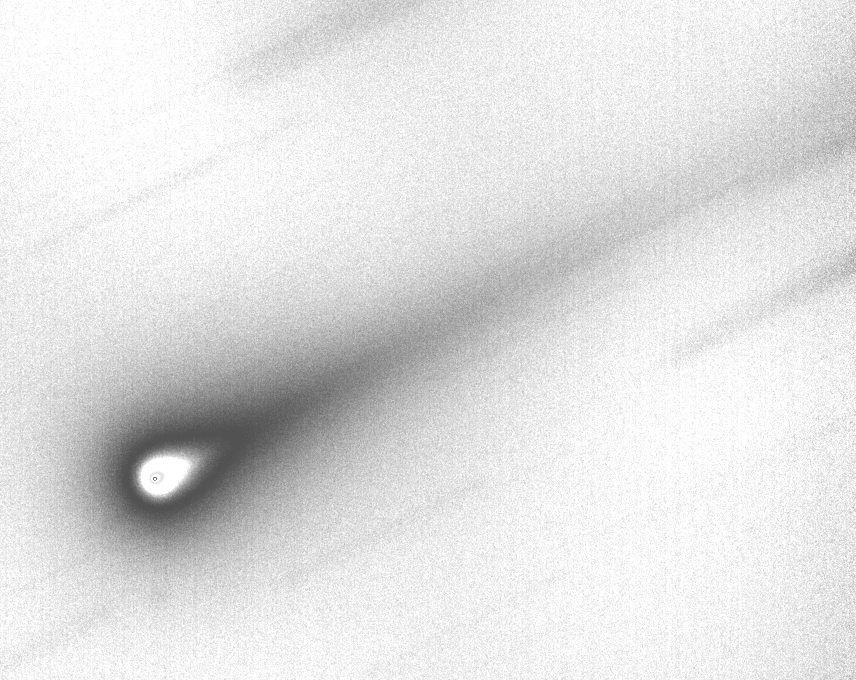
Complicated conversion of measured brightness to displayed brightness for Gary's Rc-band imaging (16 median-combine stack)
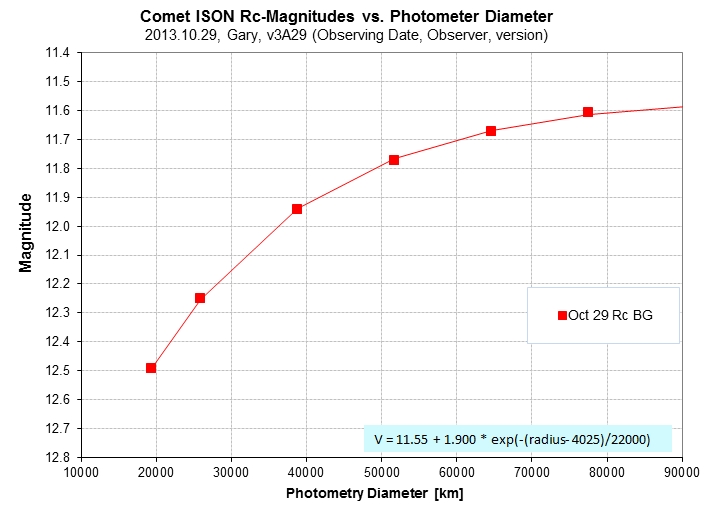
Rc-band brightness of the inner coma versus coma diameter.
For a coma diameter of 60,000 km, Rc-mag = 11.70. Coma diameter = 44,000 km (using my arbitrary definition).
Determining total flux using APT's oval photometry aperture 120/24/27 (oval length, width & angle). Oval width 2x & 3x larger was used to establish sky background counts.
Total Rc-mag = 9.70 ± 0.05.
2013.10.28 Kaye V-band
Tom Kaye took 99 images with the Tenagra 32-inch telescope using a V-band filter, exposure times of 20 sec.
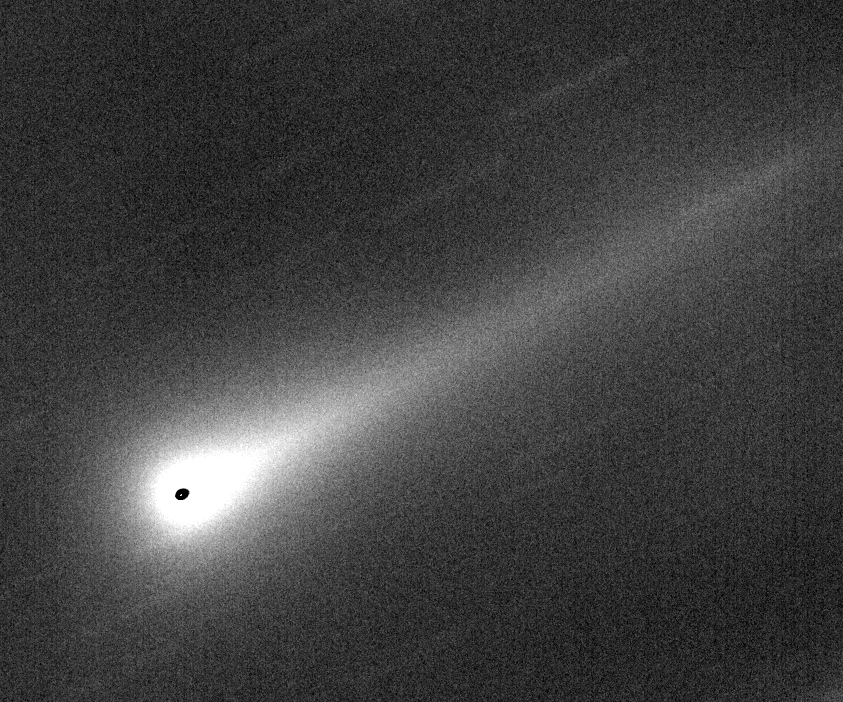
Complicated conversion of measured brightness to displayed brightness for Kaye's V-band imaging (99 median-combine stack), using the Tenagra Observatory 32-inch telescope. Notice that the tail appears fainter than in R-band images (V-band is affected most by molecular emission whereas the tail is a dusty red.)
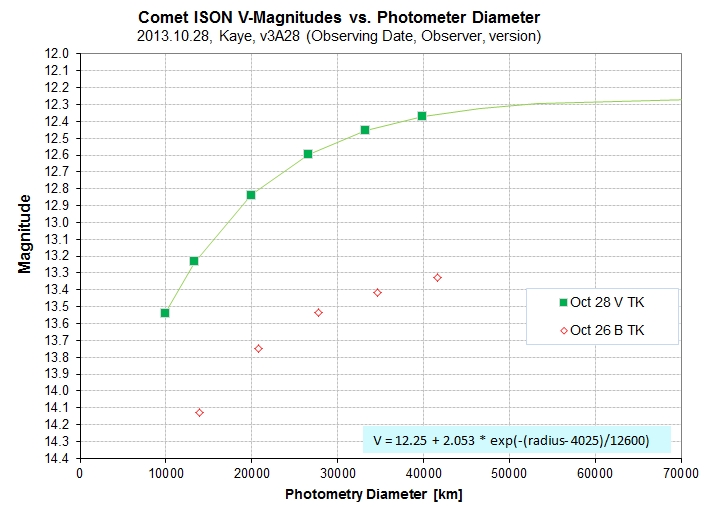
V-band brightness of the inner coma versus coma diameter.
For a coma diameter of 60,000 km, V-mag = 12.29.
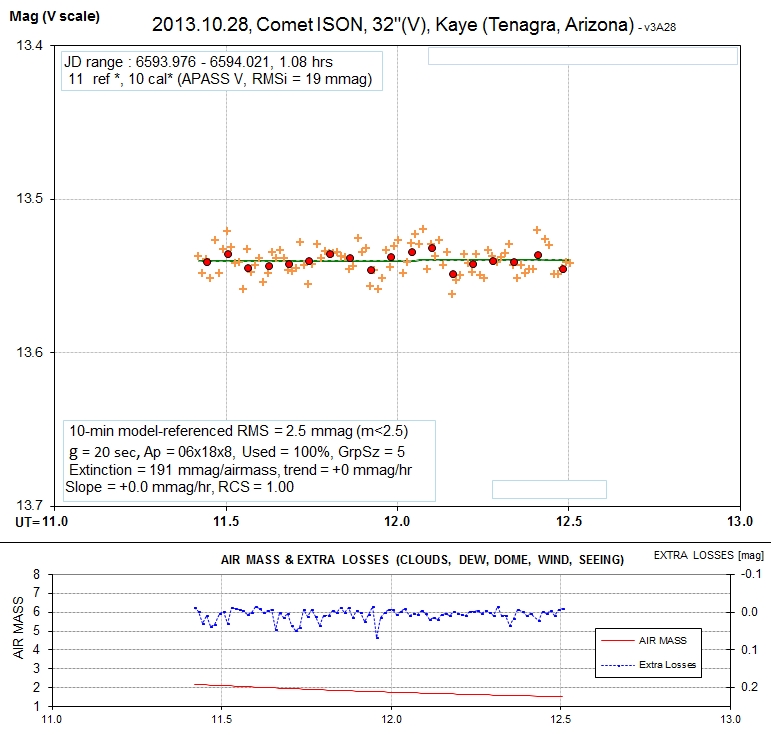
Light curve for the inner-most 10,000 km showing no variability.
The lack of variability in this LC suggests that the previous two times when variability was present it may have been an artifact of stars passing in and out of the photometry aperture as the comet moved past background stars.
Determining total flux using APT's oval photometry aperture 139/30/27 (oval length, width & angle). Oval width 2x & 3x larger was used to establish sky background counts.
Total Rc-mag = 9.50 ± 0.03.
This total V-mag is interesting, because the last total V-mag measurement was Oct 22 yielding V-mag = 9.50. There should have been a 0.68 mag brightening during the last 6 days, due to the comet coming closer to Earth, but since there was no change the "reduced V-mag" has faded 0.68 mag!
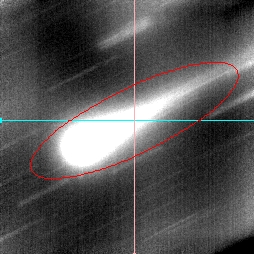
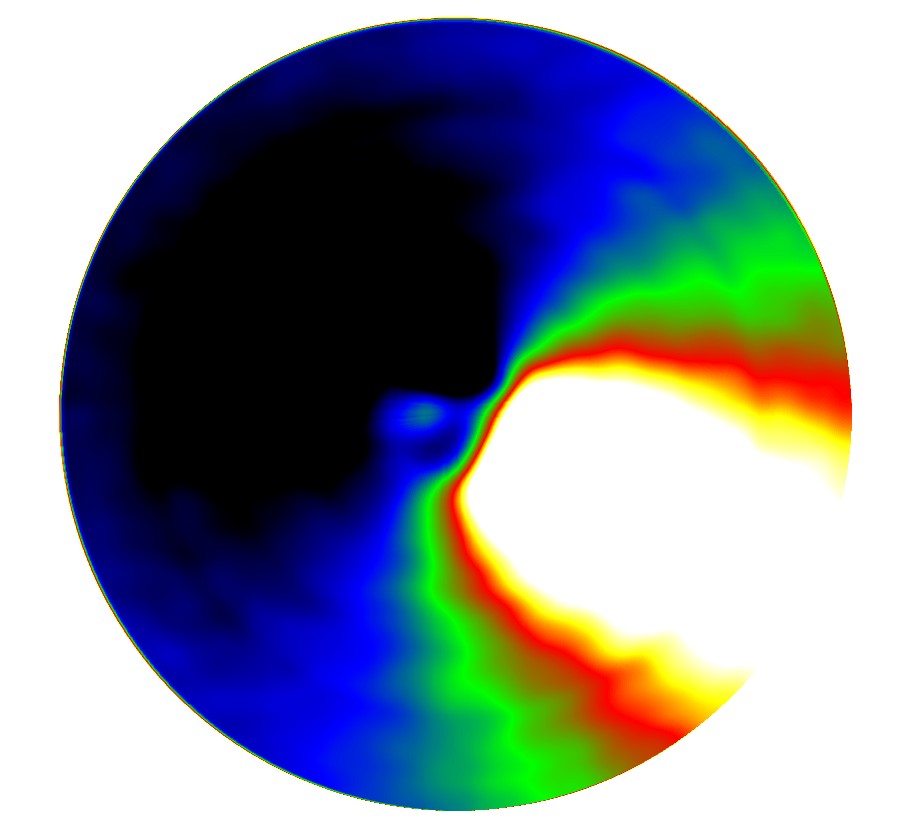
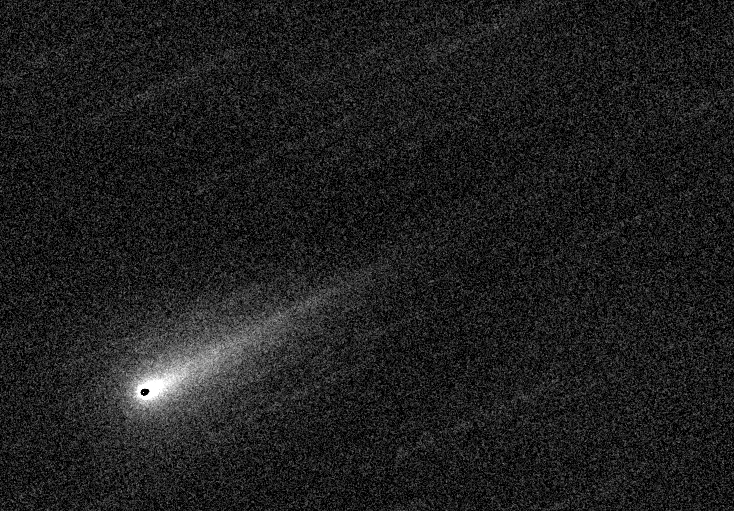
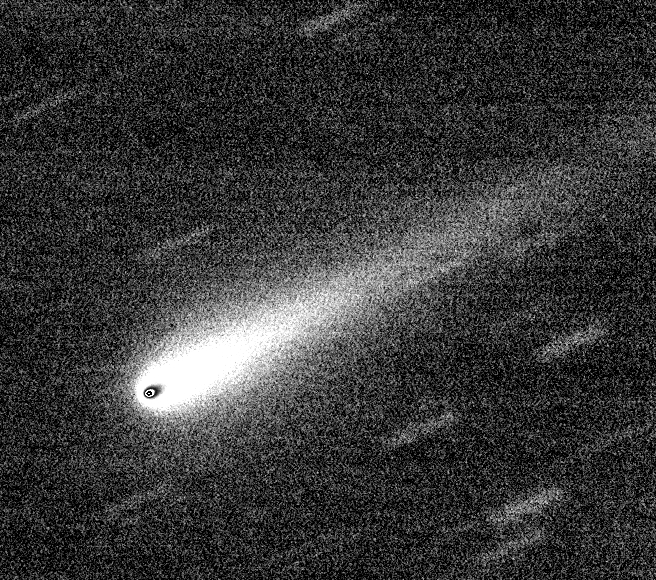
Here's a spatially enhanced image of the Oct 28 coma:
This is a false-color spatial enhancement of the inner coma, showing a possible "coma feature" on the sunward side. Image scale is the same as the original, 0.86 "arc/pixel (or 830 km/pixel). The original image is by Tom Kaye and the enhancement is by Beatrice Mueller and Nalin Samarasinha, Planetary Science Institute, Tucson, AZ.
Keep in mind that placement of spatial enhancing filters is critical and manual misplacement can produce artifact "jet-like" features. If this feature exists then it would be less pronounced than the HST jets seen in April and May.
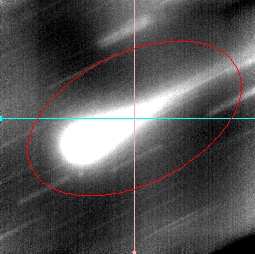
Here's a Toni Scarmato enhancement, using a MCM procedure:
Toni Scarmato spatial structure enhancement using MCM procedure.
And another Toni Scarmato enhancement using a Larson-Sekanina filter:
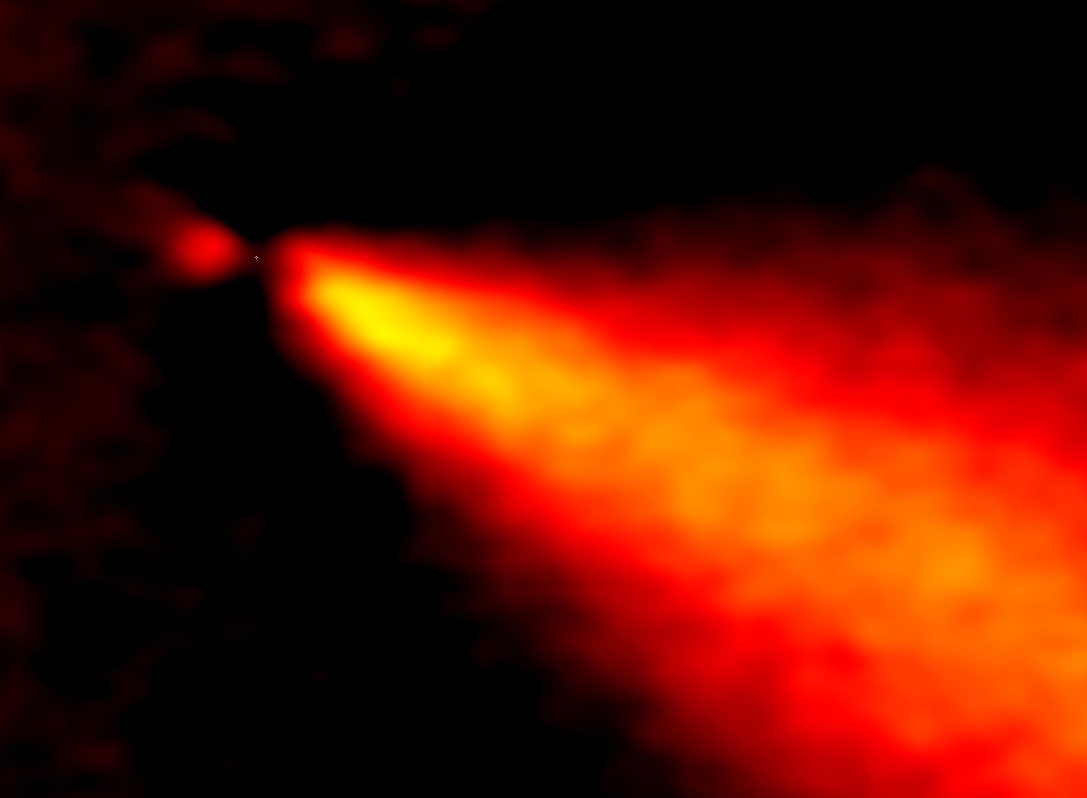
Toni Scarmato's LS enhancement of the same original image.
When two analysts obtain essentially the same spatial enhancement result I will post them on this web page. Keep in mind the difficulties of spatial enhancing images to the level achieved above.
2013.10.26 Kaye B-band
Complicated conversion of measured brightness to displayed brightness for Kaye's B-band imaging (22 median-combine stack), using the Tenagra Observatory 32-inch telescope.
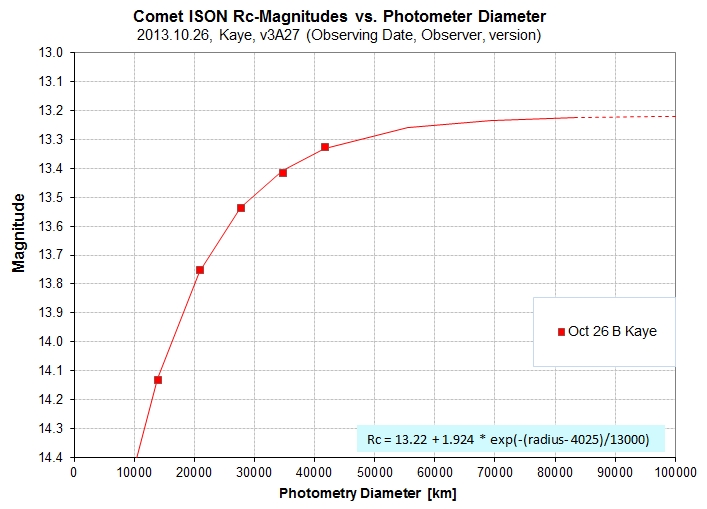
B-band brightness of the inner coma versus coma diameter.
For a coma diameter of 60,000 km, B-mag = 13.25.
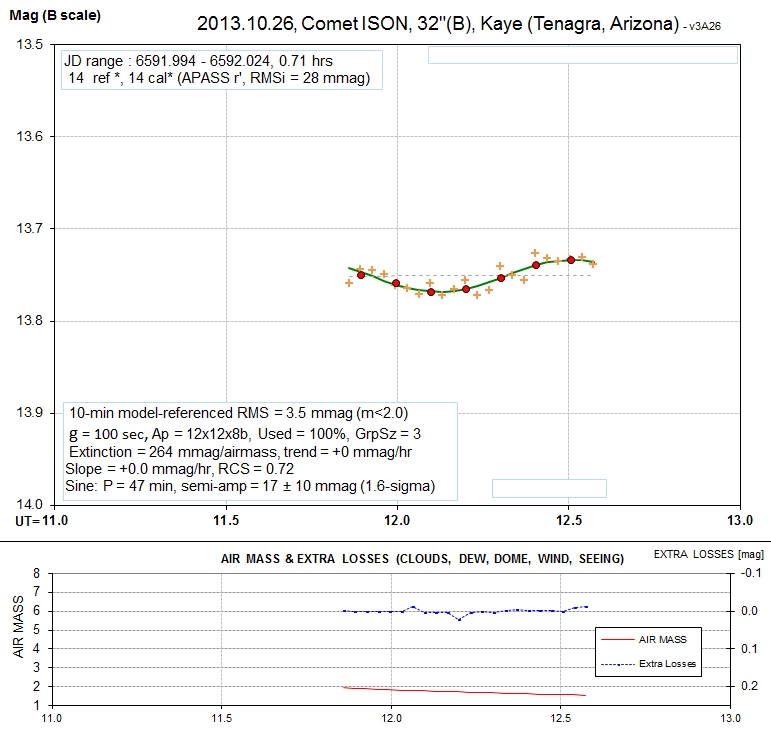
"Light curve" showing sinusoidal variation with P ~ 47 minutes.
This is the 2nd LC for the comet using a large enough aperture to detect variability, and in both cases a small-amplitude quasi-sinusoidal variation has been seen. It could be a jet that changes orientation as the nucleus turns, causing a sinusoidal periodicity with P 1/2 of the actual rotation period (just like asteroids). However, it is extremely unlikely that any comet will rotate with a period shorter than ~ 2 hours; as far as I know there are no reports in the literature for P < 3 hours.
2013.10.26 Whitmer R-band
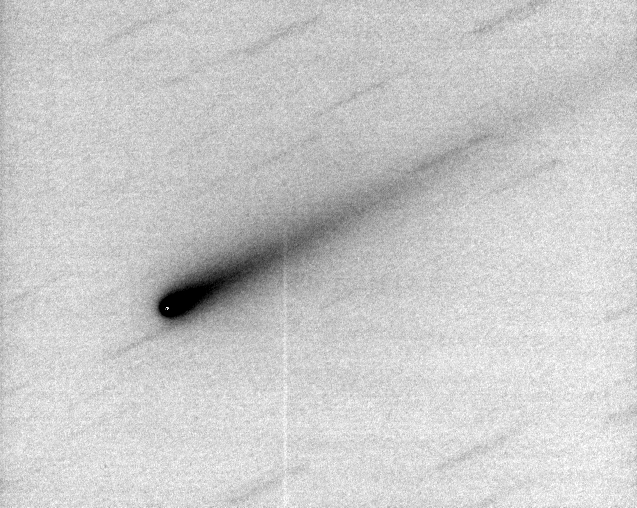
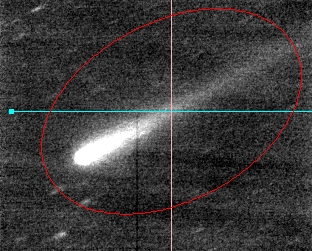
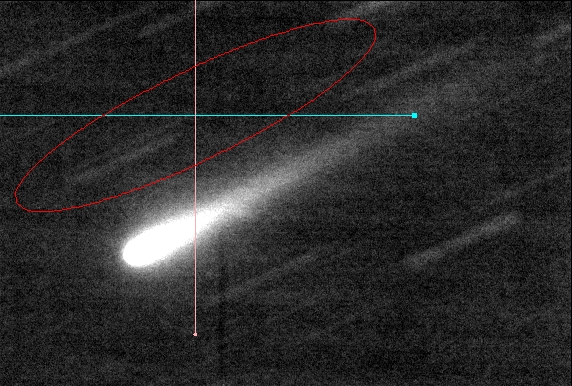
Complicated conversion from observed brightness to displayed brightness for illustrating location of coma center in relation rest of coma and tail. Median combine of 30 90-second exposures, RB-band filter, 14-inch Celestron, by Whitmer, on 2013.10.26. North up, east left.
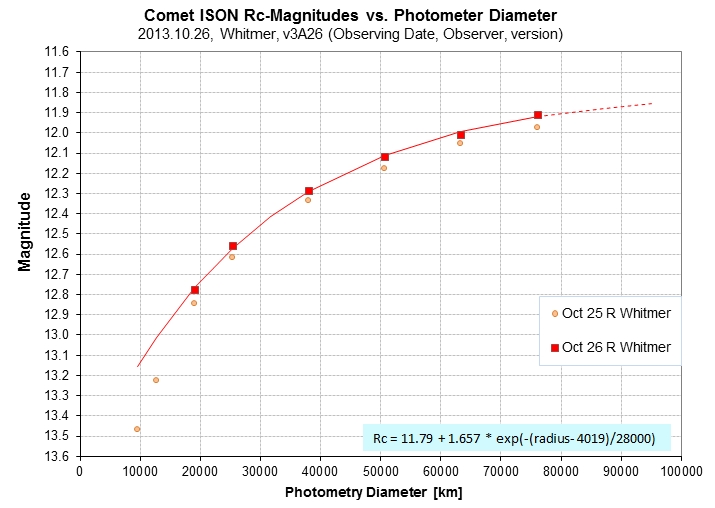
Rc-mag vs photometry aperture size in units of km at the comet's distance. Solid square symbols are for "half size" images.
For coma diameter 60,000 km, Rc-mag = 12.04.
Determining total flux using APT's oval photometry aperture 139/30/27 (oval length, width & angle). Oval width 2x & 3x larger was used to establish sky background counts.
Total Rc-mag = 9.81 ± 0.03.
2013.10.25. Whitmer R-band
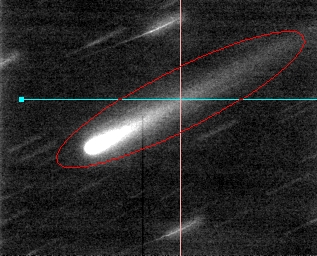
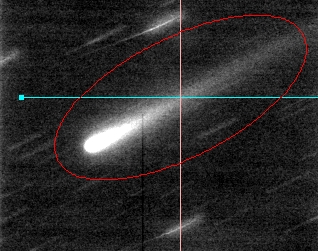
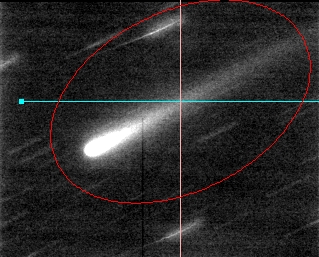
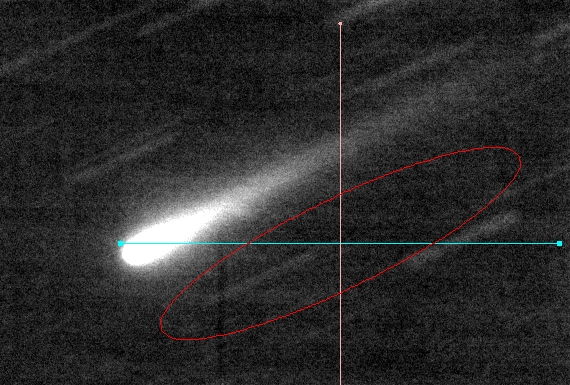
Complicated conversion from observed brightness to displayed brightness for illustrating location of coma center in relation rest of coma and tail. Median combine of 30 90-second exposures, RB-band filter, 14-inch Celestron, by Whitmer, on 2013.10.25. North up, east left.
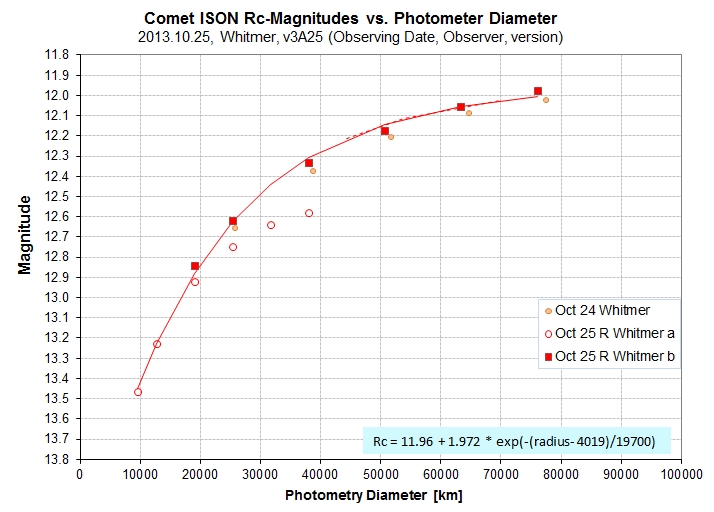
Rc-mag vs photometry aperture size in units of km at the comet's distance. Solid square symbols are for "half size" images, allowing for measurements of greater diameter comas (with sky background annulus farther away from comet, which reduces tail contamination).
For coma diameter = 60,000 km, Rc-mag = 12.08.
Determining total flux using APT's oval photometry aperture 139/30/27 (oval length, width & angle). Oval width 2x & 3x larger was used to establish sky background counts.
Total Rc-mag = 9.85 ± 0.03.
2013.10.24. Whitmer R-band Image & Analysis
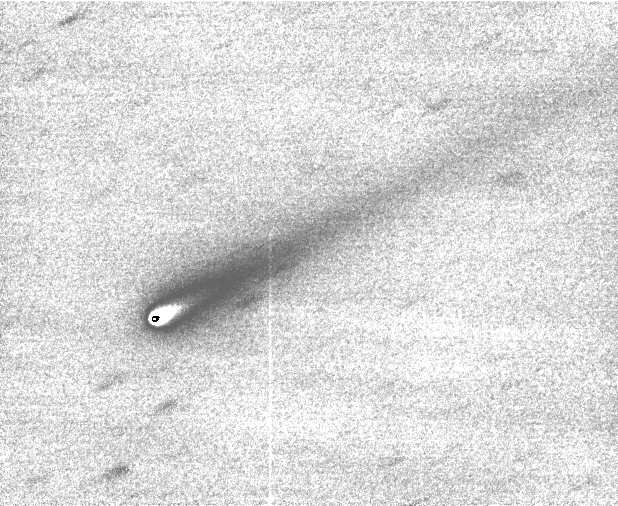
Complicated conversion from observed brightness to displayed brightness for illustrating location of coma center in relation rest of coma and tail. Median combine of 12 90-second exposures, RB-band filter, 14-inch Celestron, by Whitmer, on 2013.10.24. FOV = 15.9 x 13.0 'arc. North up, east left.
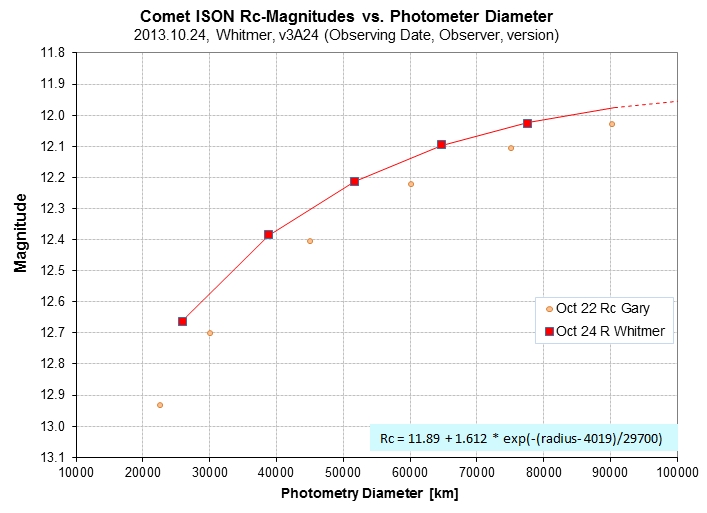
Rc-mag vs photometry aperture size in units of km at the comet's distance.
For a 60,000 km diameter Rc-mag = 12.14. Note, however, that the coma is larger than it used to be, so larger coma diameters for photometry measurements should be used.
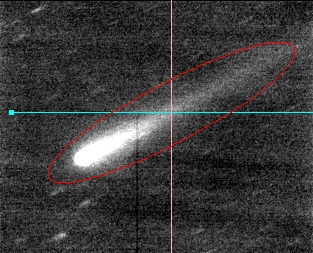
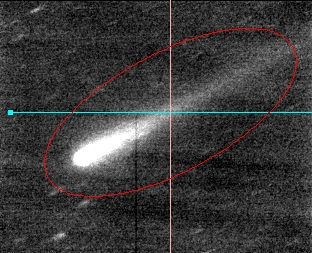
Determining total flux using APT's oval photometry aperture 140/30/28 (oval length, width & angle). Oval width 2x & 3x larger was used to establish sky background counts.
Total Rc-mag = 9.81 ± 0.03.
2013.10.23 Whitmer R-band Analysis
Whitmer obtained 50 images and I analyzed that last 6 for an uncertain Rc-mag estimate.
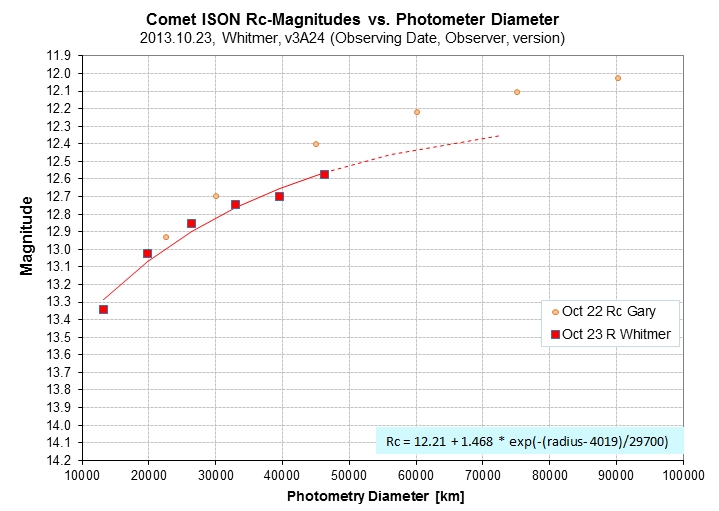
Rc-mag vs photometry aperture size in units of km at the comet's distance.
Extrapolated Rc-mag for 60,000 km diameter is 12.44. This Rc-mag is uncertain due to need for extrapolating.
2013.10.22 Gary B, V, Rc Images & Analysis
I observed for 2 hours with B, V and Rc filters with the goal of evaluating relative importance of gases vs. wavelength. A secondary goal was to produce a true-color "pretty picture."
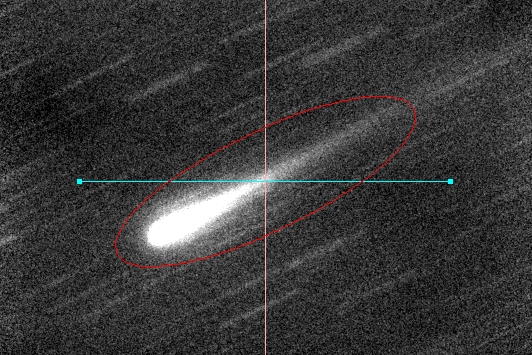
B Band
Complicated conversion from observed brightness to displayed brightness for illustrating location of coma center in relation rest of coma and tail. Median combine of 58 30-second exposures, B-band filter, 11-inch Celestron, by Gary, on 2013.10.22. FOV = 20.0 x 14.6 'arc. North up, east left.
For coma diameter of 50,000 km, B-mag = 13.15. For 200,000 km, B-mag = 11.56.
Determining total flux using APT's oval photometry aperture 101/40/26 (oval length, width & angle). Oval width 2x larger was used to establish sky background counts.
Total B-mag = 10.43 ± 0.01 (stochastic SE) ± 0.05 (estimated total SE).
V Band
Complicated conversion from observed brightness to displayed brightness for illustrating location of coma center in relation rest of coma and tail. Median combine of 49 30-second exposures, B-band filter, 11-inch Celestron, by Gary, on 2013.10.22. North up, east left.
V-mag vs photometry aperture size in units of km at the comet's distance.
For coma diameter of 50,000 km, V-mag = 12.28. For 200,000 km, V-mag = 10.61.
Determining total flux using APT's oval photometry aperture 121/50/26 (oval length, width & angle). Oval width 2x larger was used to establish sky background counts.
Total V-mag = 9.50 ± 0.02
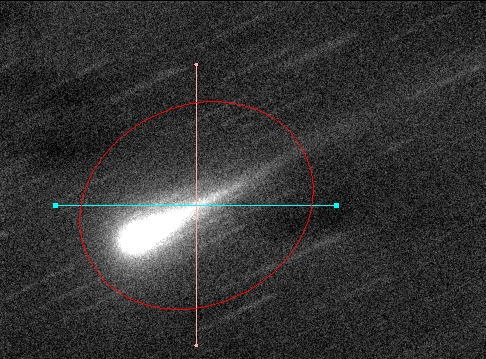
Rc Band
Complicated conversion from observed brightness to displayed brightness for illustrating location of coma center in relation rest of coma and tail. Median combine of 54 30-second exposures, Rc-band filter, 11-inch Celestron, by Gary, on 2013.10.22. North up, east left.
Rc-mag vs photometry aperture size in units of km at the comet's distance.
For coma diameter of 50,000 km, V-mag = 12.26. For 200,000 km, V-mag = 10.97.
For the comet's current color, we may use: B-V = 0.87 (for the coma).
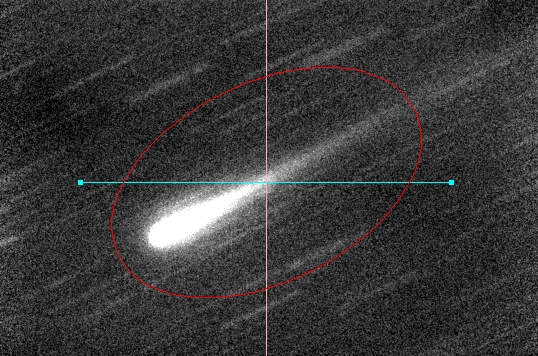
Determining total flux using APT's oval photometry aperture 166/50/26 (oval length, width & angle). Oval width 2x and 3x larger were used to establish sky background counts.
Total V-mag = 9.57 ± 0.02.
Using the above measurements for Comet ISON's B-, V- and Rc-mags it is possible to determine conversion equations (for ISON's current color):
Total V-mag = Total Rc-mag - 0.07
Coma V-mag (50,000 km diameter) = Coma Rc-mag (50,000 km diameter) + 0.02.
Spectral Energy Distribution
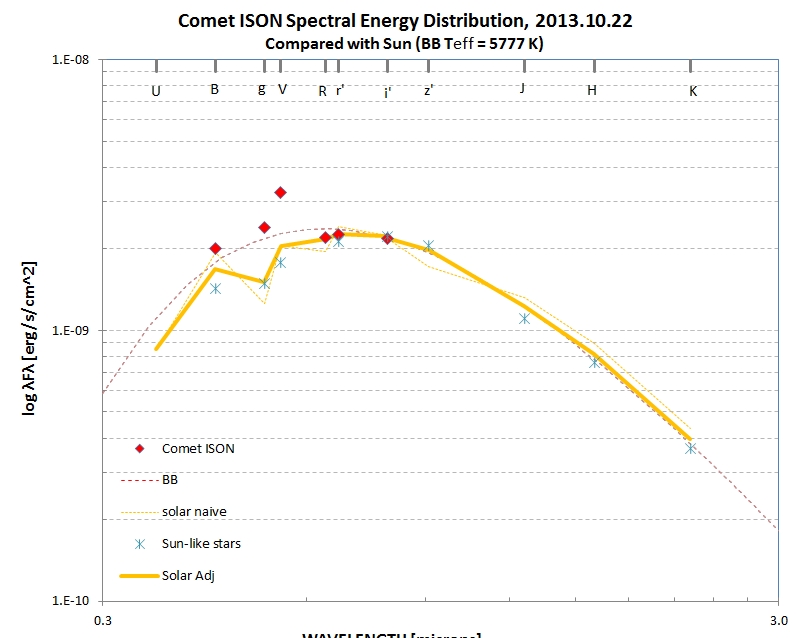
The above BVRc magnitudes produce the following SED:
Spectral Energy Distribution (SED) for Comet ISON compared with solar spectrum, for an inner coma diameter of 50,000 km, with a y-axis offset that places Rc-mag on the solar spectrum trace.
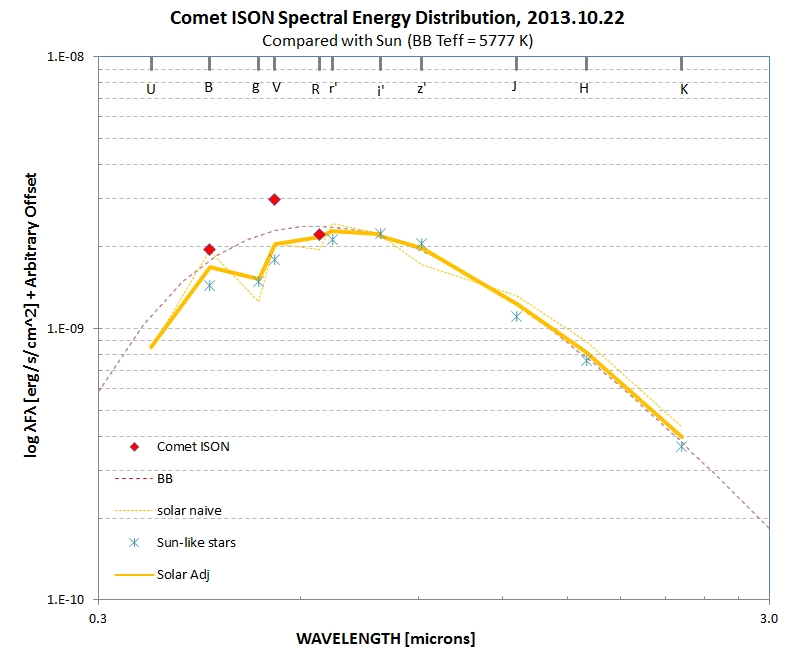
We can now fill-in more of the SED by adding this date's B, V Rc mag's to the g', r' and i' mags from 2 days earlier:
Spectral Energy Distribution (SED) for Comet ISON compared with solar spectrum, including measurements from Oct 20 and 22 for the inner coma (60,000 km diameter).
The above SED shows that molecular emission lines must be present at bands B, g' and V, and much less present (if at all) at bands Rc, r' and i'. I think this is consistent with theory.
Here's a true color image from this date's observations:
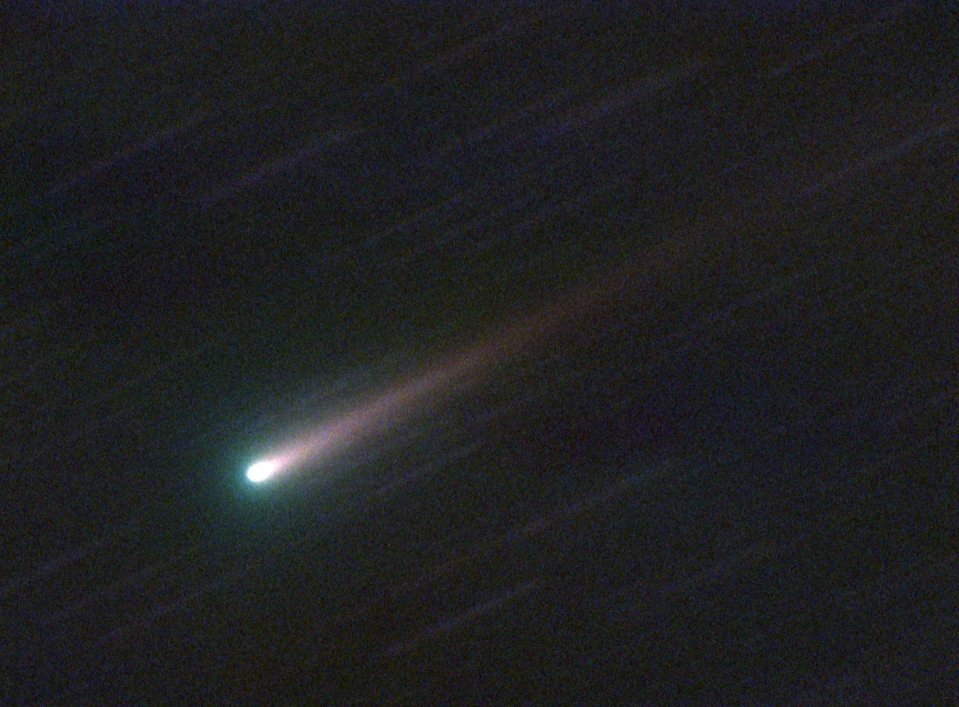
True color image, using Oct 22 B, V and Rc images (by Gary).
The coma is green due to molecular emission (by CO molecules?).
2013.10.21 Whitmer R-band
Another 70 images by Whitmer with his 14-inch Celestron.
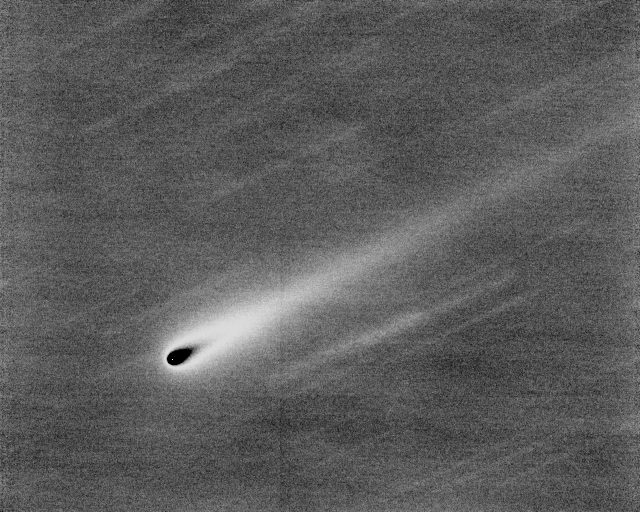
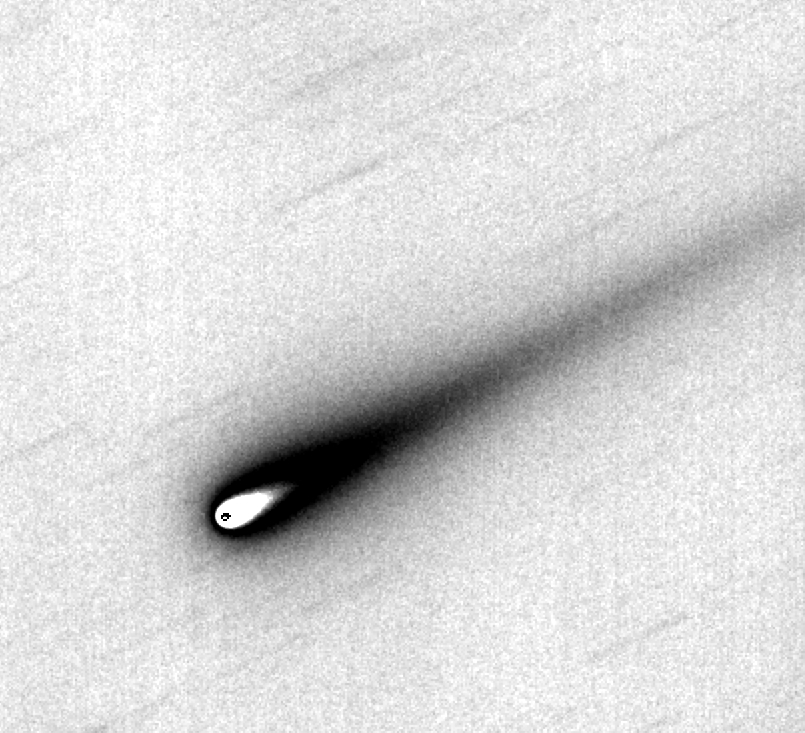
Complicated conversion from observed brightness to displayed brightness for illustrating location of coma center in relation rest of coma and tail. Median combine of 69 90-second exposures, R-band filter, 14-inch Celestron, by Whitmer, on 2013.10.21. North up, east left.
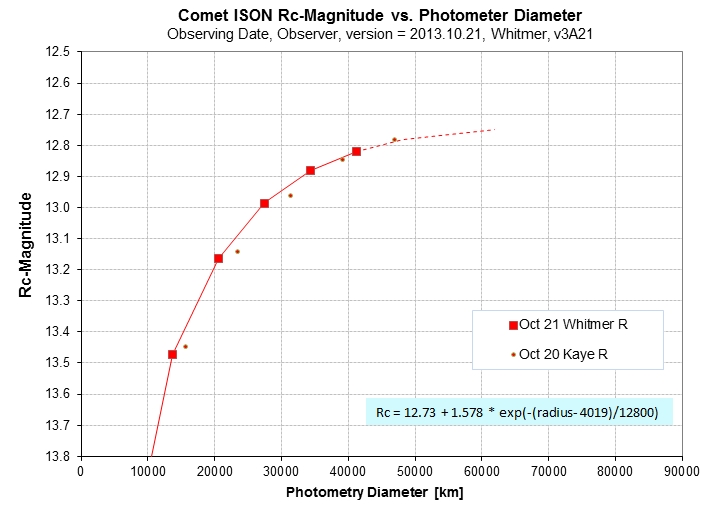
Rc-mag vs photometry aperture size in units of km at the comet's distance.
Extrapolating to 60,000 km diameter Rc-mag = 12.75.
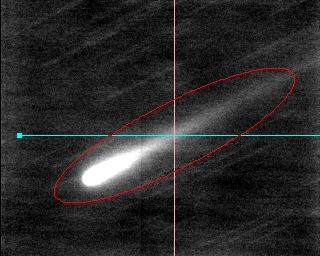
Determining total flux using APT's oval photometry aperture 135/33/27 (oval length, width & angle). Oval widths 2x and 3x larger were used to establish sky background counts.
Total Rc-mag = 9.92 ± 0.05.
2013.10.20 Kaye R-band
On this date new observer (in the neighborhood) Tom Kaye used a 32-inch telescope at Tenagra Observatory (40 miles away) to observe in R-band for 45 minutes. Exposure times were 20 seconds; 63 images were taken. Seeing was FWHM ~ 2.3 "arc.
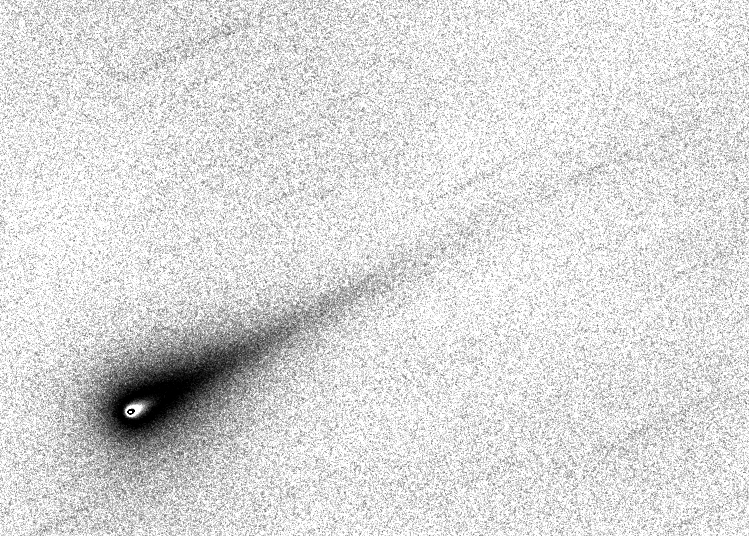
Complicated conversion from observed brightness to displayed brightness for illustrating location of coma center in relation rest of coma and tail. Median combine of 63 20-second exposures, R-band filter, 32-inch Celestron, by Kaye, on 2013.10.20. North up, east left.
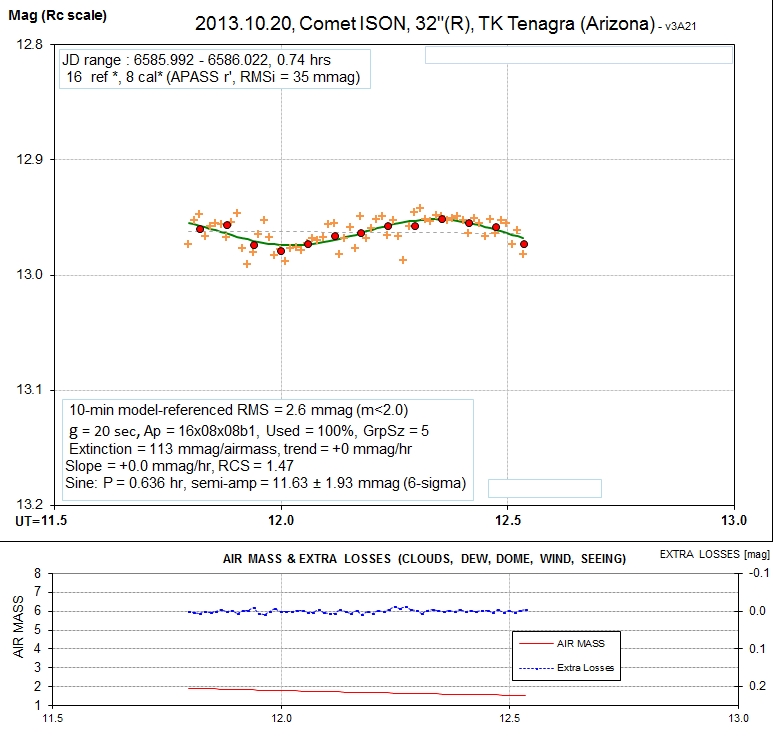
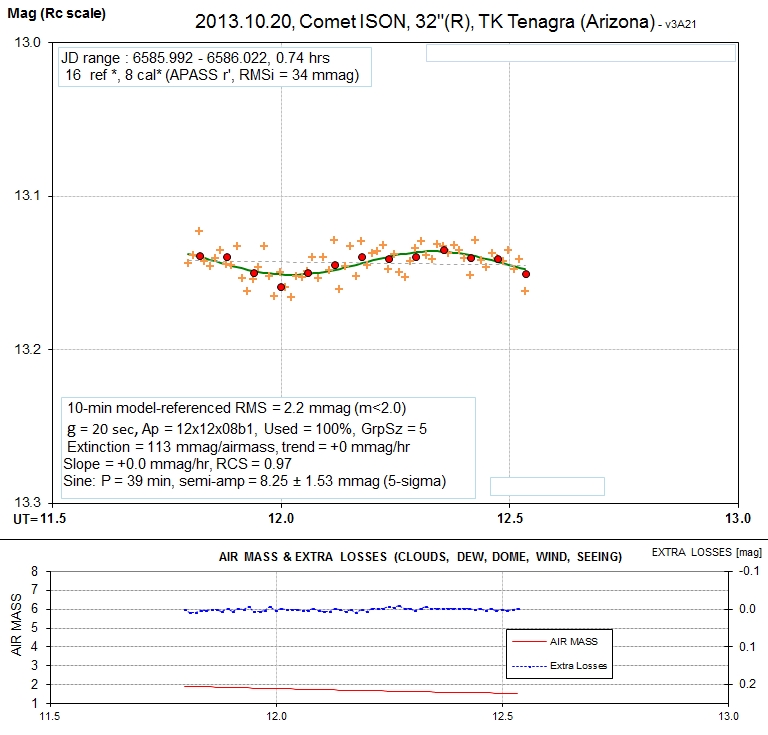
Short light curve (45 minutes long), with a sinusoidal fit showing a 39-minute periodicity with semi-amplitude that ranges from 11.6 mmag to 8.2 mmag, depending on size of the photometry aperture. Both variations are statistically significant (6- and 5-sigma).
This is the first time I've had a set of high signal-to-noise images to work with so if such a periodicity had been present before now I would have missed it. Could this variation be related to the nucleus rotation period? As with asteroids, a 39-minute periodicity could be produced by a 78-minute rotation of the nucleus. However, such a short rotation period is unlikely because it would require a density too high for comet bodies (centrifugal force must overcome gravity for loose things on the surface to stay put, etc). It's unlikely for any comet or asteroid to have a period shorter than about 2 hours, so I don't know what could cause the observed variation. (I checked all 16 reference stars, and none of them can be blamed for causing an apparent variation of the comet's brightness.)
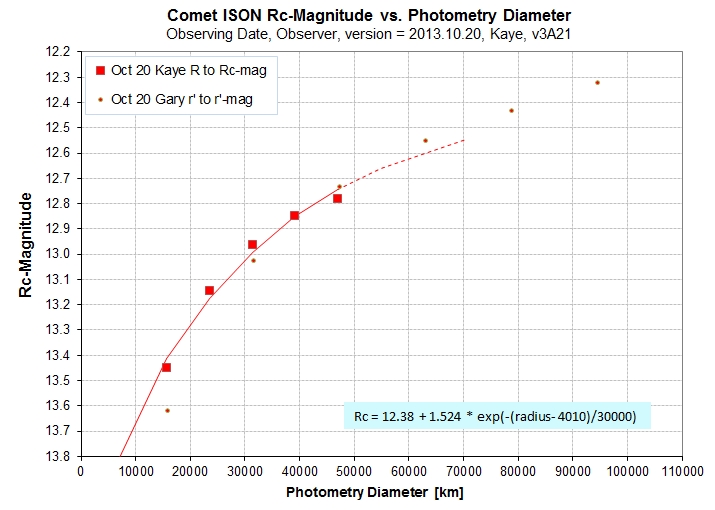

Two plots of Rc-mag vs photometry aperture size. The right panel has an extra small aperture datum, which alters the model fit significantly.
Extrapolating Rc-mag to larger photometry aperture sizes is risky, as the above pair of plots illustrate. The 60,000 km Rc-mag is either 12.62 or 12.73. For purposes of subsequent analyses I'll adopt Rc-mag = 12.65 (taking into account that small aperture measurements are inherently less accurate due to mis-alignment of the aperture with the coma). This value differs from my Rc-mag estimate using r'-band images taken at the same time (described below): Gary Rc-mag from r'-band images = 12.20 vs Kaye Rc-mag = 12.65. I wonder if it's no longer possible to convert from r'-mag to Rc-mag for the comet because of it's non-stellar SED?
The 32-inch telescope has a smaller field-of-view than my 11-inch telescope, so it includes less of the tail. It is therefore less suited for estimating "total magnitude" compared with smaller telescopes.
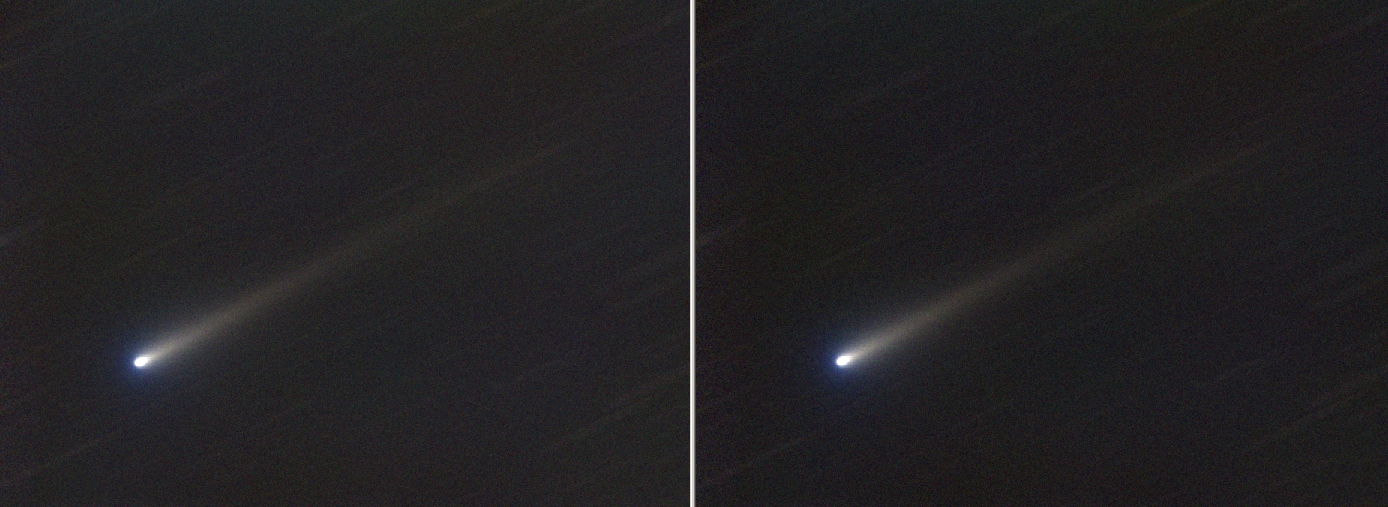
2013.10.20 Gary g', r' and i'-band
On this date I observed with filters g', r' and i' from 10:34 to 12:38 UT with a 11-inch aperture telescope. The goal was to assess the relative size and brightness of the coma in relation to the tail. If the coma is greatly influences by gases (such as C2) the following could be expected: 1) coma will be "greener" than the dust-mostly tail, 2) coma will be larger in size at g'-band than r'- or i'-band, and 3) the spectral energy distribution (SED) will show greater brightness at g'-band than r'- and i'-band in relation to the sun's SED.
g'-band Data
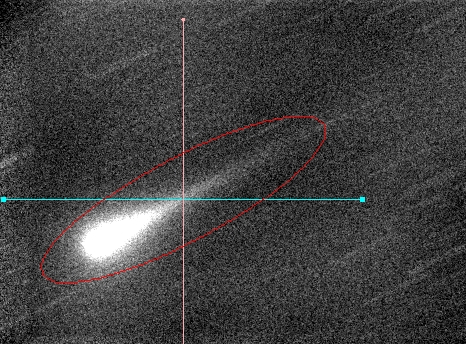
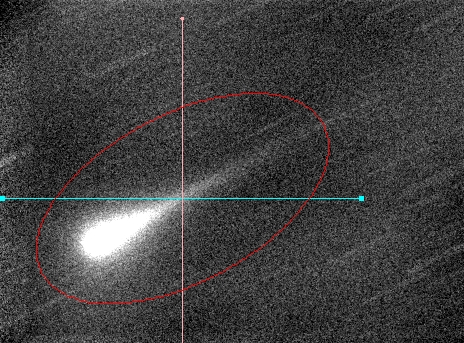
Complicated conversion from observed brightness to displayed brightness for illustrating location of coma center in relation rest of coma and tail. Median combine of 53 30-second exposures, g'-band filter, 11-inch Celestron, by Gary, on 2013.10.20. North up, east left.
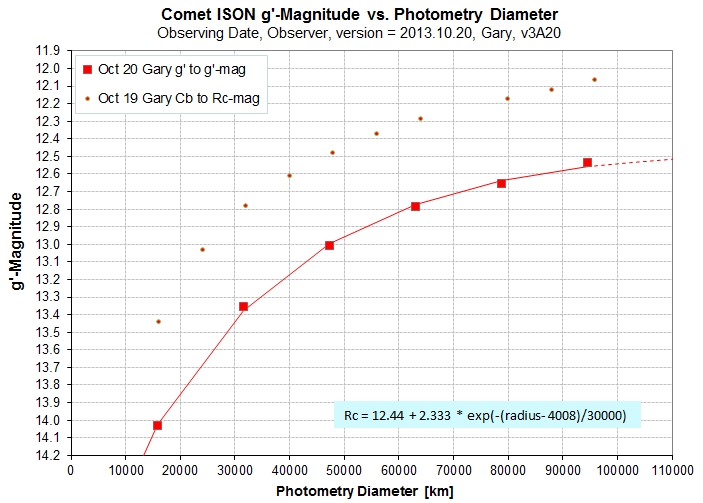
g'-band magnitude versus photometry aperture diameter at comet's distance for Gary Oct 20 image.
The shape of this "curve of growth" plot is the same at g'-band on Oct 20 as for Cb-band on Oct 19. For a diameter of 80,000 km g'-mag = 12.65.
Determining total flux using APT's oval photometry aperture 160/42/28 (oval length, width & angle). Right panel is for width x2 (used to determine background level).
A 3rd APT for x3 width was also used to establish background level. Total g'-mag = 9.86 ± 0.05 (stochastic + systematic SE).
r'-band Data
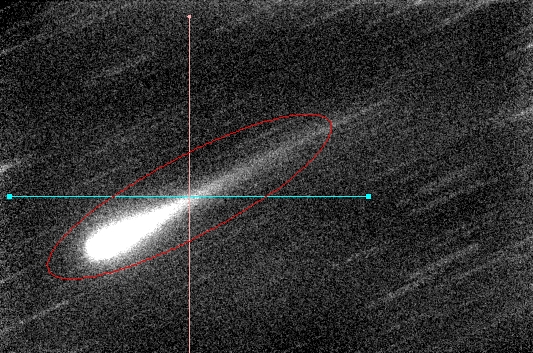
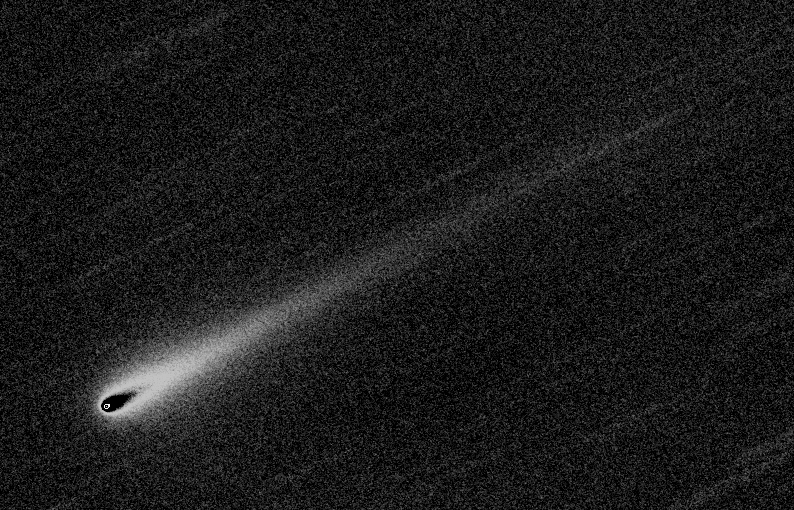
Complicated conversion from observed brightness to displayed brightness for illustrating location of coma center in relation rest of coma and tail. Median combine of 50 30-second exposures, r'-band filter, 11-inch Celestron, by Gary, on 2013.10.20. North up, east left.
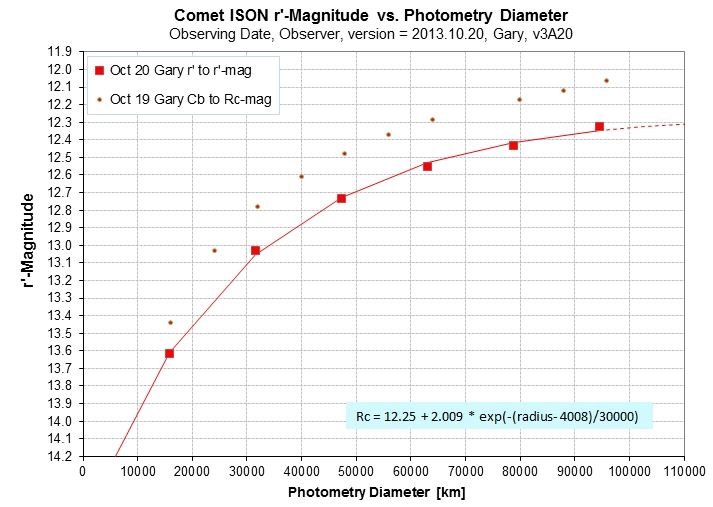
r'-band magnitude versus photometry aperture diameter at comet's distance for Gary Oct 20 image.
The shape of this "curve of growth" plot is the same at r'-band on Oct 20 as for g'-band (on Oct 20). For a diameter of 80,000 km r'-mag = 12.41. If we convert r'-mag to Rc-mag using stellar conversion equations, then Rc-mag = 12.20.
Determining total flux using APT's oval photometry aperture 160/40/28 (oval length, width & angle).
Other APT widths for x2 and x3 were used to establish background level. Total r'-mag = 9.87 ± 0.05 (stochastic + systematic SE).
i'-band Data
Complicated conversion from observed brightness to displayed brightness for illustrating location of coma center in relation rest of coma and tail. Median combine of 69 30-second exposures, i'-band filter, 11-inch Celestron, by Gary, on 2013.10.20. North up, east left.
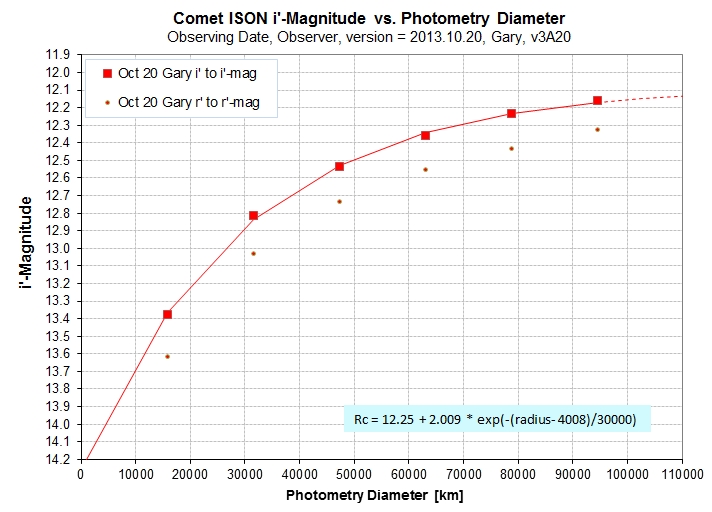
i'-band magnitude versus photometry aperture diameter at comet's distance for Gary Oct 20 image. '-band magnitude versus photometry aperture diameter at comet's distance for Gary Oct 20 image.
The shape of this "curve of growth" plot is the same at i'-band on Oct 20 as for r'-band (on Oct 20). For a diameter of 80,000 km g'-mag = 12.23.
Determining total flux using APT's oval photometry aperture 160/40/28 (oval length, width & angle).
Determining total flux using APT's oval photometry aperture 160/40/28 (oval length, width & angle) for i'-band median-combined comet-aligned image.
Other APT widths for x2 and x3 were used to establish background level. Total r'-mag = 9.79 ± 0.02 (stochastic + systematic SE).
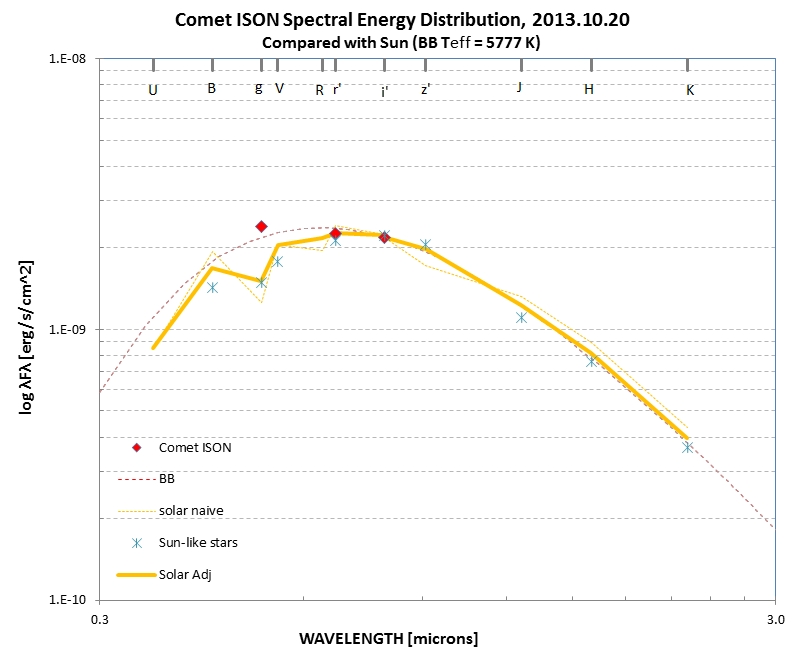
Spectral Energy Distribution (SED) for Comet ISON compared with solar spectrum.
The g'-band flux of Comet ISON's total flux is 1.7 times what would be expected if the entire comet (coma plus tail) consisted of dust with a constant albedo versus wavelength. A month ago the SEDs showed that g'-mags were lower than expected if the dust albedo was constant with wavelength; i.e., this must mean that a month ago there was negligible gas emission (within the g' passband) and that the dust had an albedo that increased with wavelength. Comparing the September and October 20 SEDs a case can be made for stating that most of the g'-band flux is due to molecular emission (e.g., C2 Swan bands). Further, a small amount of the r-band flux can be attributed to molecular emission.
For comparison, here's are the SEDs for Sep 16 & 24.
SEDs for Comet ISON from a month ago (before gases were present).
Converting g'r'i' to RGB Color
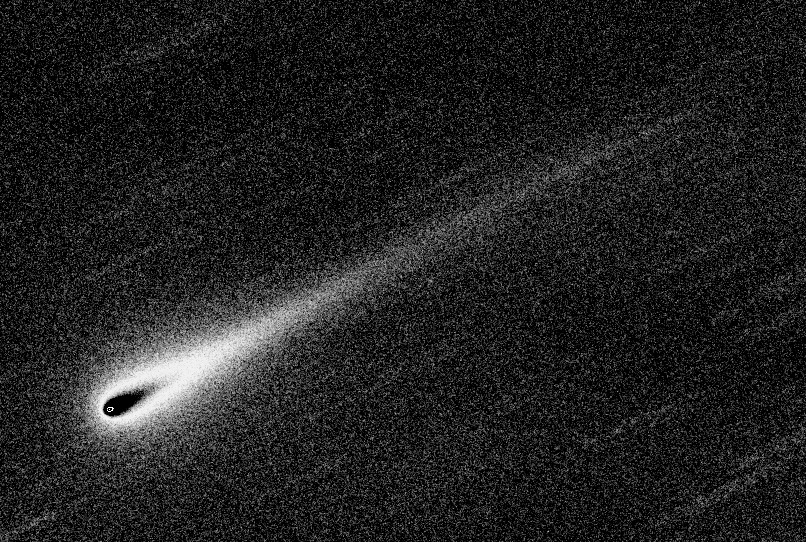
Two brightness level versions of a false color image created by converting i'r'g' to RGB, respectively, using a log stretch to show coma and tail colors. (Depending on your display settings one of these two will look better.) The blueness of this image comes from the g'-band filter which is in the green part of the spectrum; redness comes from the i'-band filter which is actually redder than the red part of the spectrum.
The coma is brighter at the shortest wavelength (g'-band) where molecular emission is strongest. (Since g'-band is in the green part of the spectrum a true color image might show the coma to be green.) The tail is relatively redder due to dust having a greater albedo at longer wavelengths (such as at i'-band).
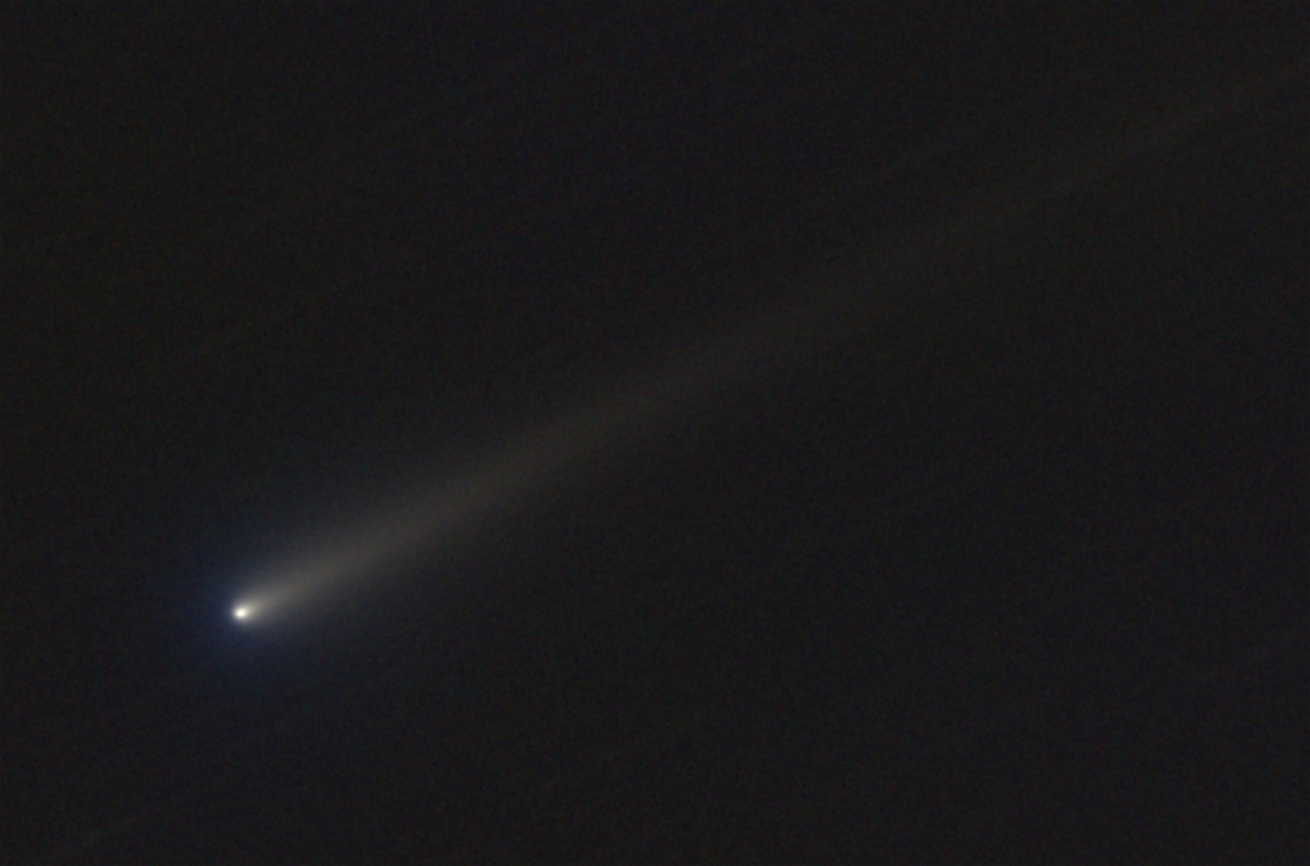
Zoom showing inner coma better. The front part of the coma is where the gas is.
2013.10.19 Whitmer R-band
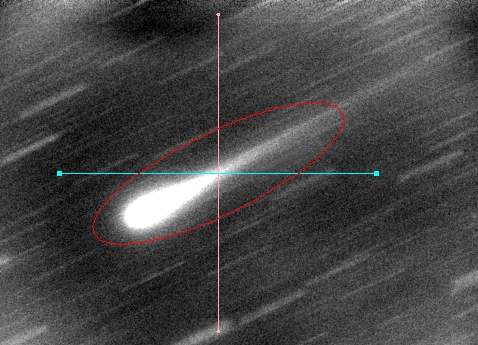
Complicated conversion from observed brightness to displayed brightness for illustrating location of coma center in relation rest of coma and tail. Median combine of 77 90-second exposures, R filter, 14-inch Celestron, by Whitmer, on 2013.10.19. North up, east left.
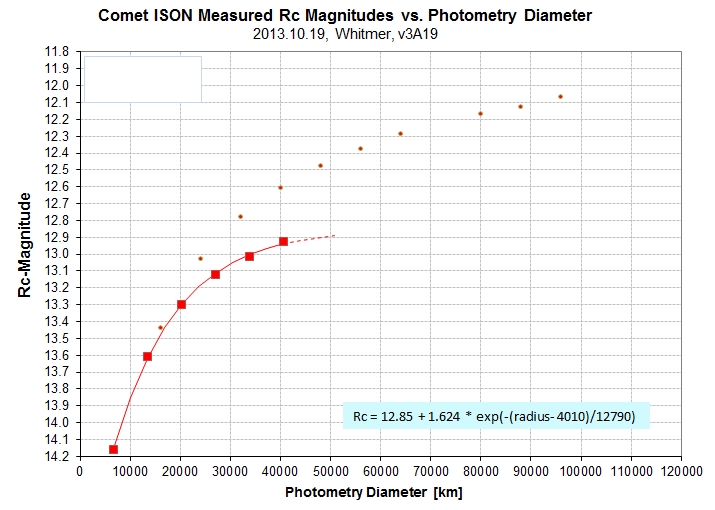
Rc-band magnitude versus photometry aperture diameter at comet's distance for Whitmer Oct 19 image.
Notice how the two plots of Rc-mag vs. diameter of coma enclosed begin to differ beyond ~20,000 km (10,000 km radius from nucleus). This might be due to the fact that Whitmer uses a R-band filter (sensitive to dust) whereas Gary uses a Cb-band filter (sensitive to dust AND gases). One interpretation of the coma from 10,000 km radius to at least 25,000 km is the presence of gases (C2, for example) in this region; Whitmer's R-band filter would be insensitive to these gases, whereas the Gary Cb-band filter would respond to their presence.
Also notice that the Gary plot extends to ~100,000 km diameter whereas the Whitmer plot ends at 40,000 km diameter. There are two reasons for this: 1) Whitmer is ha smaller field-of-view because his telescope is larger, with a longer focal length, and 2) Whitmer observes unbinned, whereas Gary observes binning 2x2, thus making it more feasible to use photometry apertures that cover a larger areas of the sky. There's logic in having different configurations; Whitmer's images are better for searching for jet structures while Gary's are better for obtaining total magnitudes (which require a large field-of-view for including most of the tail.
It's time that I did a g'r'i' observation.
Determining total flux using APT's oval photometry aperture 139/41/26 (oval length, width & angle). Right panel is for width x2 (used to determine background level).
Total Rc = 10.30 ± 0.05
Whitmer's total Rc-mag is fainter than Gary's, for the same observing time. Again, this may be due to Whitmer's filter being more responsive to the tail (which is "red") whereas Gary's filter includes a response to gasses plus the tail (the gasses are "green").
2013.10.19 Gary Cb-band Images & Mag's
Gary (that's me) took 206 20-second exposures, binned 2x2. The best 193 were used in the following analysis.
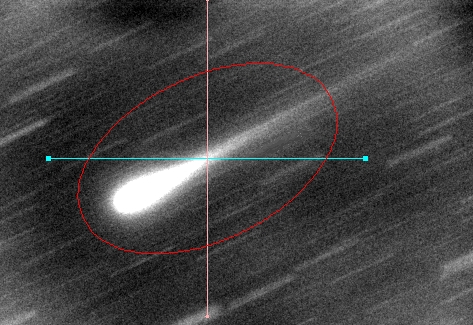
Complicated conversion from observed brightness to displayed brightness for illustrating location of coma center in relation rest of coma and tail. Median combine of 193 20-second exposures, Cb filter, 11-inch Celestron, by Gary, on 2013.10.19. North up, east left.
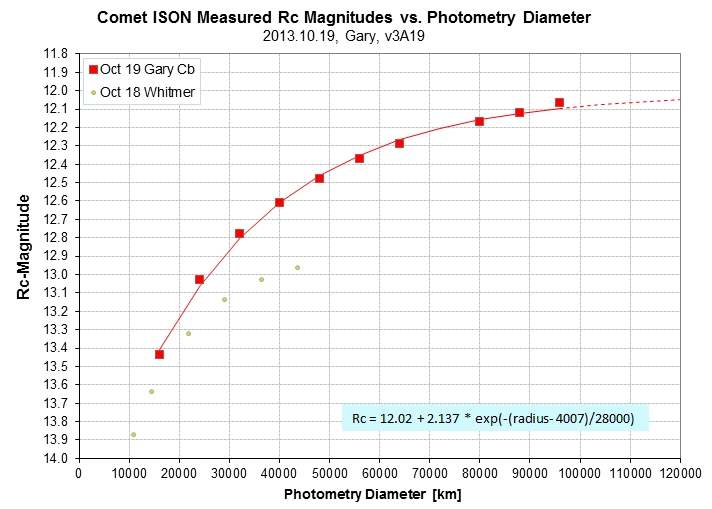
Rc-band magnitude versus photometry aperture diameter at comet's distance for Gary Oct 19 image.
There is a big change from the day before, with the outer coma brightening more than the inner coma.
Determining total flux using APT's oval photometry aperture 139/40/26 (oval length, width & angle). Right panel is for width x2 (used to determine background level).
(A 3x image was also used for establishing background level.)
Total Rc = 9.93 ± 0.01
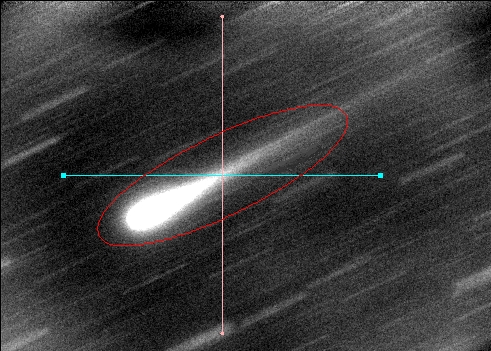
2013.10.18 Whitmer R-band Images & Mag's
Complicated conversion from observed brightness to displayed brightness for illustrating location of coma center in relation rest of coma and tail. Median combine of 65 comet-guided 90-second exposures, R filter, 14-inch Celestron, by Whitmer, on 2013.10.18. North up, east left.
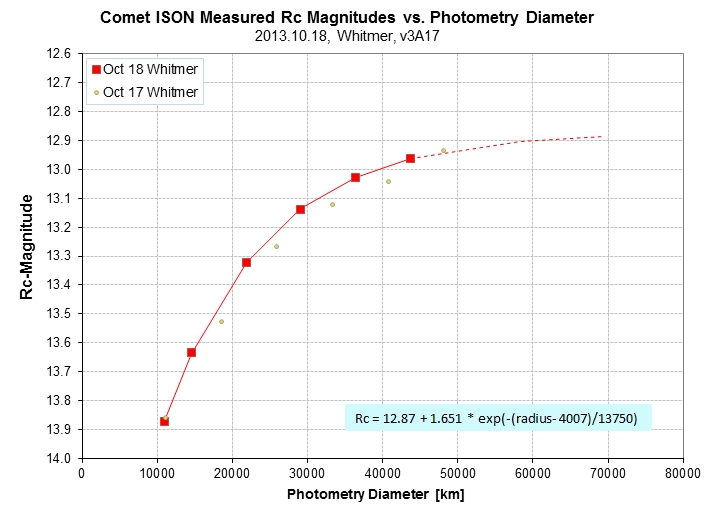
Rc-band magnitude versus photometry aperture diameter at comet's distance for Whitmer Oct 18 data.
For coma diameter of ~ 60,000 km Rc = 12.90.
Determining total flux using APT's oval photometry aperture 123/23/27 (oval length, width & angle). Right panel is for 123/69/23, which includes 3 times the area.
Total Rc = 10.04 ± 0.11
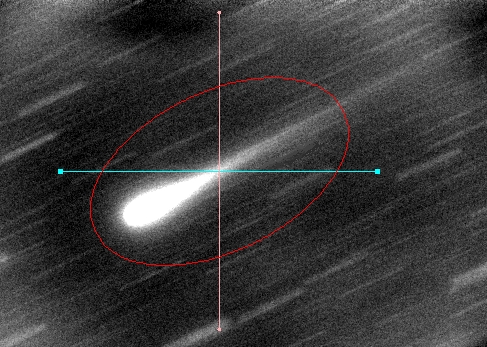
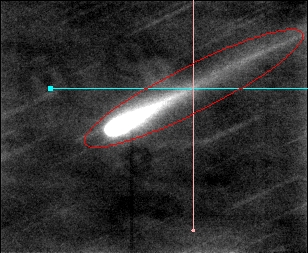
2013.10.17 Whitmer R-band Image & Mag's
Complicated conversion from observed brightness to displayed brightness for illustrating location of coma center in relation rest of coma and tail. Median combine of 6 comet-guided 90-second exposures, R filter, 14-inch Celestron, by Whitmer, on 2013.10.17. North up, east left. (The other images had a background star interfering & couldn't be used.)
Rc-band magnitude versus photometry aperture diameter at comet's distance for Whitmer Oct 17 data.
For coma diameter of ~ 60,000 km Rc = 12.88.
Determining total flux using APT's oval photometry aperture 200/45/28 (oval length, width & angle). Right panel is for 200/135/28, which includes 3 times the area.
The elliptical aperture program (APT, Aperture Photometry Tool) reports total counts within an aperture. After creating an aperture that fits the comet a reading is made, but it contains background counts and we want to know how many counts can be attributed to the comet. By simply increasing the size of the oval aperture (without changing the center location) it is possible to infer a background total counts that must be subtracted from the counts in the original aperture (tailored to fit the comet). In the above example I tripled the oval width, causing the background counts to increase by a factor 2. By assuming that the background counts is the same for both readings it is possible to determine the background contribution for any aperture size using the following equation: BackgroundCountsImage1 = (TotalCountsImage2 - TotalCountsImage1) / (N -1), where N = ratio of areas (N=3 for this example). In other words, if the width is doubled N = 2, and the difference of total counts is equal to the background in the first image. Or, if the width is tripled then the difference of total counts is twice the background counts in the first image. I want to thank Tom Kaye for suggesting this clever trick! (This is one example illustrating why we get together for dinner every Wednesday night.)
The comet's total Rc-mag = 10.469 ± 0.009 (formal statistical SE; 0.02 might be a better estimate).
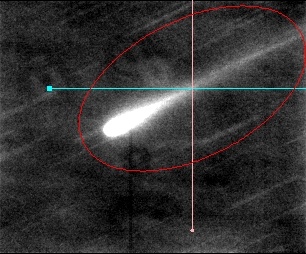
2013.10.16. Whitmer R-band Image & Magnitudes
Complicated conversion from observed brightness to displayed brightness for illustrating location of coma center in relation rest of coma and tail. Median combine of 60 comet-guided 90-second exposures, R filter, 14-inch Celestron, by Whitmer, on 2013.10.16. North up, east left. This cropped image has FOV = 14.7 x 9.9 'arc.
Determining total flux using APT's oval photometry aperture (200/45/26).
Total Rc-mag = 10.50 ± 0.03.
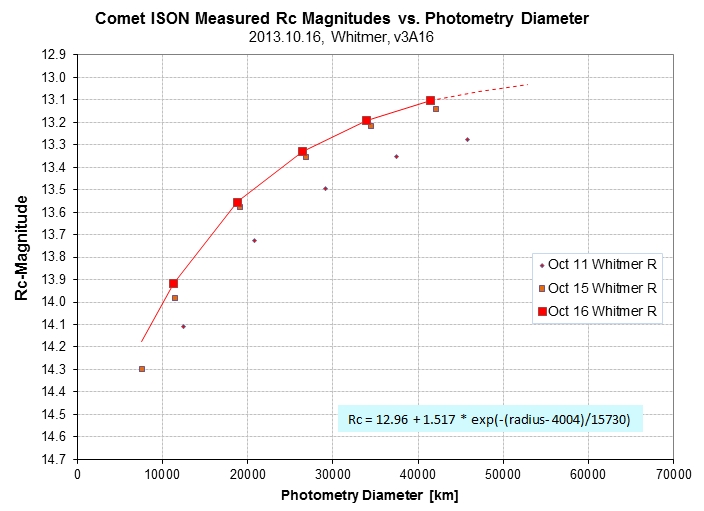
Rc-band magnitude versus photometry aperture diameter at comet's distance for Whitmer Oct 16 data.
For coma diameter of ~ 60,000 km Rc = 13.10.
2013.10.15 Whitmer R-band Image & Magnitudes
Complicated conversion from observed brightness to displayed brightness for illustrating location of coma center in relation rest of coma and tail. Median combine of 50 comet-guided 90-second exposures, R filter, 14-inch Celestron, by Whitmer, on 2013.10.15. North up, east left. This cropped image has FOV = 8.4 x 7.4 'arc.
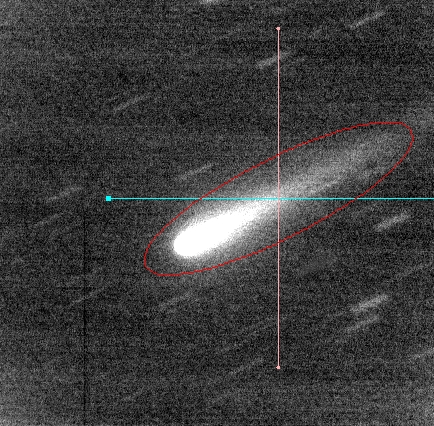
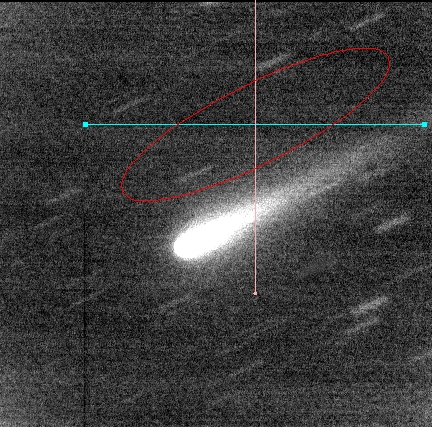
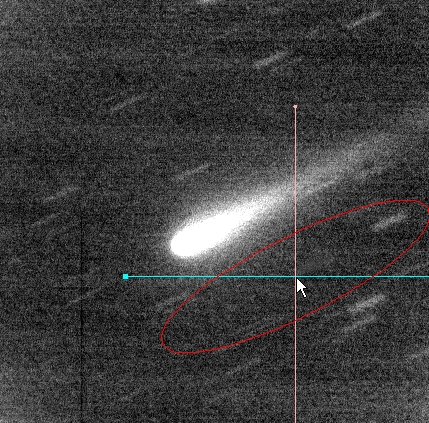
Illustration of my method for measuring comet's total flux. (Don't worry about some residual star streaks within the reference positions; they contribute a negligible amount to the "counts included" values. A complete description of procedure will be given in a link later.)
Total Rc-mag = 10.75 ± 0.02. Reduced Total Rc-mag (rtRc) = 9.58 ± 0.02.
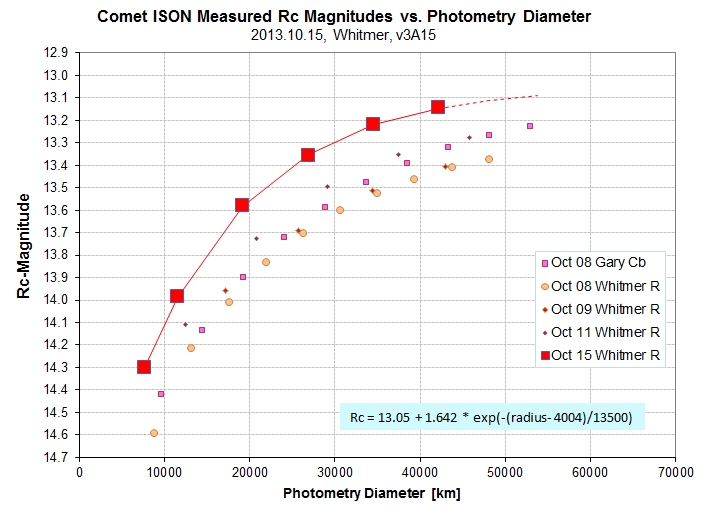
Rc-band magnitude versus photometry aperture diameter at comet's distance for Whitmer Oct 15 data.
For coma diameter of ~ 60,000 km Rc = 13.09.
2013.10.12 Whitmer R-band Image & Magnitudes
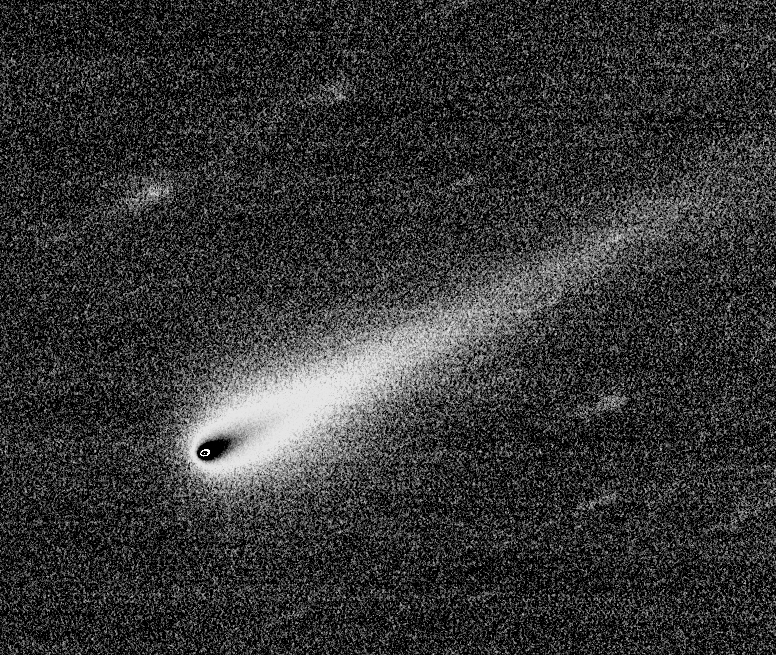
Complicated conversion from observed brightness to displayed brightness for illustrating location of coma center in relation rest of coma and tail. Median combine of the sharpest 15 of 60 90-second exposures, R filter, 14-inch Celestron, by Whitmer, on 2013.10.12. North up, east left. This cropped image has FOV = 10.0 x 8.4 'arc.
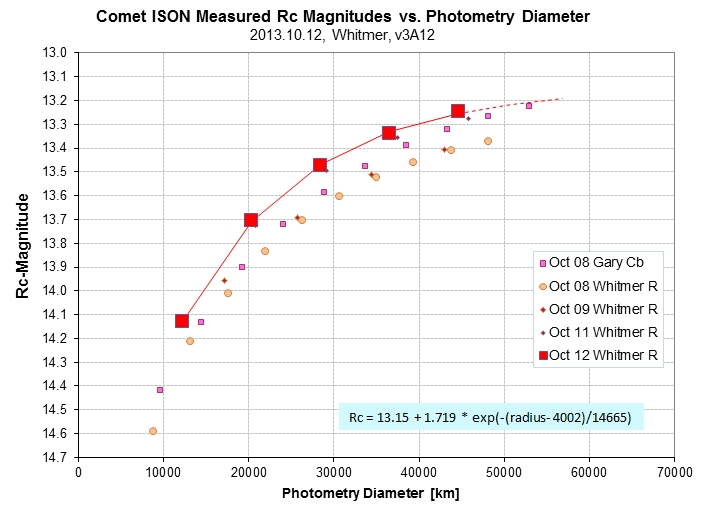
Rc-band magnitude versus photometry aperture diameter at comet's distance for Whitmer Oct 12 data.
The 60,000 km diameter coma has Rc = 13.19. Total Rc = 10.74 ± 0.03. Reduced total Rc-mag = 9.976 (magnitude as viewed from 1 a.u.).
2013.10.11 Whitmer R-band Image Magnitudes
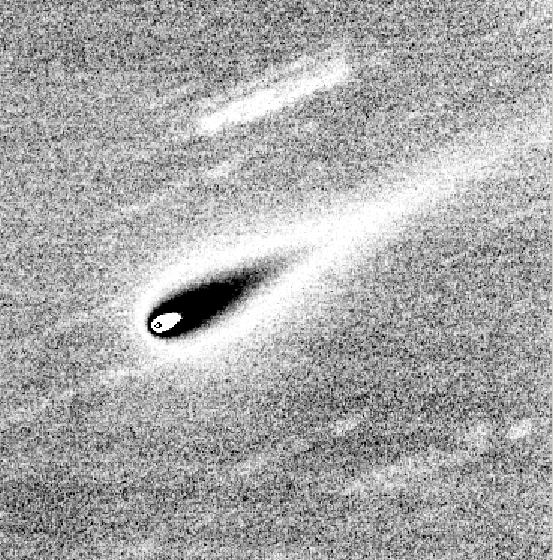
Complicated conversion from observed brightness to displayed brightness for illustrating location of coma center in relation rest of coma and tail. Median combine of the sharpest 34 of 50 90-second exposures, R filter, 14-inch Celestron, by Whitmer, on 2013.10.11. North up, east left. This cropped image has FOV = 9.0 x 9.1 'arc.
Total Rc-mag = 10.95 ("reduced" Rc = 10.15).
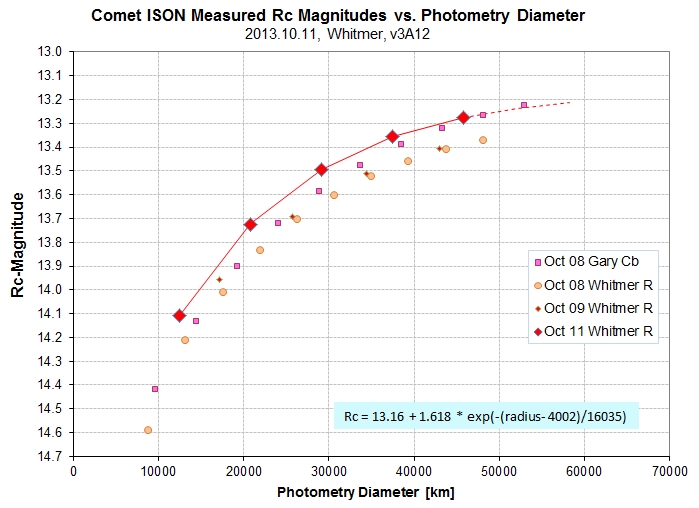
Rc-band magnitude versus photometry aperture diameter at comet's distance for Whitmer Oct 11 data.
The 60,000 km diameter coma has Rc = 13.20 (total Rc = 10.95).
2013.10.09 Whitmer R-band Magnitude Analysis
Whitmer took B- and R-band images during winds that degraded seeing. Only 10 of the R-band images has been processed.
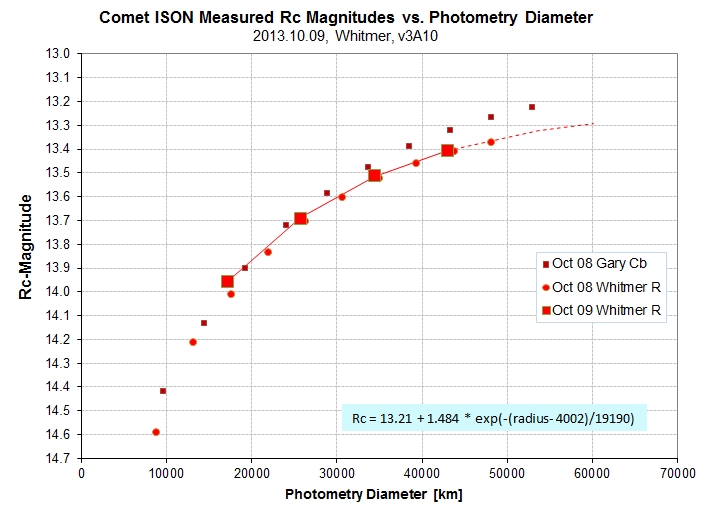
Rc-band magnitude versus photometry aperture diameter at comet's distance for Whitmer Oct 09 data.
Rc = 13.30 for 60,000 km coma diameter. Total Rc = 10.83 ± 0.04. Reduced Rc = 9.97 (magnitude as viewed from 1 a.u.)
2013.10.08 Whitmer R-band Image & Magnitude Analysis
On this date Dennis Whitmer took 50 90-second images with his 14-inch telescope. The sharpest 27 were used to create the following stacked image.
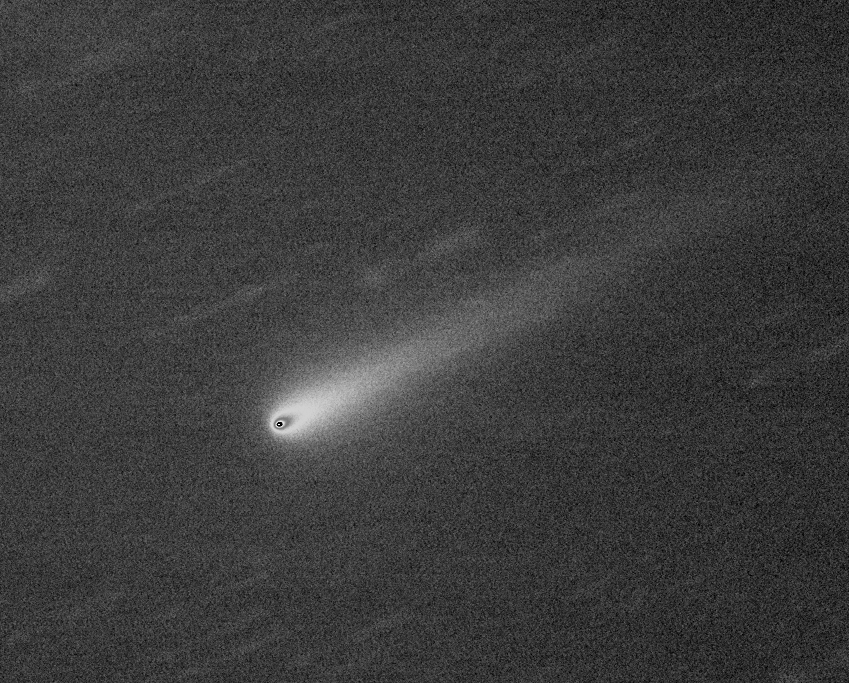
Complicated conversion from observed brightness to displayed brightness for illustrating location of coma center in relation rest of coma and tail. Median combine of the sharpest 27 of 50 90-second exposures, R filter, 14-inch Celestron, by Whitmer, on 2013.10.08. North up, east left. This cropped image has FOV = 11.0 x 8.9 'arc.
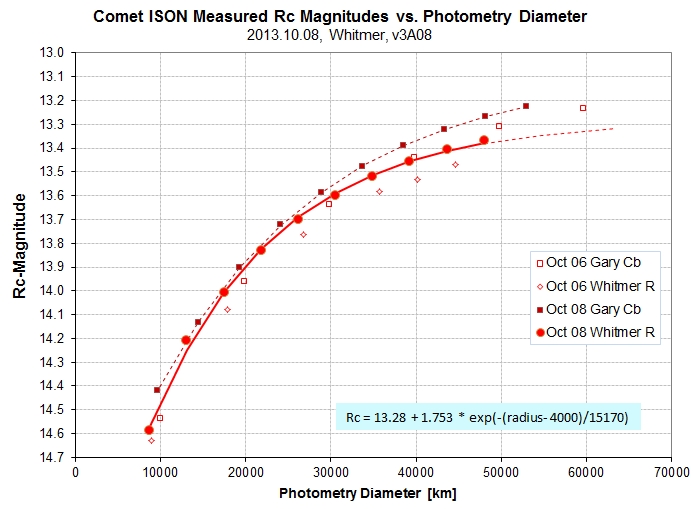
Rc-band magnitude versus photometry aperture diameter at comet's distance for Whitmer Oct 08 data.
A pattern is developing in which the Gary and Whitmer Rc(ComaDiameterIncluded) agree for the inner coma, but separate in the outer coma. This might be related to the fact that Whitmer uses a R-band filter whereas Gary uses a Cb filter (clear with blue blocking). If the color of the coma and tail are different then since the "photometry signal circle" includes more of the tail for large apertures we should expect difference in Rc readings to differ for the larger apertures - and that's what we see. If this explanation is correct, then the fact that these differences are growing with date implies that the colors of the coma and tail are differing by greater amounts with date.
Rc = 13.32 at 60,000 km diameter.
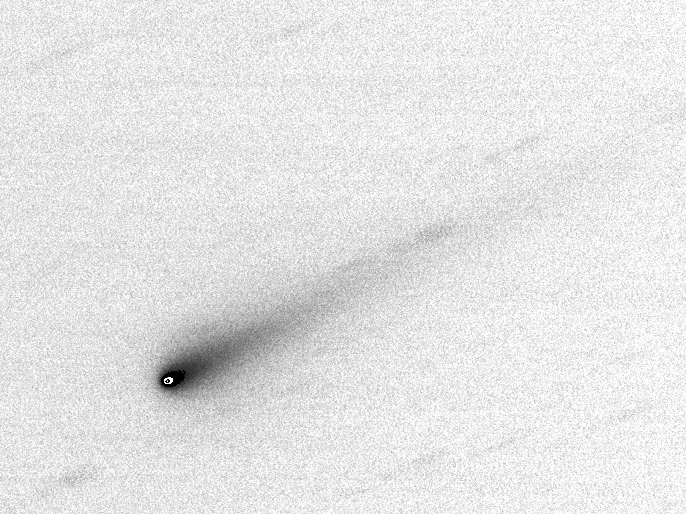
2013.10.08 Gary Cb-band Image & Magnitude Analysis
On this date Gary took 95 30-second images with his 11-inch telescope. The sharpest 41 were used to create the following stacked image.
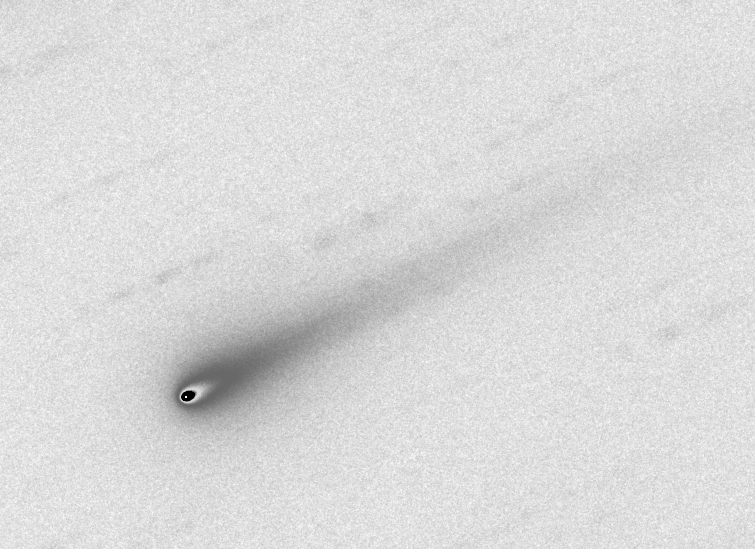
Complicated conversion from observed brightness to displayed brightness for illustrating location of coma center in relation rest of coma and tail. Median combine of the sharpest 41 of 95 30-second exposures, Cb filter, 11-inch Celestron, by Gary, on 2013.10.08. North up, east left. The tail can be seen out to 6.2 'arc from the nucleus. (The sun-target-observer angle is 31 deg.) This cropped image has FOV = 10.8 x 7.9 'arc.
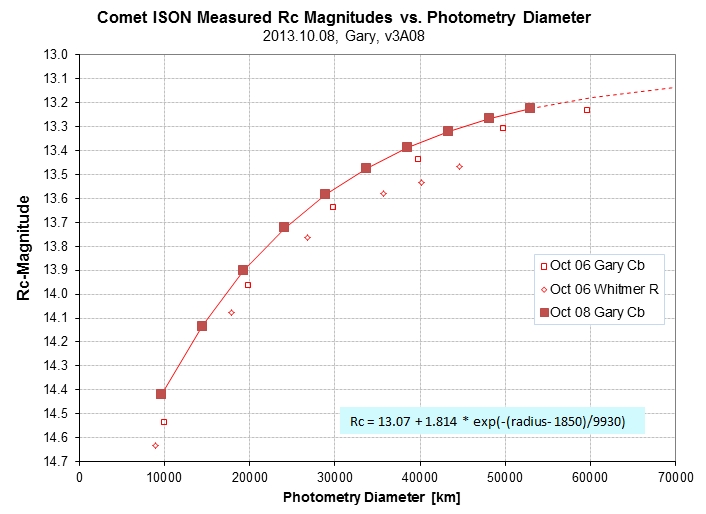
Rc-band magnitude versus photometry aperture diameter at comet's distance.
The Rc-mag at 60,000 km diameter is 13.18 (extrapolating beyond this diameter is risky).
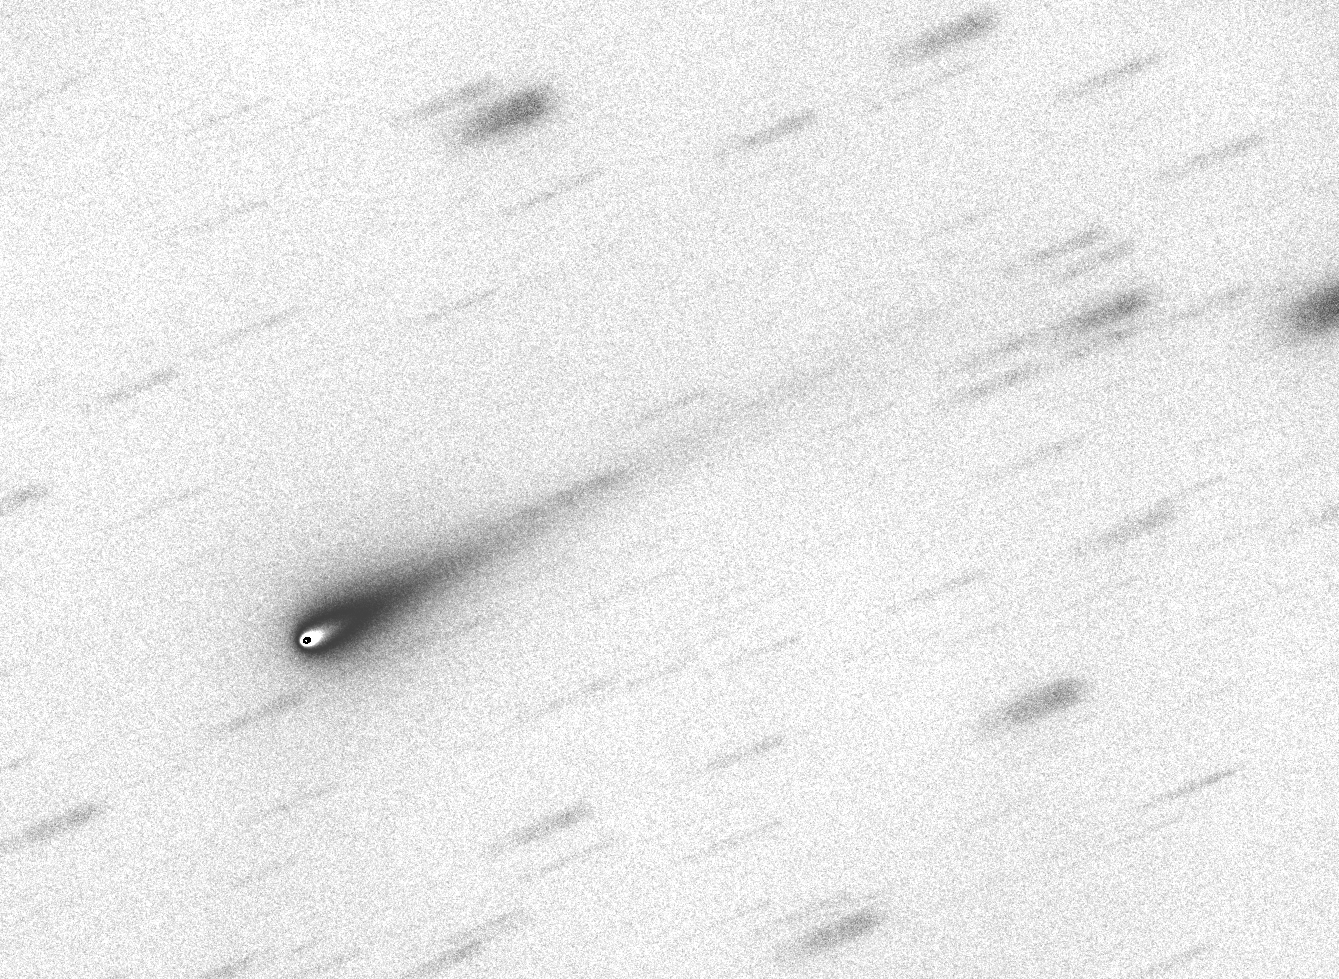
2013.10.06 Whitmer R-band Image & Magnitude Analysis
On this date Dennis Whitmer took 50 90-second images with his 14-inch telescope. The sharpest 20 were used to create the following stacked image.
Complicated conversion from observed brightness to displayed brightness for illustrating location of coma center in relation rest of coma and tail. Median combine of the sharpest 20 of 50 90-second exposures, R filter, 14-inch Celestron, by Whitmer, on 2013.10.06. North up, east left. This cropped image has FOV = 8.8 x 6.6 'arc.
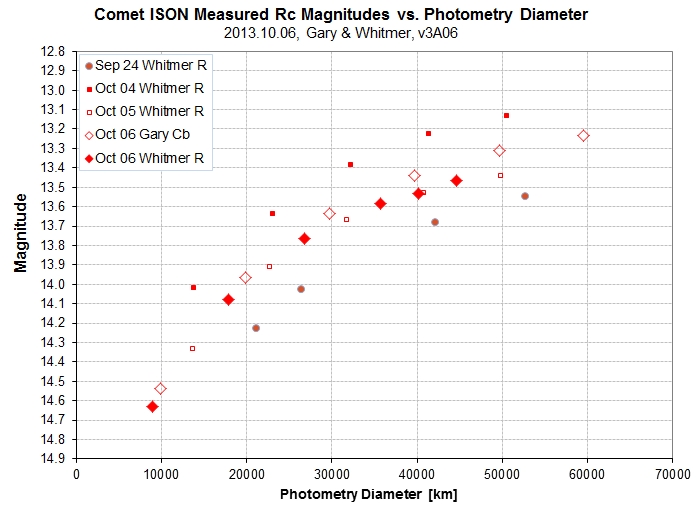
Rc-band magnitude versus photometry aperture diameter at comet's distance.
Extrapolating to an aperture corresponding to 70,000 km yields Rc = 13.35. I don't know why the Gary & Whitmer data begin to diverge beyond an aperture of 30,000 km. The extrapolated values at 70,000 km differ by 0.15 mag, which so far is the greatest discrepancy between simultaneous Rc-magnitudes by these two observers.
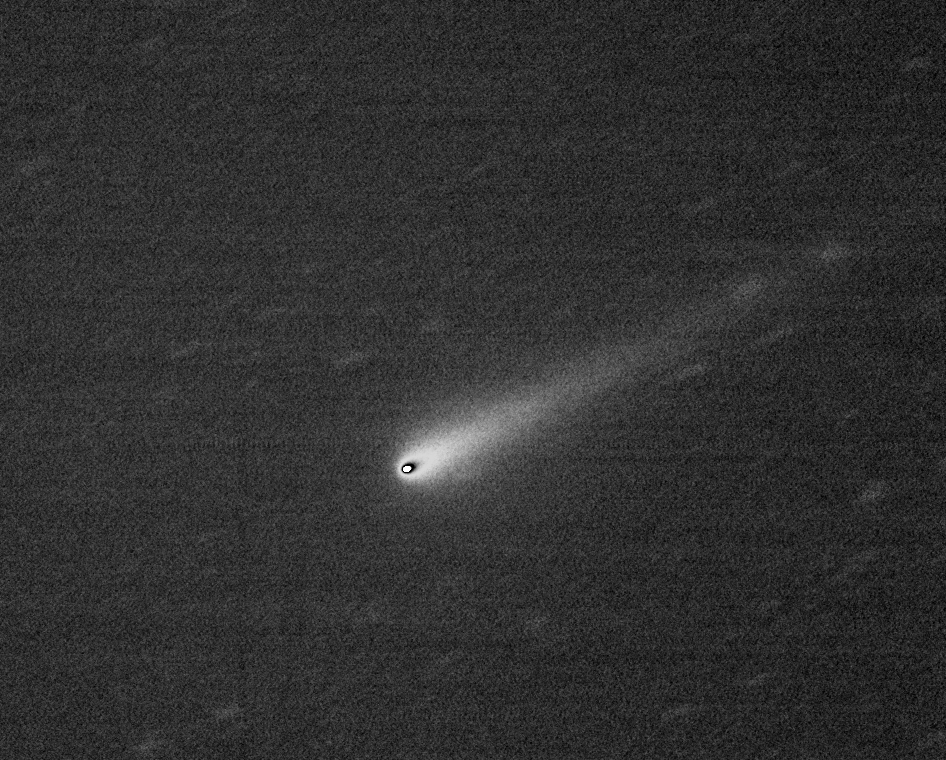
2013.10.06 Gary Cb-band Image & Magnitude Analysis
On this date I took 117 20-second images with my 11-inch telescope. The sharpest 17 were used to create the following stacked image.
Complicated conversion from observed brightness to displayed brightness for illustrating location of coma center in relation rest of coma and tail. Median combine of the sharpest 51 of 117 20-second exposures, Cb filter, 11-inch Celestron, by Gary, on 2013.10.06. North up, east left. This cropped image has FOV = 19.2 x 14.0 'arc.
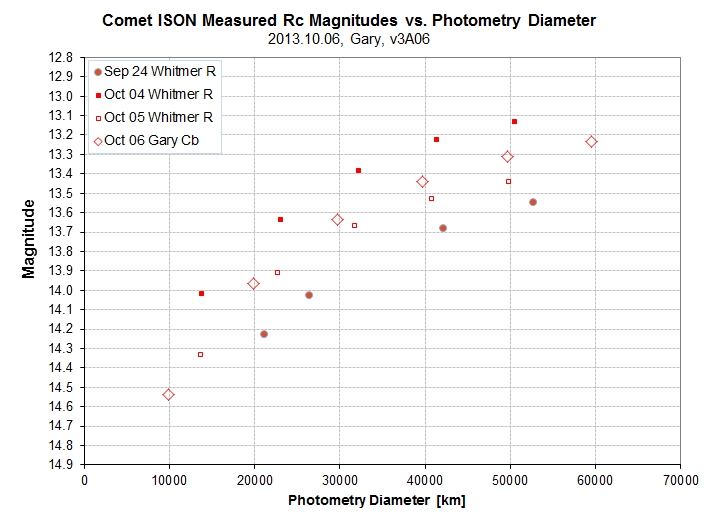
Rc-band magnitude versus photometry aperture at comet's distance.
Extrapolating to an aperture corresponding to 70,000 km yields Rc = 13.20.
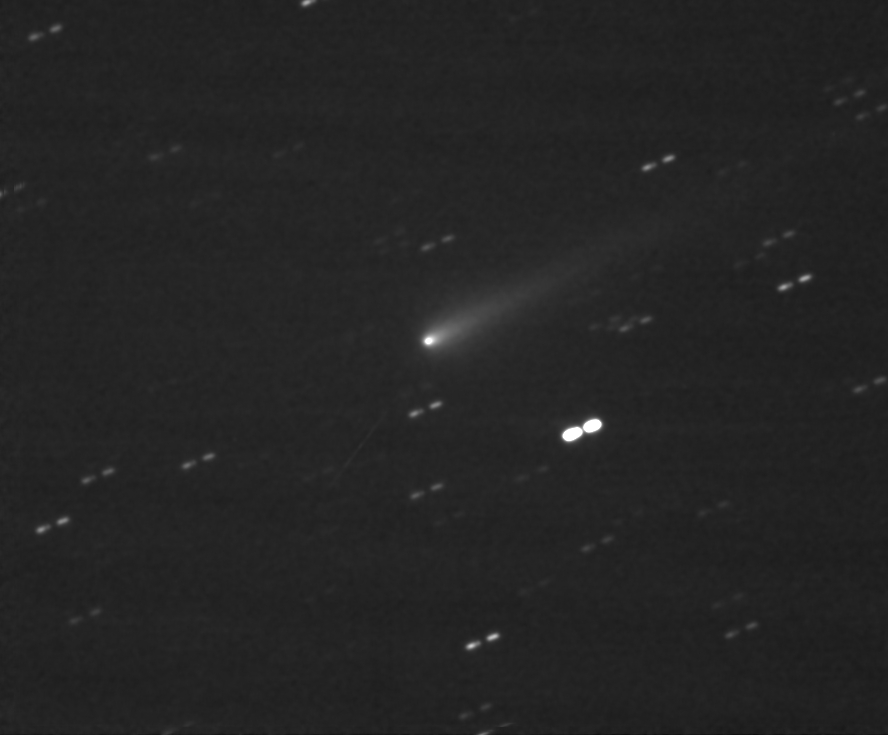
2013.10.05 Whitmer R-band Image & Magnitude Analysis
On this date Dennis Whitmer took 50 90-second images with his 14-inch telescope. The sharpest 20 were used to create the following stacked image.
Complicated conversion from observed brightness to displayed brightness for illustrating location of coma center in relation rest of coma and tail. Median combine of the sharpest 20 of 50 90-second exposures, R filter, 14-inch Celestron, by Dennis Whitmer on 2013.10.05. North up, east left. This cropped image has FOV = 12.2 x 9.8 'arc.
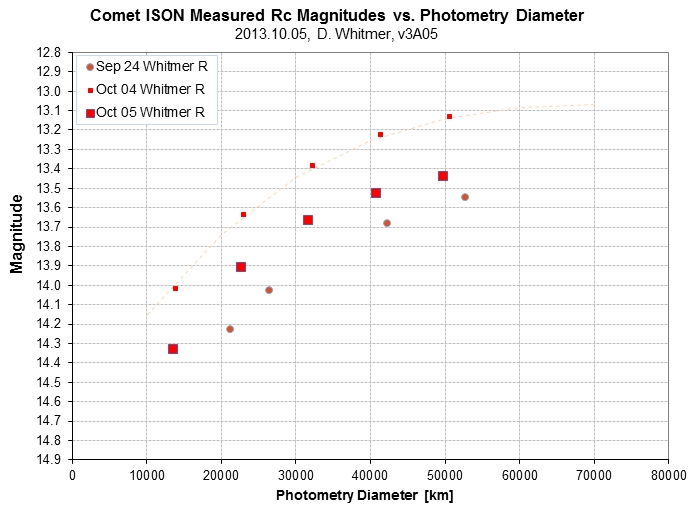
Rc-band magnitude versus photometry aperture at comet's distance.
Notice that the comet has faded 0.29 ± 0.05 mag's during the past 24 hours. I estimate an extrapolated R-mag for 70,000 km diameter of 13.39 ± 0.02. The 9 reference stars had low scatter, as did the photometry of images, indicating a SEs that ranged from 0.01 to 0.02 mag for the data plotted above. The 0.29 mag fade is therefore real.
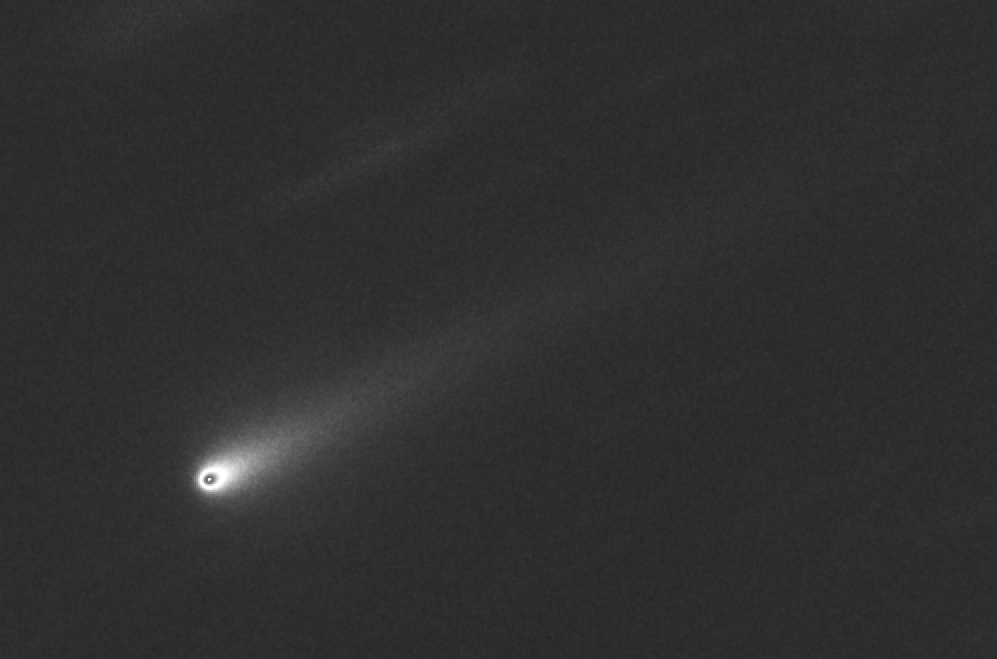
2013.10.04 Whitmer R-band Image & Magnitude Analysis
On this date Dennis Whitmer took 60 90-second images with his 14-inch telescope. The sharpest 10 were used to create the following stacked image.
Average of 10 sharpest images of Oct 4 by Dennis Whitmer with a 14-inch telescope.
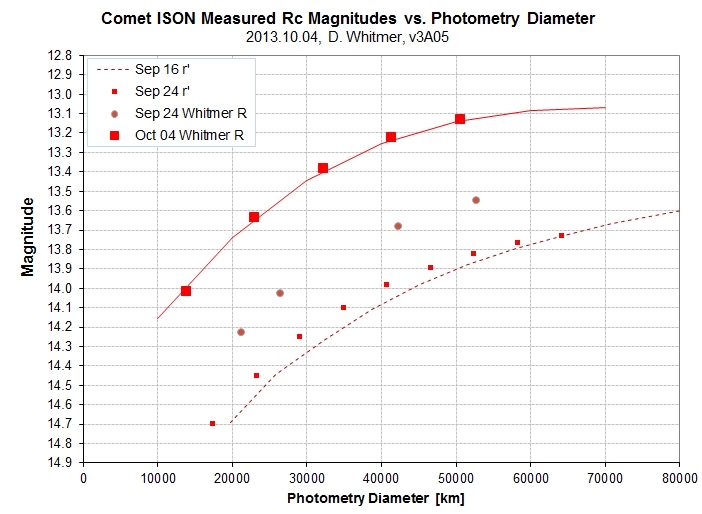
Rc-band magnitude versus photometry aperture at comet's distance.
For a reference coma diameter of 70,000 km the Rc-band magnitude is 13.07.
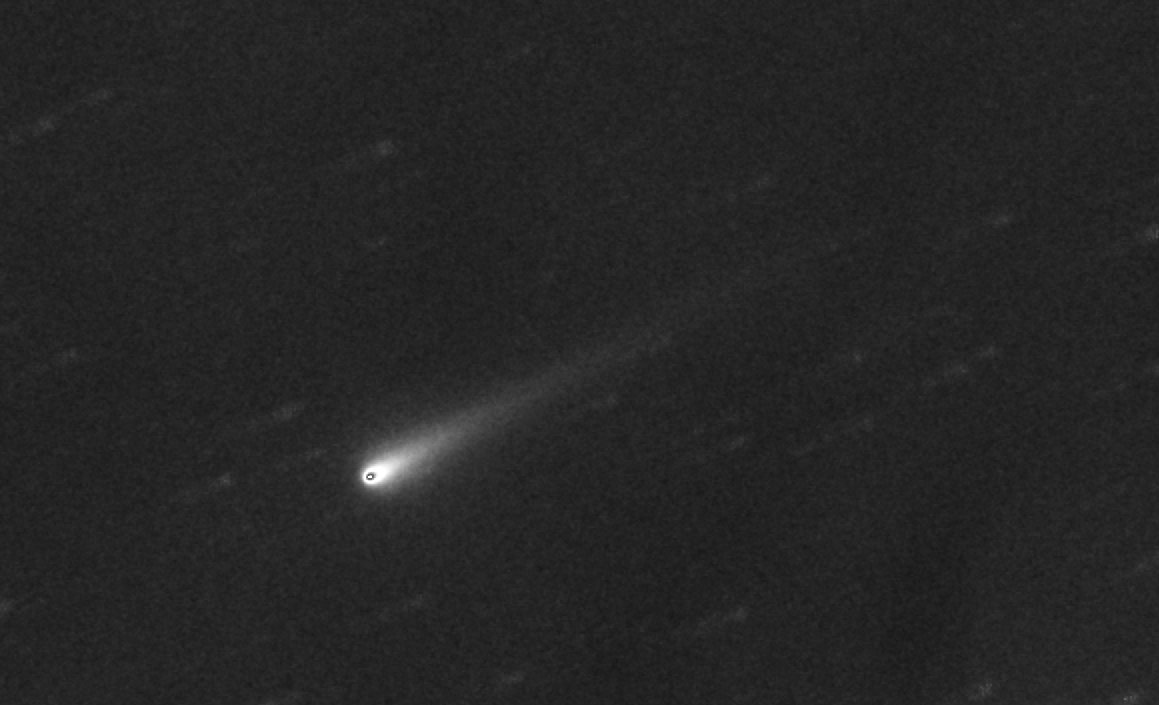
2013.10.01 Gary Cb-Filter Image & Magnitude Analysis
On this date I took 146 Cb images during a 1.5-hour interval (10:59 to 12:29 UT) using a Celestron CPC 1100 telescope and SBIG ST-10XME CCD.
Complicated conversion from observed brightness to displayed brightness for illustrating location of coma center in relation rest of coma and tail. Median combine of the sharpest 64 of 146 30-second exposures, Cb-filter (clear with blue blocking), 11-inch Celestron, 2013.10.01. North up, east left. This cropped image has FOV = 7.2 x 4.8 'arc.
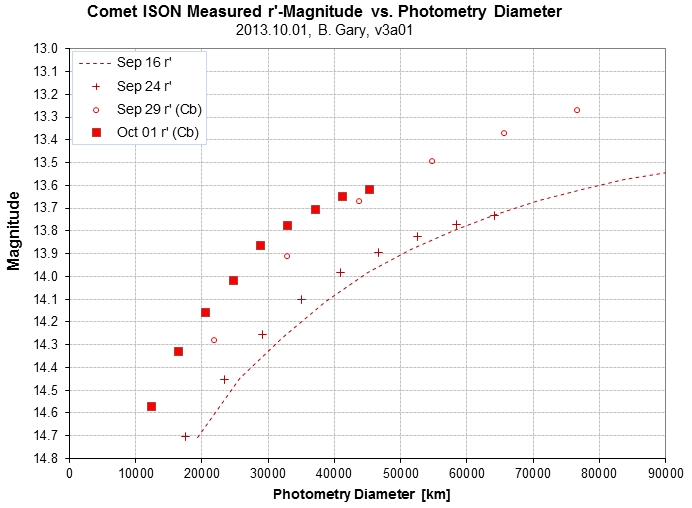
r'-band (Gary) magnitudes versus amount of coma included in photometry aperture, for Oct 01, based on Cb-filter observations. Symbols for earlier dates show that on Oct 01 the outer coma appears to be eroded compared with the previous measurement on Sep 29. 18 stars with APASS r'mag's were used to establish calibration and a typical SE uncertainty is 0.008 mag; RMS differences about a r-mag/star color fit were typically 24 mmag (varied with photometry aperture), implying that the calibration was uncertain by at least 6 mmag due to this scatter.
The coma appears slightly smaller than on Sep 29, though the case for this is weak.
Extrapolating the mag vs. aperture trend to a coma diameter of 70,000 km yields r'-mag = 13.50 ± 0.05. Converting to Rc yields Rc-mag = 13.30 ± 0.05.
2013.09.29 Gary Cb-Filter, r'-Magnitude
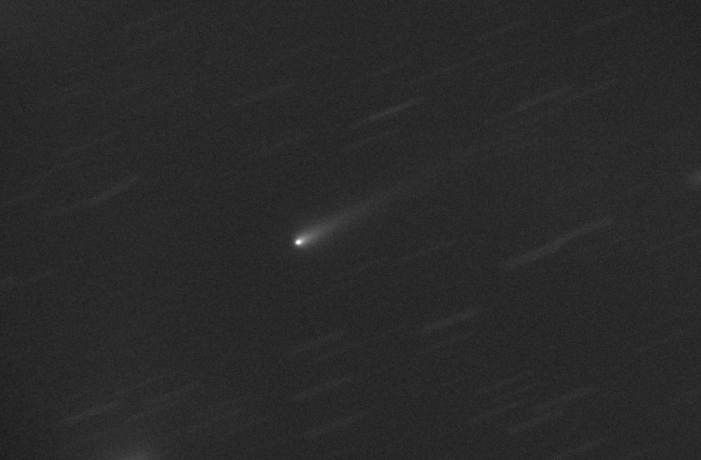
On this date I took 162 Cb images and 40 r' images during a 1.6-hour interval (10:44 to 12:20 UT) using a Celestron CPC 1100 telescope and SBIG ST-10XME CCD. So far only the Cb image set has been processed.
Complicated conversion from observed brightness to displayed brightness for illustrating location of coma center in relation rest of coma and tail. Median combine of the sharpest 45 of 162 15-second exposures, Cb-filter (clear with blue blocking), 11-inch Celestron, 2013.09.29. North up, east left. This cropped image has FOV = 16.7 x 10.2 'arc. The tail is 5.0 'arc long in this image.
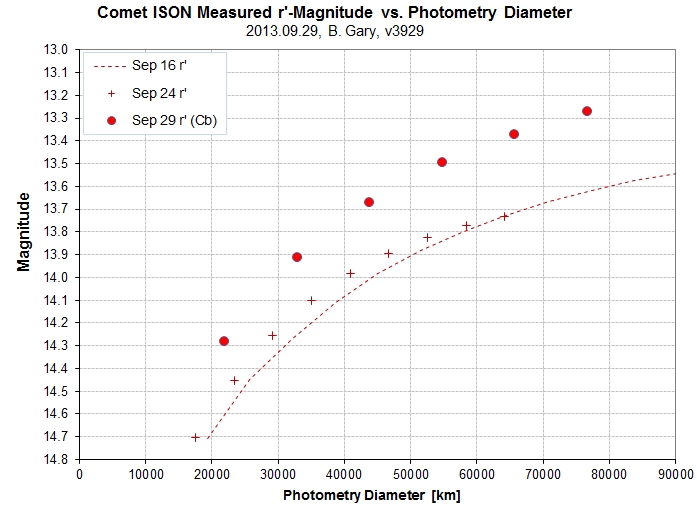
r'-band (Gary) magnitudes versus amount of coma included in photometry aperture, for Sep 29. Symbols for Sep 24 and a trace for Sep 16 are shown. 16 stars with APASS r'mag's were used to establish calibration; RMS differences about a r-mag/star color fit were typically 15 mmag (varied with photometry aperture), implying that the calibration was uncertain by ~ 5 mmag due to this scatter.
The 70,000 km diameter r'-mag = 13.32, which corresponds to Rc-mag ~ 13.12.
The size of the coma appears to have increased since Sep 24, and might actually be slightly lasrger than on Sep 16. If a stronger than usual solar wind on Sep 24 eroded the coma (and moved dust to the tail), then a return of the solar wind to a more typical value could explain the return of the coma size to a more typical value.
2013.09.24 Whitmer Rc Magnitude
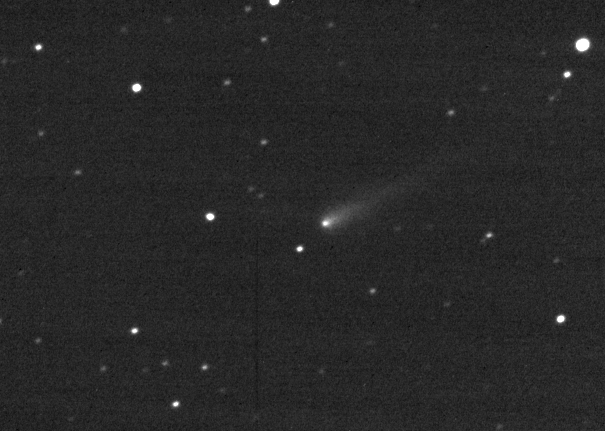
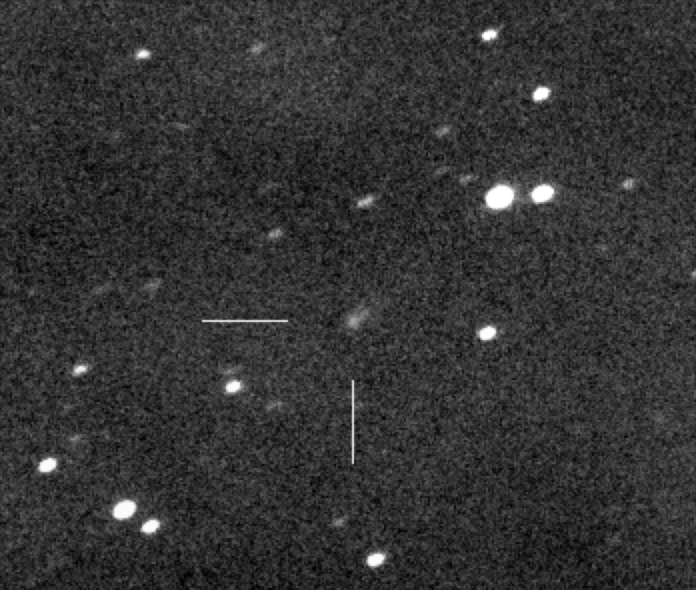
Animation with 3 3-minute exposures, Rc-band, by D. Whitmer. Note the asteroid (left edge) moving in the same direction as the comet. Alex Amorim states that it is "433 Eros," at V-mag 13.6.
The moving asteroid is also present in my 50-image sequence.
Rc-band (Whitmer) and g', r' and i' band (Gary) magnitudes versus amount of coma included in photometry aperture, for Sep 24. Traces for Sep 16 are shown.
Rc-mag ~ 13.45 at ~ 70,000 km diameter. This compares well with Rc-mag ~ 13.50 derived from my r'-mag = 13.70 (from simultaneous observations from observatories ~ 2 miles apart). The agreement can also be seen in the "Comet ISON Magnitude vs. Date" figure at the top of this web page.
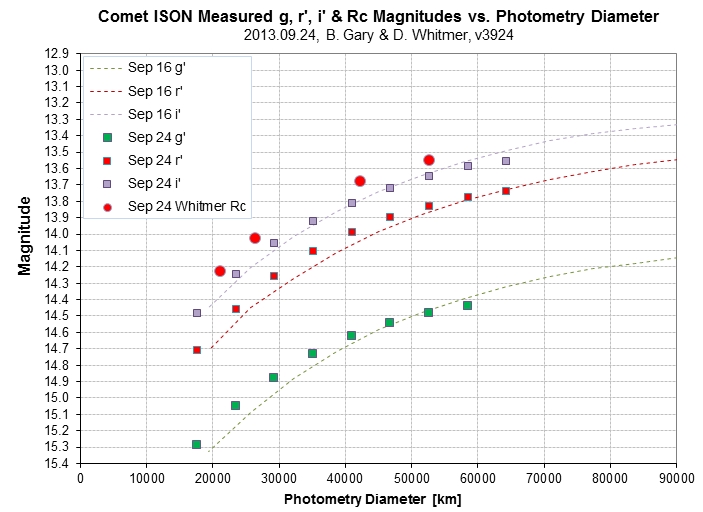
2013.09.24 Gary g'r'i' Magnitudes
Median combine of 51 20-second images, r'-band, unbinned.
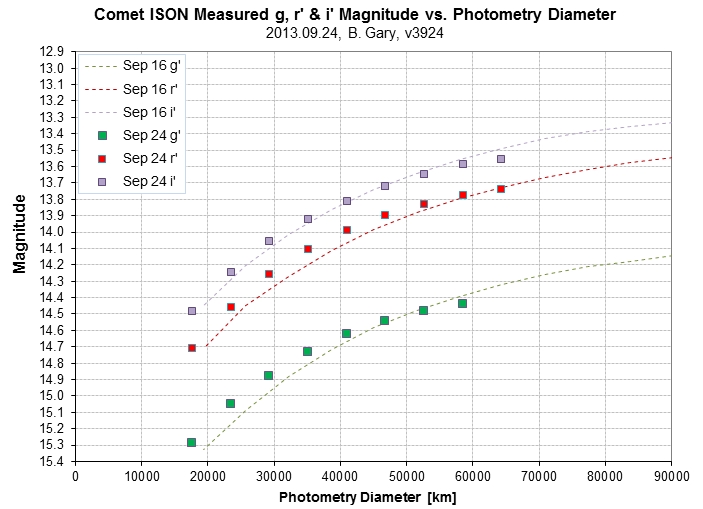
g', r' and i' magnitudes versus amount of coma included in photometry aperture, for Sep 24 (Gary data); traces for Sep 16 are shown.
The above plot shows r'-mag ~ 13.70 at ~ 70,000 km diameter; this corresponds to Rc-mag ~ 13.50. There is essentially no brightness change during the past 8 days (when it should have brightened 0.26 mag). It also shows a smaller (more compact) coma. The inner part of the coma is slightly brighter (~ 0.1 mag) but the outer part is fainter. Maybe more of the coma is being ejected into the tail due to a stronger solar wind. This is consistent with the total coma brightness being less than expected.
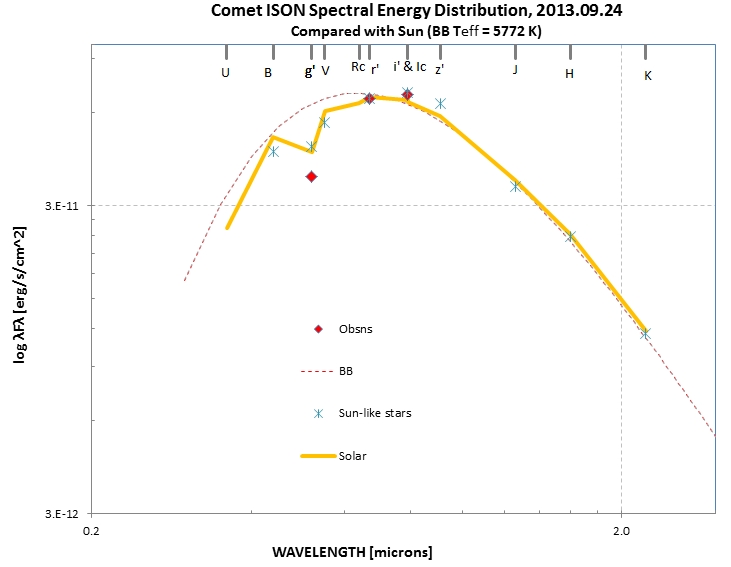
SED for September 24.
The coma particles have an albedo that is low at g'-band (where most molecular emission lines occur).
2013.09.23 Whitmer Rc Magnitudes
Rc-band, unbinned, median combine of four 90-second exposures by Dennis Whitmer, 2013 Sep 23.
Whitmer has many more images but I only used 4 for the following analysis.
Rc-mag's on Sep 23 are ~ 0.6 mag brighter than on Sep 19 (vs. 0.13 mag expected).
Measuring flux using APT (80/30/29).
Total Rc-mag (tRc) = 11.93 ± 0.03.
2013.09.19 Whitmer Rc Magnitudes
Median combine of 4 60-sec images (comet-aligned).
Rc-mag's on Sep 19 are same as on Sep 15.
Oval aperture using APT.
Total Rc = 12.19 ± 0.03. Reduced Total Rc = 10.12.
2013.09.16 Gary g'r'i' Magnitudes
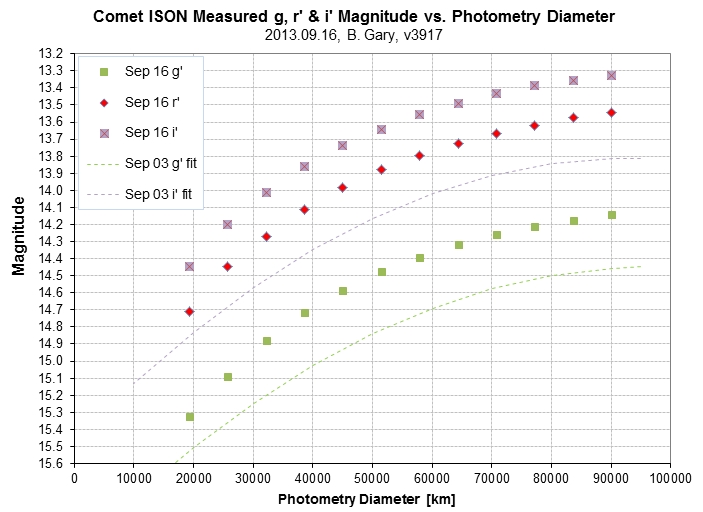
g', r' and i' magnitudes versus amount of coma included in photometry aperture, for Sep 16 (Gary data); traces of previous date's fit for g' & i' are shown.
From Sep 03 to Sep 16 at g'-band the 80,000 km diameter coma brightened by 0.30 magnitude (vs. the predicted 0.37 mag). At i'-band brightness increased 0.48 magnitude (slightly more than predicted). In other words, the broadband brightness of the comet increased essentially the same amount as predicted by a simple model that takes into account the comet's proximity to the sun and Earth. So there is no brightening due to water ice warming and changing to vapor, causing ejection of dust to the coma (e.g., crossing the "frost line").
Magnitudes for this date, for a coma diameter of 80,000 km:
g' = 14.20 ± 0.02
r' = 13.60 ± 0.02
i' = 13.38 ± 0.02
Converting r' to Rc:
Rc = 13.40 ± 0.03 (80,000 km diameter coma)
which uses the following conversion equations (derived from 9 solar-like stars with accurate Rc & r' magnitudes):
Rc = r' - 0.205, SEi = 0.011
What's the broadband "spectral energy distribution" (SED)?
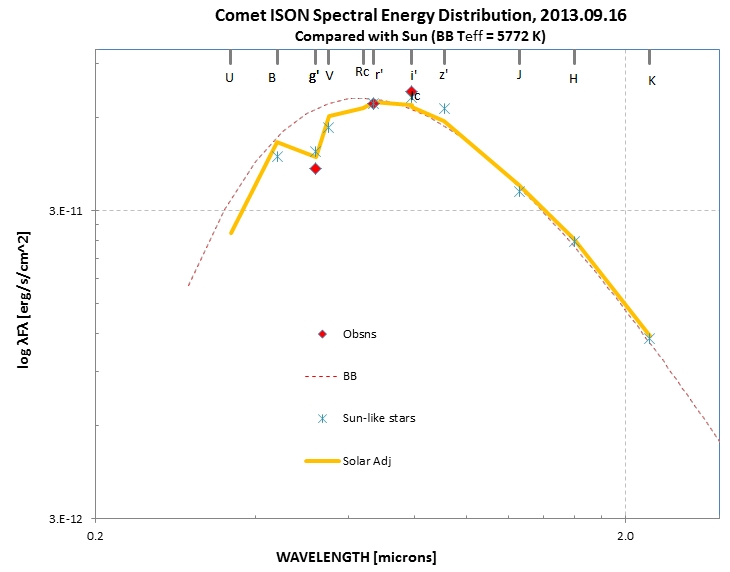
Comet's spectral energy distribution (SED) for g', r' and i' bands compared with the SED for the sun and sun-like stars. Data of September 16 (using a coma diameter of 80,000 km). Details available from the author.
The Sep 16 coma SED is slightly redder than the SED for Sep 03. This must be due to the coma dust aerosols having an albedo that increases with wavelength. Most molecular emission lines are within g'-band, and since the observed flux in this band is lower than expected under a constant albedo versus wavelength assumption I would say that there is no evidence for molecular emission in the Sep 16 SED.
2013.09.15 Whitmer R-Band Image Analysis
Dennis Whitmer obtained 40 useful images this morning (20 20-sec & 20 60-sec). I've used 14 of the 60-second images to create a GIF animation.
Animation using the first 14 images from the 60-second image set. 14-inch Celestron, binned 2x2.
Below is an analysis using 4 of the 60-sec images for coma's brightness versus diameter.
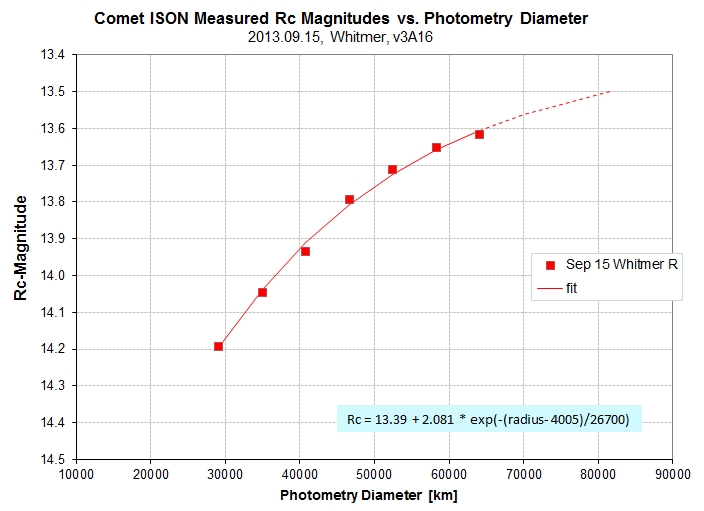
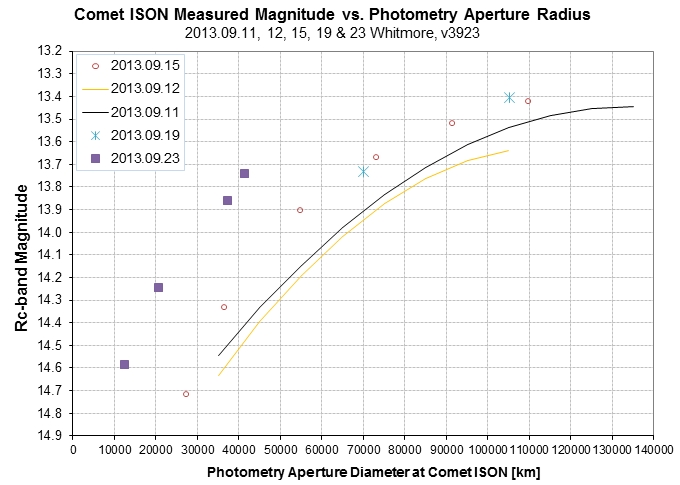
R-band brightness versus amount of coma included in photometry aperture, for Sep 15 (Whitmer data).
Rc for 70,000 km diameter coma = 13.56.
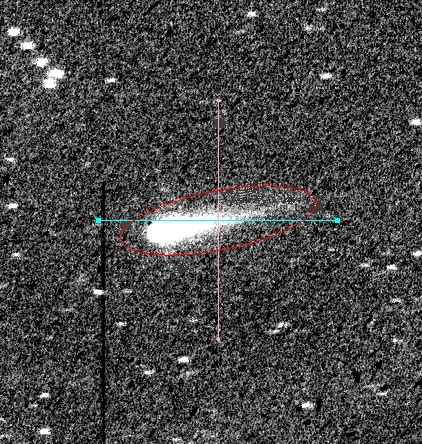
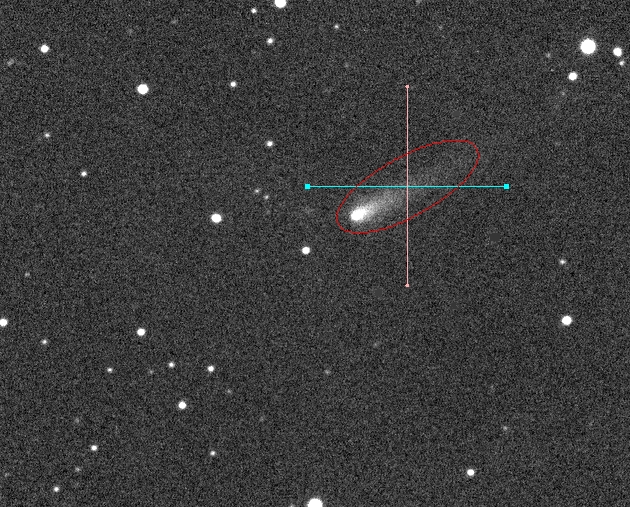
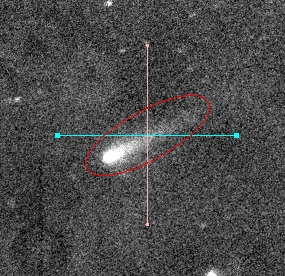
Oval aperture (using APT) for determining total magnitude.
Total Rc-mag = 12.04 ± 0.03.
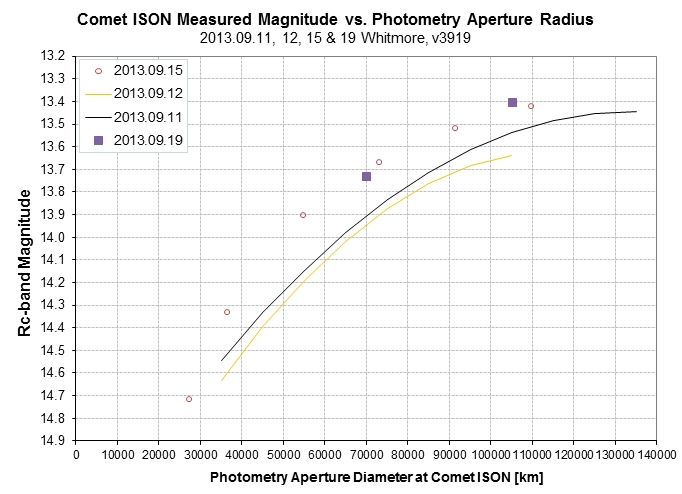
2013.09.12 Whitmer R-Band Image Analysis
Dennis Whitmer obtained 5 useful images this morning, and I analyzed the comet coma's brightness versus diameter.
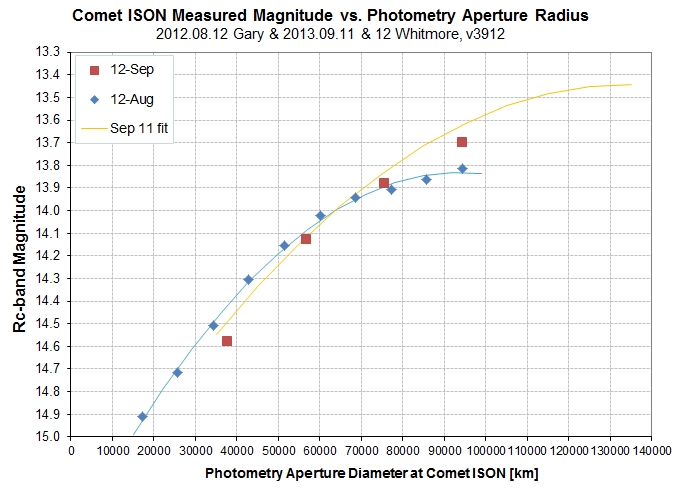
R-band brightness versus amount of coma included in photometry aperture, for Aug 12 (Gary data) and Sep 12 (Whitmer data); trace of previous date's Whitmer fit shows that there was essentially no change from Sep 11 to Sep 12.
The slight fade for Sep 12 compared with Sep 11 (of ~ 0.07 mag) isn't significant, considering that the systematic error uncertainty is estimated to be greater than this.
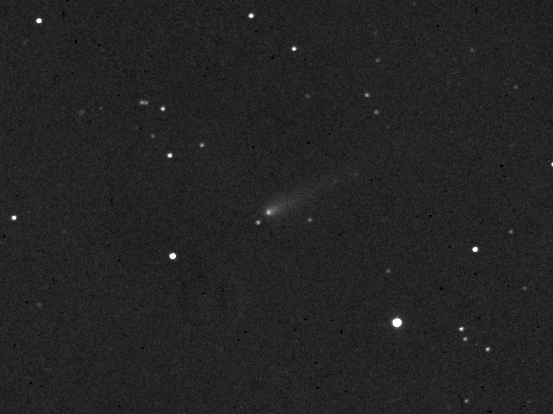
2013.09.11 Whitmer R-Band Image & Analysis
Three 4-minute exposures, comet aligned. 14-inch, star auto-guided.
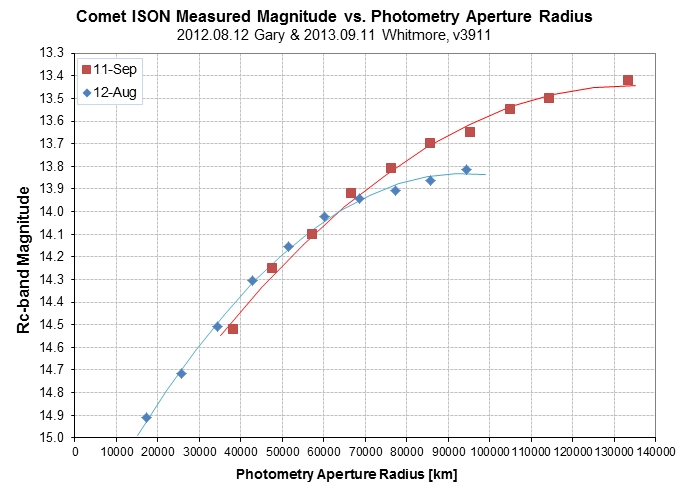
R-band brightness versus amount of coma included in photometry aperture, for Aug 12 (Gary data) and Sep 11 (Whitmer data). (The x-axis label should read "Photometry Aperture Diameter [km]")
It appears that the coma is becoming larger in physical size [km] and slightly brighter in the outer regions. Whereas the inner coma (<60,000 km diameter) should have brightened by ~ 0.92 mag it actually faded slightly. The outer coma enlarged and therefore became brighter. The overall brightness faded ~ 0.4 magnitude.
2013.09.03 g'r'i' Images
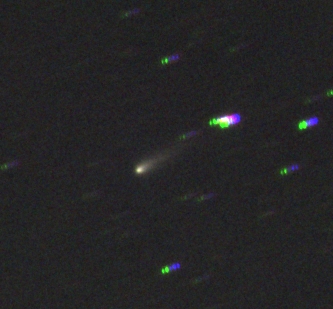
On this date I obtained ~ 75 images using filters g', r' and i' in rotation. Exposure times were all 30 seconds. The best quality images were obtained between 11:17 and 11:56 UT, when elevation ranged from 11.5 to 19.5 degrees. Here's a "not very colorful" false-color image from the best 39 images. Color balance was established using star-aligned image of a much larger FOV of stars. I used i'r'g' instead of RGB. I pixel edited out 5 stars.
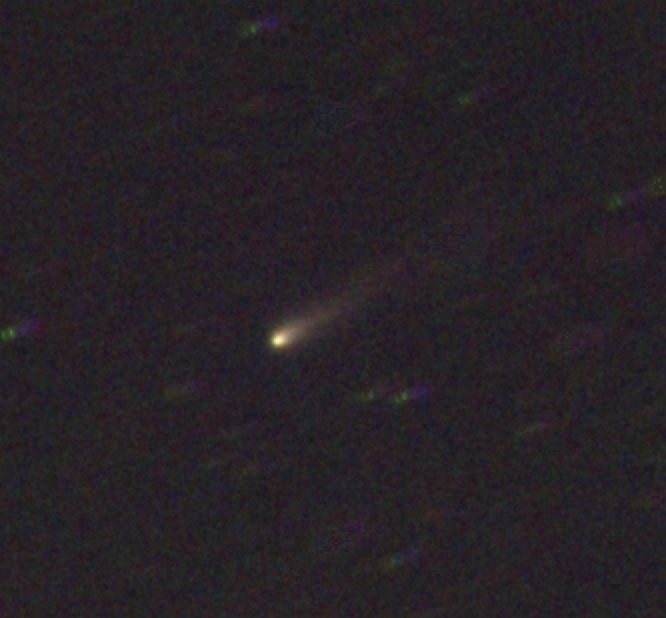
Sep 03, B. Gary, RGB-style (i'r'g') color image, comet-aligned (stars edited out). FOV = 9.6 x 8.9 'arc (north up, east left). g' = 8x30s, r' = 10x30s, i' = 21x30s.
Sep 03, B. Gary, RGB-style (i'r'g') color image (before editing out stars; 1/2 image scale).
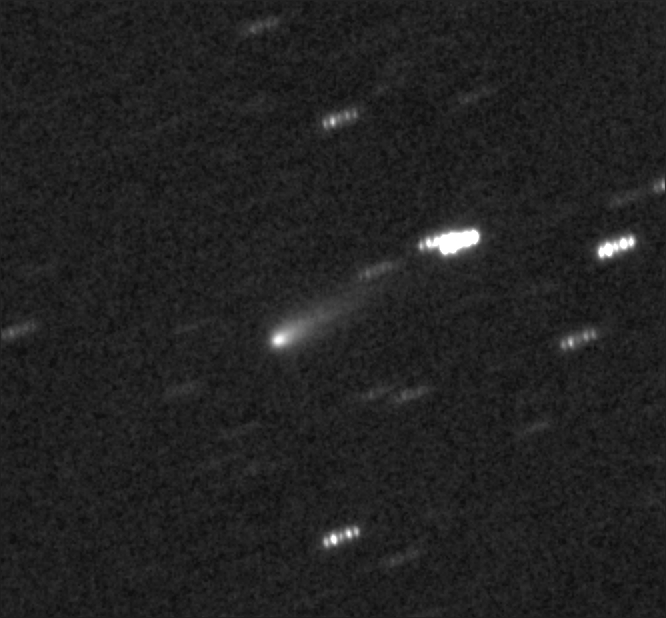
Sep 03, B. Gary, average of i'r'g' images (comet-aligned). FOV = 9.6 x 8.9 'arc (north up, east left). g' = 8x30s, r' = 10x30s, i' = 21x30s.
Magnitudes for this date:
g' = 14.46 ± 0.03 (photometry radius = 17.3 "arc (73,400 km)
r' = 13.88 ± 0.02 (photometry radius = 17.3 "arc (73,400 km)
i' = 13.90 ± 0.02 (photometry radius = 17.3 "arc (73,400 km)
Converting from g'r' to Rc & V:
Rc = 13.68 ± 0.03 (73,400 km diameter coma)
V = 14.11 ± 0.04 (73,400 km diameter coma)
which uses the following conversion equations (derived from 9 solar-like stars with accurate VRc & g'r' magnitudes):
Rc = r' - 0.205, SEi = 0.011
V = 0.56 * r' + 0.44 * g' - 0.028, SEi = 0.011
Is the comet SED compatible with the solar SED?
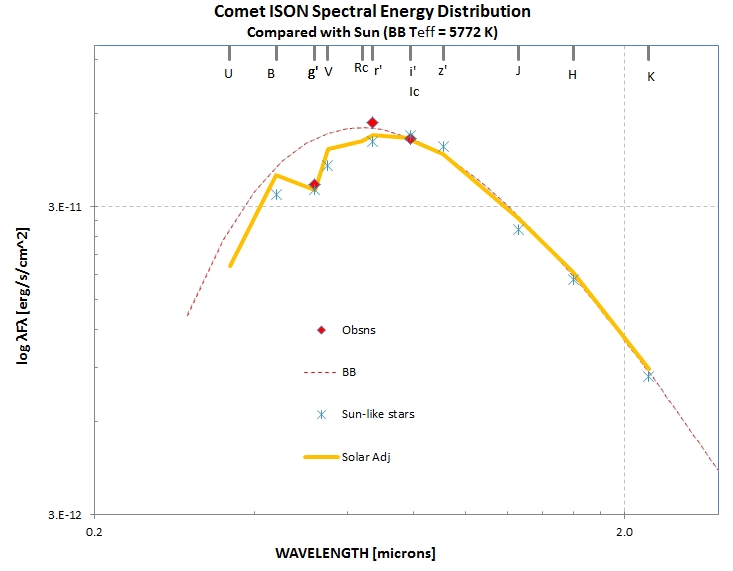
Comet's spectral energy distribution (SED) for g', r' and i' bands compared with the SED for the sun and sun-like stars. Data of September 03 (using a coma diameter of 73,400 km). Details available from the author.
Yes, all three magnitudes are internally consistent with a single albedo value and reflected sunlight. If molecular emission lines were present they would boost the g'-band brightness, leaving the r'- and i'-bands unaffected. The lack of extra brightness at g'-band can be viewed as an upper limit constraint on the amount of molecular emission (at this time).
Does coma size vary with wavelength?
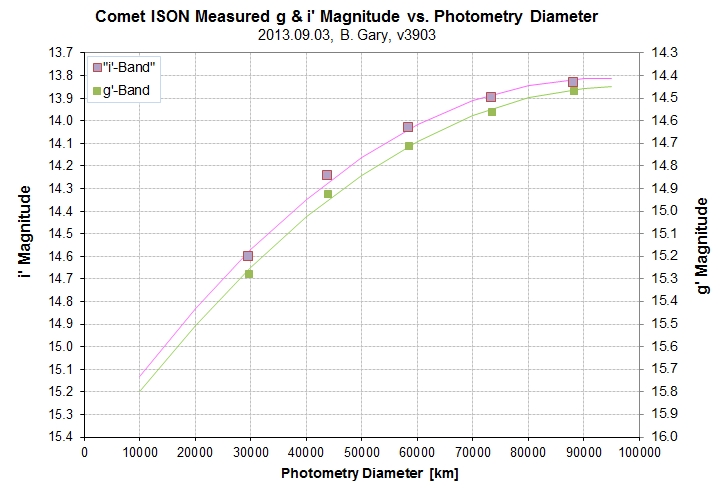
g' and i' magnitude versus photometry diameter (expressed as km within coma).
No, coma size doesn't vary with wavelength enough to be measured by my 11-inch telescope (at ~15 degrees elevation). Specifically, it appears that the coma has the same diameter in g' and i' bands. I think this rules out the idea (suggested to me by Jacub Cerny) that maybe much of the g'-band coma is due to molecular emission which, due to the greater kick-off velocity of molecules compared with dust particles, would produce a larger coma at g'-band compared with longer wavelengths (especially at i'-band, where molecular emission lines are expected to be almost non-existent). If molecular emission were large then a fixed photometry aperture that's smaller than the largest coma size would capture a smaller fraction of the total coma flux at g'-band compared with i'-band. Good suggestion, but this appears to not be the case for Comet ISON at this time.
We are therefore left with the default position, that dust particles are sufficient to account for the coma brightness at all wavelengths (g', r' & i') and that dust albedo does not vary with wavelength.
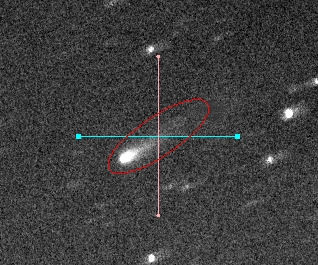
APT elliptical photometry aperture used to measure flux of comet.
Total Rc-mag = 12.65 ± 0.02. Reduced tRc = 10.33.
2013.08.27 Image
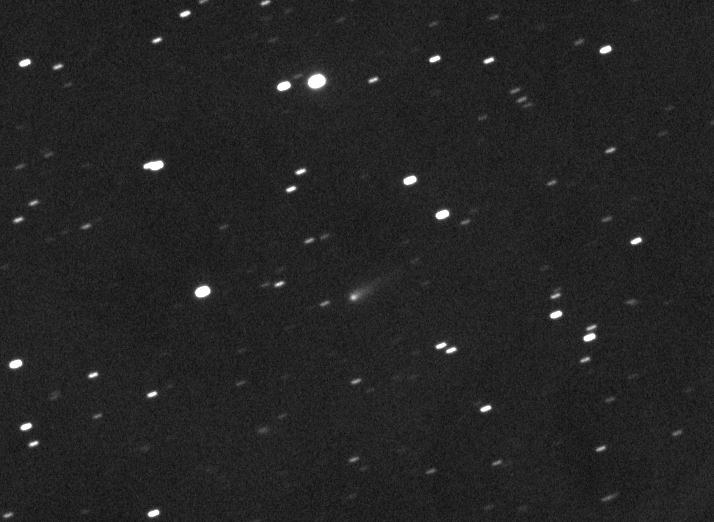
August 27 image by Bruce Gary image. FOV = 20.6 x 15.0 'arc, northeast upper-left. Comet aligned. Stack of 23 20-second exposures.
3-image animation. FOV = 28 x 20 'arc. Each image is median combine of 8 20-sec exposures (comet aligned).
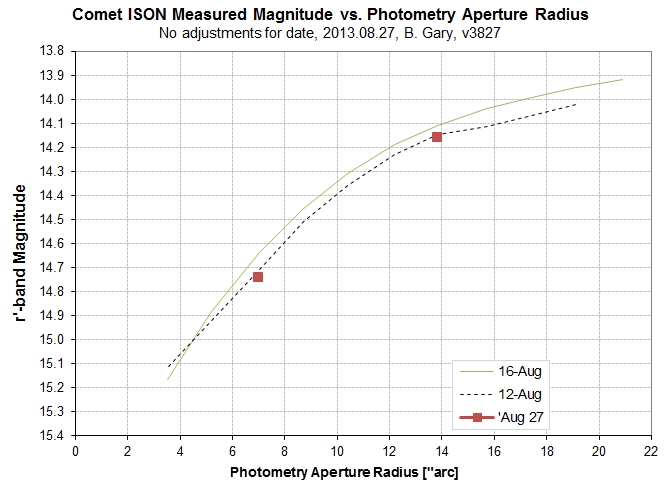
August 27 r'-band magnitude vs. photometry aperture (14 "arc = 62,000 km coma diameter).
For a coma aperture corresponding to 60,000 km, r' = 14.15 (i.e., Rc = 13.94, V = 14.32, assuming solar SED for comet).
APASS doesn't cover this part of the sky so I had to use CMC14 r'-mag's (slow-going for processing).
But what's the meaning of NO BRIGHTENING during the past 16 days? The frost line depends on albedo and thermal conductivity of surface regolith. I guess we could have its frost line to be closer than 2.3 a.u. if its albedo is >90% and gamma >1000! Surely there are ice crystals below the top meter of regolith!
At a photometry radius of ~ 18 - 20 "arc the brightness begins to "flatten out." This corresponds to a coma diameter of ~ 85,000 km. A residual increase will be produced by the tail (which was once part of the coma).
The slope between 4 and 10 "arc radius is 0.55 magnitude per doubling of photometry radius. This magnitude difference corresponds to a ratio of 1.65. Assuming that the speed of dust ejection is constant a coma volume that has twice the radius of a smaller volume should have twice the brightness (flux). Instead, the coma volume defined by a radius of 8 "arc has 1.65 times the brightness (flux) of a volume defined by 4 "arc radius. This could be accounted for by invoking a dust production rate that increases with time.
Extrapolating the magnitude versus radius slope, defined from 4 to 8 "arc, to ~ 0 "arc yields a magnitude for the nucleus of r'-mag ~ 15.6 (or V-mag ~ 15.9). This is 1.67 magnitudes fainter than the coma plus nucleus, or ~20% of the total - which is 1/4th of the coma by itself. If the comet has an albedo of 100% its diameter would be ~ 8 km for it to appear this bright. (This is larger than the 5.0 to 6.5 km estimate based on HST images).
Here's a 23-minute light curve using a 14 "arc photometry radius (62,000 km coma diameter).
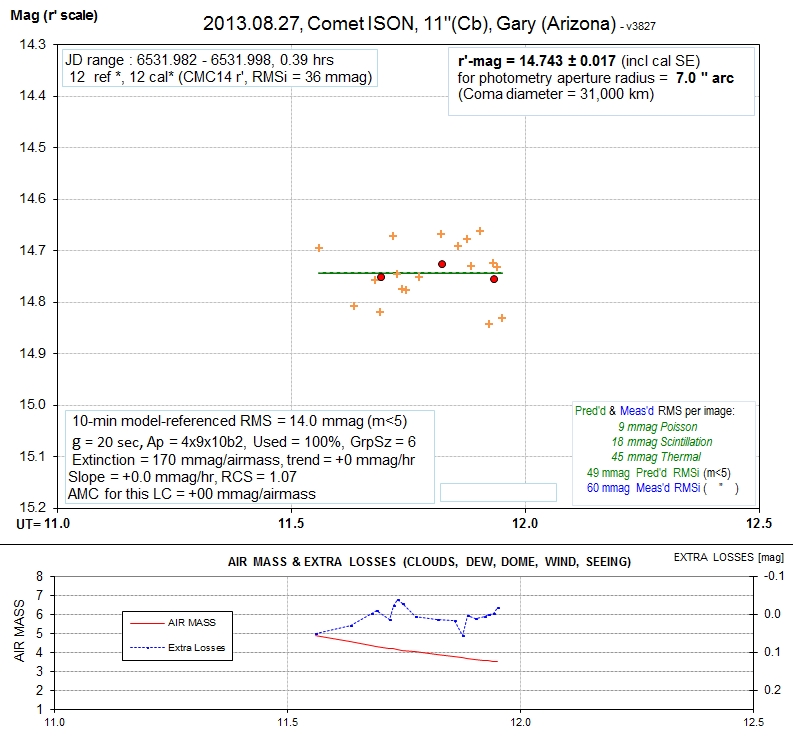
Preliminary version of r'-mag vs. time, for a photometry aperture of 13.9 "arc, during 23-minute observing session on Aug 27.
There is no apparent comet rotation in the above light curve. None was expected for this short of an interval, but it shows the kind of precision that will be possible when the observing session is longer (assuming a 14.2 mag brightness).
2013.08.16 Observation
Can see tail in most of the 20-second images. Large photometry aperture (20 "arc) measurement yields r'-mag = 13.93 (i.e., V-mag ~ 14.10, assuming solar SED for comet, vs. 13.3 for JPL Horizons). In other words, the comet is ~ 0.8 magnitudes fainter than the JPL Horizons adopted brightness model (confirming my analysis of Aug 12 data).
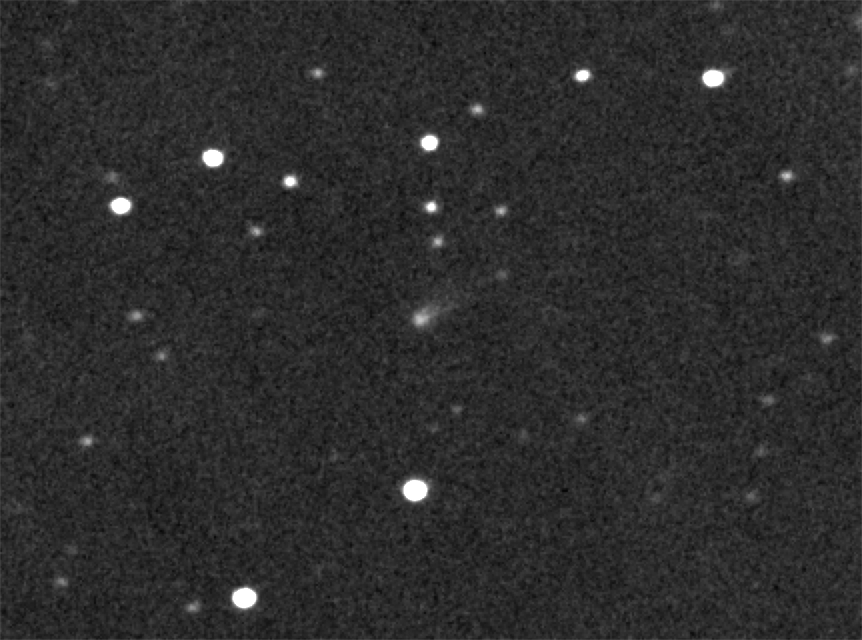
August 16. FOV = 12.5 x 9.3 'arc, north up, east left. Median combine of 17 20-second exposures (aligned using comet).
Animation of motion during 20-minutes on Aug 16 (11:29 to 11:49 UT).
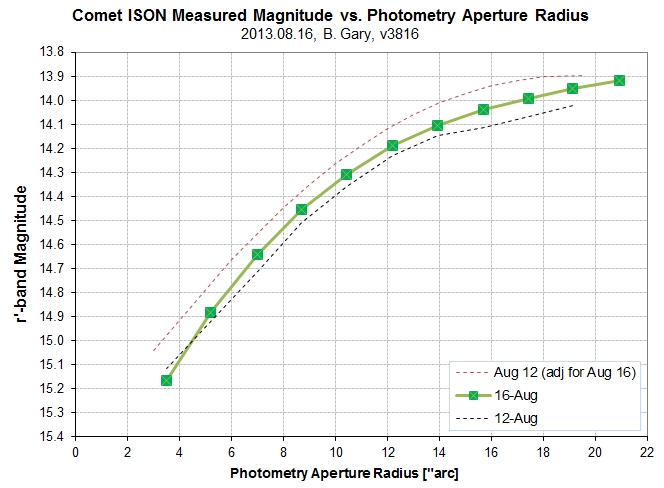
Magnitude vs photometry aperture radius for Aug 16 (green), Aug 12 (black dashed) and Aug 12 adjusted to Aug 16 using JPL Horizons brightness model (red dashed).
This plot shows that the coma has the same dimension and shape as 4 days earlier. Due to change in distances (sun-comet & Earth-comet) the comet should have brightened ~ 0.14 magnitude. However, it only brightened ~ 0.06 magnitude, which means that the coma plus nucleus seems to have faded ~ 0.09 magnitude (~9%) compared to a brightness model. The magnitude accuracies are ~ 0.04 magnitude for Aug 12 and 0.02 magnitude for Aug 16 (precision plus systematic), so comparisons between the dates are uncertain by ~ 0.045 magnitude. The suggested "fade" has only a 2-sigma significance.
On this date the comet's distance from Earth was 3.33 a.u., or 498 x 10^6 km. A 55,000 km diameter (27,500 km radius) corresponds to an aperture radius of 11.4 "arc. The r'-mag for this aperture is 14.24 ± 0.03. Converting to Rc-band, using -0.21 ± 0.02, yields Rc-mag = 14.03 ± 0.04.
The plot also shows that the nucleus brightness is > 1.3 magnitudes fainter than the nucleus plus coma. (The JPL Horizons brightness model has the nucleus 1.42 magnitudes fainter.) I don't have the spatial resolution to say anything more about this.
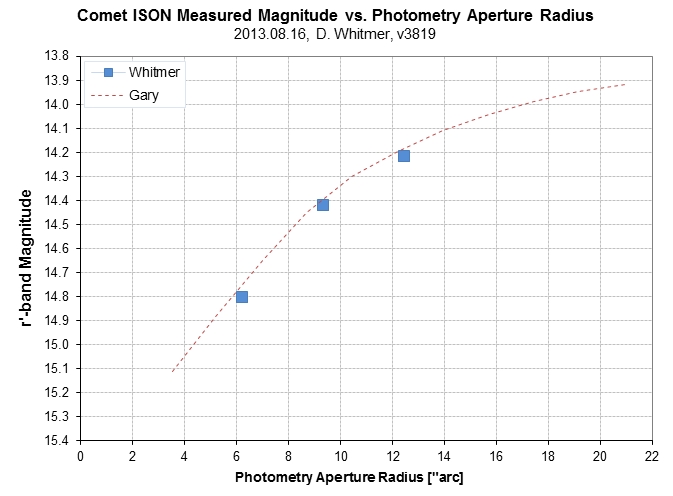
Magnitude vs photometry aperture radius for Whitmer's Aug 16 images (blue squares), and measurements by Gary at same time (red dotted trace).
There is excellent agreement between the Whitmer and Gary r'-band magnitudes versus photometry aperture size on Aug 16.
2013.08.12 Recovery Observation
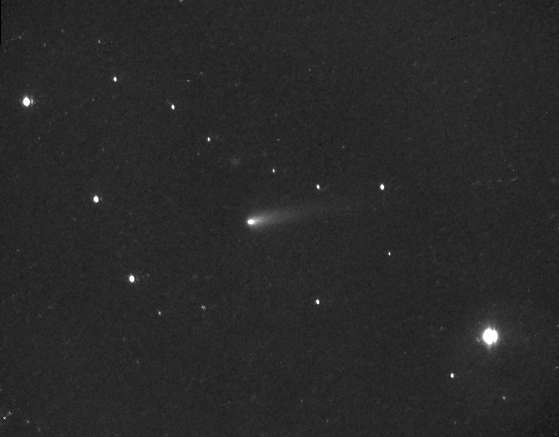
Here's a stacked image of Comet ISON made 2013 Aug 12, from 11:33 to 11:56 UT (with telescope having effective aperture of ~ 8 inches).
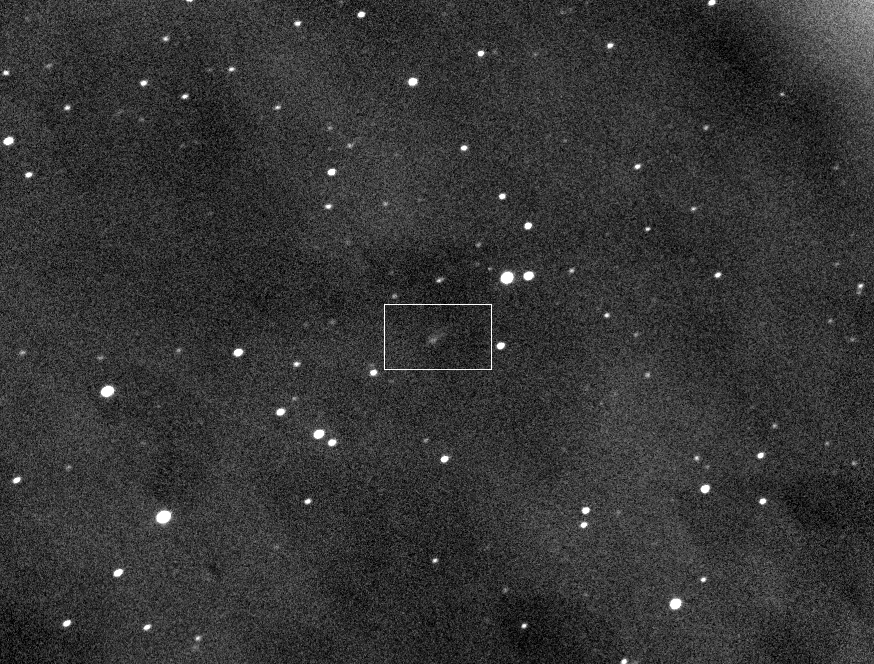
FOV = 32 x 22 'arc, north up, east left. Total number stars ~ 116; faintest has V~ 16.0. Median combine of 23 20-second exposures,
centered on 2013.08.12 11:40 UT. Elevation = 6.0 degrees, airmass = 8.7.
And here's a version where I star-aligned using the comet. The stars are oblong because the comet is moving.
FOV = 11 x 8.5 'arc of median combine using object of interest for image alignment (causing stars to become oblong). Coordinates of object: 08:14:31.81 +24:01:24.7 at 2013.08.12, 11:40 UT.
The images were made with a Celestron 11-inch telescope and SBIG ST-10XME CCD, providing a FOV = 32x22 'arc (the effective aperture was actually ~ 8 inches due to aperture blockage by my dome opening). Elevation = 6.0 degrees, airmass = 8.7. I used a Cb filter (clear with blue blocking), which has an effective wavelength similar to r'-band (also Rc-band), as determined by "star color sensitivity" analyses. It is perhaps noteworthy that in the above image there appears to be the beginnings of a tail, and it's pointed away from the sun (the sun is to left and slightly below this part of the sky).
Return to Main Web Page for November Observations
____________________________________________________________________
2013.10.31 Gary, B, V, Rc, g', r', i'
Gary observed with Cb filter from 10:58 to 11:45 UT (EL = 17 to 27 deg), g'r'i' filters from 11:48 to 12:09 UT (EL = 27 to 32 deg), and with BVRc filters from 12:10 to 12:42 UT (EL = 32 to 39 deg).
B-band
Complicated re-mapping of brightness to displayed brightness for Gary B-band image (26 median combine).
Gary B-mag (using B-band filter) vs. coma diameter included in photometry aperture.
For a coma diameter of 50,000 km V-mag = 12.19. For 200,000 km diameter B-mag = 10.83.
V-band
Complicated re-mapping of brightness to displayed brightness for Gary V-band image (21 median combine).
Gary V-mag (using V-band filter) vs. coma diameter included in photometry aperture.
For a coma diameter of 50,000 km V-mag = 11.23. For 200,000 km V-mag = 9.81.
Rc-band
Complicated conversion of measured brightness to displayed brightness for Gary Rc-band stacked image (21 median-combine). FOV = 31 x 21 'arc, north up, east left.
8x zoom of coma (FOV = 2.6x1.9 'arc), after spatial enhancement using the PSI web site "Cometary Coma Image Enhancement Facility" (using Steve Larson's "Radially Variable Spatial Filtering," 3,3,0.3). Credit: Planetary Society Institute (PSI) "Cometary Coma Image Enhancement Facility" (Samarasinha, N. H., Martin, M. P., Larson, S. M, 2013. Cometary Coma Image Enhancement Facility, http://www.psi.edu/research/cometimen).
Gary Rc-mag vs. diameter of comet coma included in the photometry aperture.
For a coma diameter of 50,000 km Rc-mag = 11.50. For 200,000 km Rc-mag = 10.37.
Example of internal consistency for reference star indicated magnitude minus Rc-mag (based on converting B, V and r' mag's) versus star color (B-V - 0.6). Indicated mag's are adjusted for agreement, which then allows any other indicated mag to be converted to APAS-based Rc-mag (provided the target object's color can be assumed). The RMS scatter with respect to the model (fitted line) is 20 mmag, so the SE for N = 23 such stars is 4.3 mmag. This is greater than the APASS systematic SE for r'-band, which I estimate to be ~ 15 mmag.
Oval apertures used to determine "total magnitude." Total counts within the ovals are compared in a way that is equivalent to using oval differences to establish sky background counts level. The program APT is used.
g'-band
Gary g'-mag vs. diameter of comet coma included in the photometry aperture.
For a coma diameter of 50,000 km g'-mag = 11.63. For 200,000 km g'-mag = 10.16.
r'-band
Gary r'-mag vs. diameter of comet coma included in the photometry aperture.
For a coma diameter of 50,000 km r'-mag = 11.69. For 200,000 km r'-mag = 10.48.
i'-band
Complicated conversion of measured brightness to displayed brightness for Gary r'-band stacked image (10 median-combine). FOV = 31 x 21 'arc, north up, east left.
i'-mag versus coma diameter.
For a coma diameter of 50,000 km r'-mag = 11.66. For 200,000 km r'-mag = 10.60.
SED
The above magnitudes contain information about flux, which are used to produce a "spectral energy distribution" (SED).
SED for coma diameter 50,000 km (aperture center fixed at brightest pixel).
Flux ratios (comet/sun):
B = 1.30
g' = 1.79
V = 1.77
Rc = 0.94
r' = 1.05
i' = 1.00
Gas molecules are emitting mostly within the g' and V bands, with some in the B band. This assumes that no gas emission is present in the Rc, r' and i' bands, which the measurements are consistent with.
2013.10.31 Whitmer R-band
Dennis obtained 70 90-second exposures with R-band filter. The last 30 images have been processed.
Complicated conversion of measured brightness to displayed brightness for Whitmer's R-band imaging (30 median-combine stack)
Rc-band brightness (based on R-band images) of the inner coma versus coma diameter.
For a 60,000 km coma diameter Rc-mag = 11.68. "Diameter" of coma is ~ 33,000 km.
2013.10.30 Kaye
Among the 100 images taken most were too close to a very bright star to be useful. The only product that's worth presenting is a zoom of a enhanced coma.
Complicated conversion of measured brightness to displayed brightness for Kaye's Oct 30 R-band imaging (61 median-combine stack). No jet evident.
2013.10.29 Gary Rc-band
Nature was trying to thwart me this morning: Clouds, wind (28 mph peaks) and a nearby moon caused all but 16 of 345 images to be rejected. Telescope was Celestron 11-inch; exposure time = 15 seconds.
Complicated conversion of measured brightness to displayed brightness for Gary's Rc-band imaging (16 median-combine stack)
Rc-band brightness of the inner coma versus coma diameter.
For a coma diameter of 60,000 km, Rc-mag = 11.70. Coma diameter = 44,000 km (using my arbitrary definition).
Determining total flux using APT's oval photometry aperture 120/24/27 (oval length, width & angle). Oval width 2x & 3x larger was used to establish sky background counts.
Total Rc-mag = 9.70 ± 0.05.
2013.10.28 Kaye V-band
Tom Kaye took 99 images with the Tenagra 32-inch telescope using a V-band filter, exposure times of 20 sec.
Complicated conversion of measured brightness to displayed brightness for Kaye's V-band imaging (99 median-combine stack), using the Tenagra Observatory 32-inch telescope. Notice that the tail appears fainter than in R-band images (V-band is affected most by molecular emission whereas the tail is a dusty red.)
V-band brightness of the inner coma versus coma diameter.
For a coma diameter of 60,000 km, V-mag = 12.29.
Light curve for the inner-most 10,000 km showing no variability.
The lack of variability in this LC suggests that the previous two times when variability was present it may have been an artifact of stars passing in and out of the photometry aperture as the comet moved past background stars.
Determining total flux using APT's oval photometry aperture 139/30/27 (oval length, width & angle). Oval width 2x & 3x larger was used to establish sky background counts.
Total Rc-mag = 9.50 ± 0.03.
This total V-mag is interesting, because the last total V-mag measurement was Oct 22 yielding V-mag = 9.50. There should have been a 0.68 mag brightening during the last 6 days, due to the comet coming closer to Earth, but since there was no change the "reduced V-mag" has faded 0.68 mag!
Here's a spatially enhanced image of the Oct 28 coma:
This is a false-color spatial enhancement of the inner coma, showing a possible "coma feature" on the sunward side. Image scale is the same as the original, 0.86 "arc/pixel (or 830 km/pixel). The original image is by Tom Kaye and the enhancement is by Beatrice Mueller and Nalin Samarasinha, Planetary Science Institute, Tucson, AZ.
Keep in mind that placement of spatial enhancing filters is critical and manual misplacement can produce artifact "jet-like" features. If this feature exists then it would be less pronounced than the HST jets seen in April and May.
Here's a Toni Scarmato enhancement, using a MCM procedure:
Toni Scarmato spatial structure enhancement using MCM procedure.
And another Toni Scarmato enhancement using a Larson-Sekanina filter:
Toni Scarmato's LS enhancement of the same original image.
When two analysts obtain essentially the same spatial enhancement result I will post them on this web page. Keep in mind the difficulties of spatial enhancing images to the level achieved above.
2013.10.26 Kaye B-band
Complicated conversion of measured brightness to displayed brightness for Kaye's B-band imaging (22 median-combine stack), using the Tenagra Observatory 32-inch telescope.
B-band brightness of the inner coma versus coma diameter.
For a coma diameter of 60,000 km, B-mag = 13.25.
"Light curve" showing sinusoidal variation with P ~ 47 minutes.
This is the 2nd LC for the comet using a large enough aperture to detect variability, and in both cases a small-amplitude quasi-sinusoidal variation has been seen. It could be a jet that changes orientation as the nucleus turns, causing a sinusoidal periodicity with P 1/2 of the actual rotation period (just like asteroids). However, it is extremely unlikely that any comet will rotate with a period shorter than ~ 2 hours; as far as I know there are no reports in the literature for P < 3 hours.
2013.10.26 Whitmer R-band
Complicated conversion from observed brightness to displayed brightness for illustrating location of coma center in relation rest of coma and tail. Median combine of 30 90-second exposures, RB-band filter, 14-inch Celestron, by Whitmer, on 2013.10.26. North up, east left.
Rc-mag vs photometry aperture size in units of km at the comet's distance. Solid square symbols are for "half size" images.
For coma diameter 60,000 km, Rc-mag = 12.04.
Determining total flux using APT's oval photometry aperture 139/30/27 (oval length, width & angle). Oval width 2x & 3x larger was used to establish sky background counts.
Total Rc-mag = 9.81 ± 0.03.
2013.10.25. Whitmer R-band
Complicated conversion from observed brightness to displayed brightness for illustrating location of coma center in relation rest of coma and tail. Median combine of 30 90-second exposures, RB-band filter, 14-inch Celestron, by Whitmer, on 2013.10.25. North up, east left.
Rc-mag vs photometry aperture size in units of km at the comet's distance. Solid square symbols are for "half size" images, allowing for measurements of greater diameter comas (with sky background annulus farther away from comet, which reduces tail contamination).
For coma diameter = 60,000 km, Rc-mag = 12.08.
Determining total flux using APT's oval photometry aperture 139/30/27 (oval length, width & angle). Oval width 2x & 3x larger was used to establish sky background counts.
Total Rc-mag = 9.85 ± 0.03.
2013.10.24. Whitmer R-band Image & Analysis
Complicated conversion from observed brightness to displayed brightness for illustrating location of coma center in relation rest of coma and tail. Median combine of 12 90-second exposures, RB-band filter, 14-inch Celestron, by Whitmer, on 2013.10.24. FOV = 15.9 x 13.0 'arc. North up, east left.
Rc-mag vs photometry aperture size in units of km at the comet's distance.
For a 60,000 km diameter Rc-mag = 12.14. Note, however, that the coma is larger than it used to be, so larger coma diameters for photometry measurements should be used.
Determining total flux using APT's oval photometry aperture 140/30/28 (oval length, width & angle). Oval width 2x & 3x larger was used to establish sky background counts.
Total Rc-mag = 9.81 ± 0.03.
2013.10.23 Whitmer R-band Analysis
Whitmer obtained 50 images and I analyzed that last 6 for an uncertain Rc-mag estimate.
Rc-mag vs photometry aperture size in units of km at the comet's distance.
Extrapolated Rc-mag for 60,000 km diameter is 12.44. This Rc-mag is uncertain due to need for extrapolating.
2013.10.22 Gary B, V, Rc Images & Analysis
I observed for 2 hours with B, V and Rc filters with the goal of evaluating relative importance of gases vs. wavelength. A secondary goal was to produce a true-color "pretty picture."
B Band
Complicated conversion from observed brightness to displayed brightness for illustrating location of coma center in relation rest of coma and tail. Median combine of 58 30-second exposures, B-band filter, 11-inch Celestron, by Gary, on 2013.10.22. FOV = 20.0 x 14.6 'arc. North up, east left.
For coma diameter of 50,000 km, B-mag = 13.15. For 200,000 km, B-mag = 11.56.
Determining total flux using APT's oval photometry aperture 101/40/26 (oval length, width & angle). Oval width 2x larger was used to establish sky background counts.
Total B-mag = 10.43 ± 0.01 (stochastic SE) ± 0.05 (estimated total SE).
V Band
Complicated conversion from observed brightness to displayed brightness for illustrating location of coma center in relation rest of coma and tail. Median combine of 49 30-second exposures, B-band filter, 11-inch Celestron, by Gary, on 2013.10.22. North up, east left.
V-mag vs photometry aperture size in units of km at the comet's distance.
For coma diameter of 50,000 km, V-mag = 12.28. For 200,000 km, V-mag = 10.61.
Determining total flux using APT's oval photometry aperture 121/50/26 (oval length, width & angle). Oval width 2x larger was used to establish sky background counts.
Total V-mag = 9.50 ± 0.02
Rc Band
Complicated conversion from observed brightness to displayed brightness for illustrating location of coma center in relation rest of coma and tail. Median combine of 54 30-second exposures, Rc-band filter, 11-inch Celestron, by Gary, on 2013.10.22. North up, east left.
Rc-mag vs photometry aperture size in units of km at the comet's distance.
For coma diameter of 50,000 km, V-mag = 12.26. For 200,000 km, V-mag = 10.97.
For the comet's current color, we may use: B-V = 0.87 (for the coma).
Determining total flux using APT's oval photometry aperture 166/50/26 (oval length, width & angle). Oval width 2x and 3x larger were used to establish sky background counts.
Total V-mag = 9.57 ± 0.02.
Using the above measurements for Comet ISON's B-, V- and Rc-mags it is possible to determine conversion equations (for ISON's current color):
Total V-mag = Total Rc-mag - 0.07
Coma V-mag (50,000 km diameter) = Coma Rc-mag (50,000 km diameter) + 0.02.
Spectral Energy Distribution
The above BVRc magnitudes produce the following SED:
Spectral Energy Distribution (SED) for Comet ISON compared with solar spectrum, for an inner coma diameter of 50,000 km, with a y-axis offset that places Rc-mag on the solar spectrum trace.
We can now fill-in more of the SED by adding this date's B, V Rc mag's to the g', r' and i' mags from 2 days earlier:
Spectral Energy Distribution (SED) for Comet ISON compared with solar spectrum, including measurements from Oct 20 and 22 for the inner coma (60,000 km diameter).
The above SED shows that molecular emission lines must be present at bands B, g' and V, and much less present (if at all) at bands Rc, r' and i'. I think this is consistent with theory.
Here's a true color image from this date's observations:
True color image, using Oct 22 B, V and Rc images (by Gary).
The coma is green due to molecular emission (by CO molecules?).
2013.10.21 Whitmer R-band
Another 70 images by Whitmer with his 14-inch Celestron.
Complicated conversion from observed brightness to displayed brightness for illustrating location of coma center in relation rest of coma and tail. Median combine of 69 90-second exposures, R-band filter, 14-inch Celestron, by Whitmer, on 2013.10.21. North up, east left.
Rc-mag vs photometry aperture size in units of km at the comet's distance.
Extrapolating to 60,000 km diameter Rc-mag = 12.75.
Determining total flux using APT's oval photometry aperture 135/33/27 (oval length, width & angle). Oval widths 2x and 3x larger were used to establish sky background counts.
Total Rc-mag = 9.92 ± 0.05.
2013.10.20 Kaye R-band
On this date new observer (in the neighborhood) Tom Kaye used a 32-inch telescope at Tenagra Observatory (40 miles away) to observe in R-band for 45 minutes. Exposure times were 20 seconds; 63 images were taken. Seeing was FWHM ~ 2.3 "arc.
Complicated conversion from observed brightness to displayed brightness for illustrating location of coma center in relation rest of coma and tail. Median combine of 63 20-second exposures, R-band filter, 32-inch Celestron, by Kaye, on 2013.10.20. North up, east left.
Short light curve (45 minutes long), with a sinusoidal fit showing a 39-minute periodicity with semi-amplitude that ranges from 11.6 mmag to 8.2 mmag, depending on size of the photometry aperture. Both variations are statistically significant (6- and 5-sigma).
This is the first time I've had a set of high signal-to-noise images to work with so if such a periodicity had been present before now I would have missed it. Could this variation be related to the nucleus rotation period? As with asteroids, a 39-minute periodicity could be produced by a 78-minute rotation of the nucleus. However, such a short rotation period is unlikely because it would require a density too high for comet bodies (centrifugal force must overcome gravity for loose things on the surface to stay put, etc). It's unlikely for any comet or asteroid to have a period shorter than about 2 hours, so I don't know what could cause the observed variation. (I checked all 16 reference stars, and none of them can be blamed for causing an apparent variation of the comet's brightness.)
Two plots of Rc-mag vs photometry aperture size. The right panel has an extra small aperture datum, which alters the model fit significantly.
Extrapolating Rc-mag to larger photometry aperture sizes is risky, as the above pair of plots illustrate. The 60,000 km Rc-mag is either 12.62 or 12.73. For purposes of subsequent analyses I'll adopt Rc-mag = 12.65 (taking into account that small aperture measurements are inherently less accurate due to mis-alignment of the aperture with the coma). This value differs from my Rc-mag estimate using r'-band images taken at the same time (described below): Gary Rc-mag from r'-band images = 12.20 vs Kaye Rc-mag = 12.65. I wonder if it's no longer possible to convert from r'-mag to Rc-mag for the comet because of it's non-stellar SED?
The 32-inch telescope has a smaller field-of-view than my 11-inch telescope, so it includes less of the tail. It is therefore less suited for estimating "total magnitude" compared with smaller telescopes.
2013.10.20 Gary g', r' and i'-band
On this date I observed with filters g', r' and i' from 10:34 to 12:38 UT with a 11-inch aperture telescope. The goal was to assess the relative size and brightness of the coma in relation to the tail. If the coma is greatly influences by gases (such as C2) the following could be expected: 1) coma will be "greener" than the dust-mostly tail, 2) coma will be larger in size at g'-band than r'- or i'-band, and 3) the spectral energy distribution (SED) will show greater brightness at g'-band than r'- and i'-band in relation to the sun's SED.
g'-band Data
Complicated conversion from observed brightness to displayed brightness for illustrating location of coma center in relation rest of coma and tail. Median combine of 53 30-second exposures, g'-band filter, 11-inch Celestron, by Gary, on 2013.10.20. North up, east left.
g'-band magnitude versus photometry aperture diameter at comet's distance for Gary Oct 20 image.
The shape of this "curve of growth" plot is the same at g'-band on Oct 20 as for Cb-band on Oct 19. For a diameter of 80,000 km g'-mag = 12.65.
Determining total flux using APT's oval photometry aperture 160/42/28 (oval length, width & angle). Right panel is for width x2 (used to determine background level).
A 3rd APT for x3 width was also used to establish background level. Total g'-mag = 9.86 ± 0.05 (stochastic + systematic SE).
r'-band Data
Complicated conversion from observed brightness to displayed brightness for illustrating location of coma center in relation rest of coma and tail. Median combine of 50 30-second exposures, r'-band filter, 11-inch Celestron, by Gary, on 2013.10.20. North up, east left.
r'-band magnitude versus photometry aperture diameter at comet's distance for Gary Oct 20 image.
The shape of this "curve of growth" plot is the same at r'-band on Oct 20 as for g'-band (on Oct 20). For a diameter of 80,000 km r'-mag = 12.41. If we convert r'-mag to Rc-mag using stellar conversion equations, then Rc-mag = 12.20.
Determining total flux using APT's oval photometry aperture 160/40/28 (oval length, width & angle).
Other APT widths for x2 and x3 were used to establish background level. Total r'-mag = 9.87 ± 0.05 (stochastic + systematic SE).
i'-band Data
Complicated conversion from observed brightness to displayed brightness for illustrating location of coma center in relation rest of coma and tail. Median combine of 69 30-second exposures, i'-band filter, 11-inch Celestron, by Gary, on 2013.10.20. North up, east left.
i'-band magnitude versus photometry aperture diameter at comet's distance for Gary Oct 20 image. '-band magnitude versus photometry aperture diameter at comet's distance for Gary Oct 20 image.
The shape of this "curve of growth" plot is the same at i'-band on Oct 20 as for r'-band (on Oct 20). For a diameter of 80,000 km g'-mag = 12.23.
Determining total flux using APT's oval photometry aperture 160/40/28 (oval length, width & angle).
Determining total flux using APT's oval photometry aperture 160/40/28 (oval length, width & angle) for i'-band median-combined comet-aligned image.
Other APT widths for x2 and x3 were used to establish background level. Total r'-mag = 9.79 ± 0.02 (stochastic + systematic SE).
Spectral Energy Distribution (SED) for Comet ISON compared with solar spectrum.
The g'-band flux of Comet ISON's total flux is 1.7 times what would be expected if the entire comet (coma plus tail) consisted of dust with a constant albedo versus wavelength. A month ago the SEDs showed that g'-mags were lower than expected if the dust albedo was constant with wavelength; i.e., this must mean that a month ago there was negligible gas emission (within the g' passband) and that the dust had an albedo that increased with wavelength. Comparing the September and October 20 SEDs a case can be made for stating that most of the g'-band flux is due to molecular emission (e.g., C2 Swan bands). Further, a small amount of the r-band flux can be attributed to molecular emission.
For comparison, here's are the SEDs for Sep 16 & 24.
SEDs for Comet ISON from a month ago (before gases were present).
Converting g'r'i' to RGB Color
Two brightness level versions of a false color image created by converting i'r'g' to RGB, respectively, using a log stretch to show coma and tail colors. (Depending on your display settings one of these two will look better.) The blueness of this image comes from the g'-band filter which is in the green part of the spectrum; redness comes from the i'-band filter which is actually redder than the red part of the spectrum.
The coma is brighter at the shortest wavelength (g'-band) where molecular emission is strongest. (Since g'-band is in the green part of the spectrum a true color image might show the coma to be green.) The tail is relatively redder due to dust having a greater albedo at longer wavelengths (such as at i'-band).
Zoom showing inner coma better. The front part of the coma is where the gas is.
2013.10.19 Whitmer R-band
Complicated conversion from observed brightness to displayed brightness for illustrating location of coma center in relation rest of coma and tail. Median combine of 77 90-second exposures, R filter, 14-inch Celestron, by Whitmer, on 2013.10.19. North up, east left.
Rc-band magnitude versus photometry aperture diameter at comet's distance for Whitmer Oct 19 image.
Notice how the two plots of Rc-mag vs. diameter of coma enclosed begin to differ beyond ~20,000 km (10,000 km radius from nucleus). This might be due to the fact that Whitmer uses a R-band filter (sensitive to dust) whereas Gary uses a Cb-band filter (sensitive to dust AND gases). One interpretation of the coma from 10,000 km radius to at least 25,000 km is the presence of gases (C2, for example) in this region; Whitmer's R-band filter would be insensitive to these gases, whereas the Gary Cb-band filter would respond to their presence.
Also notice that the Gary plot extends to ~100,000 km diameter whereas the Whitmer plot ends at 40,000 km diameter. There are two reasons for this: 1) Whitmer is ha smaller field-of-view because his telescope is larger, with a longer focal length, and 2) Whitmer observes unbinned, whereas Gary observes binning 2x2, thus making it more feasible to use photometry apertures that cover a larger areas of the sky. There's logic in having different configurations; Whitmer's images are better for searching for jet structures while Gary's are better for obtaining total magnitudes (which require a large field-of-view for including most of the tail.
It's time that I did a g'r'i' observation.
Determining total flux using APT's oval photometry aperture 139/41/26 (oval length, width & angle). Right panel is for width x2 (used to determine background level).
Total Rc = 10.30 ± 0.05
Whitmer's total Rc-mag is fainter than Gary's, for the same observing time. Again, this may be due to Whitmer's filter being more responsive to the tail (which is "red") whereas Gary's filter includes a response to gasses plus the tail (the gasses are "green").
2013.10.19 Gary Cb-band Images & Mag's
Gary (that's me) took 206 20-second exposures, binned 2x2. The best 193 were used in the following analysis.
Complicated conversion from observed brightness to displayed brightness for illustrating location of coma center in relation rest of coma and tail. Median combine of 193 20-second exposures, Cb filter, 11-inch Celestron, by Gary, on 2013.10.19. North up, east left.
Rc-band magnitude versus photometry aperture diameter at comet's distance for Gary Oct 19 image.
There is a big change from the day before, with the outer coma brightening more than the inner coma.
Determining total flux using APT's oval photometry aperture 139/40/26 (oval length, width & angle). Right panel is for width x2 (used to determine background level).
(A 3x image was also used for establishing background level.)
Total Rc = 9.93 ± 0.01
2013.10.18 Whitmer R-band Images & Mag's
Complicated conversion from observed brightness to displayed brightness for illustrating location of coma center in relation rest of coma and tail. Median combine of 65 comet-guided 90-second exposures, R filter, 14-inch Celestron, by Whitmer, on 2013.10.18. North up, east left.
Rc-band magnitude versus photometry aperture diameter at comet's distance for Whitmer Oct 18 data.
For coma diameter of ~ 60,000 km Rc = 12.90.
Determining total flux using APT's oval photometry aperture 123/23/27 (oval length, width & angle). Right panel is for 123/69/23, which includes 3 times the area.
Total Rc = 10.04 ± 0.11
2013.10.17 Whitmer R-band Image & Mag's
Complicated conversion from observed brightness to displayed brightness for illustrating location of coma center in relation rest of coma and tail. Median combine of 6 comet-guided 90-second exposures, R filter, 14-inch Celestron, by Whitmer, on 2013.10.17. North up, east left. (The other images had a background star interfering & couldn't be used.)
Rc-band magnitude versus photometry aperture diameter at comet's distance for Whitmer Oct 17 data.
For coma diameter of ~ 60,000 km Rc = 12.88.
Determining total flux using APT's oval photometry aperture 200/45/28 (oval length, width & angle). Right panel is for 200/135/28, which includes 3 times the area.
The elliptical aperture program (APT, Aperture Photometry Tool) reports total counts within an aperture. After creating an aperture that fits the comet a reading is made, but it contains background counts and we want to know how many counts can be attributed to the comet. By simply increasing the size of the oval aperture (without changing the center location) it is possible to infer a background total counts that must be subtracted from the counts in the original aperture (tailored to fit the comet). In the above example I tripled the oval width, causing the background counts to increase by a factor 2. By assuming that the background counts is the same for both readings it is possible to determine the background contribution for any aperture size using the following equation: BackgroundCountsImage1 = (TotalCountsImage2 - TotalCountsImage1) / (N -1), where N = ratio of areas (N=3 for this example). In other words, if the width is doubled N = 2, and the difference of total counts is equal to the background in the first image. Or, if the width is tripled then the difference of total counts is twice the background counts in the first image. I want to thank Tom Kaye for suggesting this clever trick! (This is one example illustrating why we get together for dinner every Wednesday night.)
The comet's total Rc-mag = 10.469 ± 0.009 (formal statistical SE; 0.02 might be a better estimate).
2013.10.16. Whitmer R-band Image & Magnitudes
Complicated conversion from observed brightness to displayed brightness for illustrating location of coma center in relation rest of coma and tail. Median combine of 60 comet-guided 90-second exposures, R filter, 14-inch Celestron, by Whitmer, on 2013.10.16. North up, east left. This cropped image has FOV = 14.7 x 9.9 'arc.
Determining total flux using APT's oval photometry aperture (200/45/26).
Total Rc-mag = 10.50 ± 0.03.
Rc-band magnitude versus photometry aperture diameter at comet's distance for Whitmer Oct 16 data.
For coma diameter of ~ 60,000 km Rc = 13.10.
2013.10.15 Whitmer R-band Image & Magnitudes
Complicated conversion from observed brightness to displayed brightness for illustrating location of coma center in relation rest of coma and tail. Median combine of 50 comet-guided 90-second exposures, R filter, 14-inch Celestron, by Whitmer, on 2013.10.15. North up, east left. This cropped image has FOV = 8.4 x 7.4 'arc.
Illustration of my method for measuring comet's total flux. (Don't worry about some residual star streaks within the reference positions; they contribute a negligible amount to the "counts included" values. A complete description of procedure will be given in a link later.)
Total Rc-mag = 10.75 ± 0.02. Reduced Total Rc-mag (rtRc) = 9.58 ± 0.02.
Rc-band magnitude versus photometry aperture diameter at comet's distance for Whitmer Oct 15 data.
For coma diameter of ~ 60,000 km Rc = 13.09.
2013.10.12 Whitmer R-band Image & Magnitudes
Complicated conversion from observed brightness to displayed brightness for illustrating location of coma center in relation rest of coma and tail. Median combine of the sharpest 15 of 60 90-second exposures, R filter, 14-inch Celestron, by Whitmer, on 2013.10.12. North up, east left. This cropped image has FOV = 10.0 x 8.4 'arc.
Rc-band magnitude versus photometry aperture diameter at comet's distance for Whitmer Oct 12 data.
The 60,000 km diameter coma has Rc = 13.19. Total Rc = 10.74 ± 0.03. Reduced total Rc-mag = 9.976 (magnitude as viewed from 1 a.u.).
2013.10.11 Whitmer R-band Image Magnitudes
Complicated conversion from observed brightness to displayed brightness for illustrating location of coma center in relation rest of coma and tail. Median combine of the sharpest 34 of 50 90-second exposures, R filter, 14-inch Celestron, by Whitmer, on 2013.10.11. North up, east left. This cropped image has FOV = 9.0 x 9.1 'arc.
Total Rc-mag = 10.95 ("reduced" Rc = 10.15).
Rc-band magnitude versus photometry aperture diameter at comet's distance for Whitmer Oct 11 data.
The 60,000 km diameter coma has Rc = 13.20 (total Rc = 10.95).
2013.10.09 Whitmer R-band Magnitude Analysis
Whitmer took B- and R-band images during winds that degraded seeing. Only 10 of the R-band images has been processed.
Rc-band magnitude versus photometry aperture diameter at comet's distance for Whitmer Oct 09 data.
Rc = 13.30 for 60,000 km coma diameter. Total Rc = 10.83 ± 0.04. Reduced Rc = 9.97 (magnitude as viewed from 1 a.u.)
2013.10.08 Whitmer R-band Image & Magnitude Analysis
On this date Dennis Whitmer took 50 90-second images with his 14-inch telescope. The sharpest 27 were used to create the following stacked image.
Complicated conversion from observed brightness to displayed brightness for illustrating location of coma center in relation rest of coma and tail. Median combine of the sharpest 27 of 50 90-second exposures, R filter, 14-inch Celestron, by Whitmer, on 2013.10.08. North up, east left. This cropped image has FOV = 11.0 x 8.9 'arc.
Rc-band magnitude versus photometry aperture diameter at comet's distance for Whitmer Oct 08 data.
A pattern is developing in which the Gary and Whitmer Rc(ComaDiameterIncluded) agree for the inner coma, but separate in the outer coma. This might be related to the fact that Whitmer uses a R-band filter whereas Gary uses a Cb filter (clear with blue blocking). If the color of the coma and tail are different then since the "photometry signal circle" includes more of the tail for large apertures we should expect difference in Rc readings to differ for the larger apertures - and that's what we see. If this explanation is correct, then the fact that these differences are growing with date implies that the colors of the coma and tail are differing by greater amounts with date.
Rc = 13.32 at 60,000 km diameter.
2013.10.08 Gary Cb-band Image & Magnitude Analysis
On this date Gary took 95 30-second images with his 11-inch telescope. The sharpest 41 were used to create the following stacked image.
Complicated conversion from observed brightness to displayed brightness for illustrating location of coma center in relation rest of coma and tail. Median combine of the sharpest 41 of 95 30-second exposures, Cb filter, 11-inch Celestron, by Gary, on 2013.10.08. North up, east left. The tail can be seen out to 6.2 'arc from the nucleus. (The sun-target-observer angle is 31 deg.) This cropped image has FOV = 10.8 x 7.9 'arc.
Rc-band magnitude versus photometry aperture diameter at comet's distance.
The Rc-mag at 60,000 km diameter is 13.18 (extrapolating beyond this diameter is risky).
2013.10.06 Whitmer R-band Image & Magnitude Analysis
On this date Dennis Whitmer took 50 90-second images with his 14-inch telescope. The sharpest 20 were used to create the following stacked image.
Complicated conversion from observed brightness to displayed brightness for illustrating location of coma center in relation rest of coma and tail. Median combine of the sharpest 20 of 50 90-second exposures, R filter, 14-inch Celestron, by Whitmer, on 2013.10.06. North up, east left. This cropped image has FOV = 8.8 x 6.6 'arc.
Rc-band magnitude versus photometry aperture diameter at comet's distance.
Extrapolating to an aperture corresponding to 70,000 km yields Rc = 13.35. I don't know why the Gary & Whitmer data begin to diverge beyond an aperture of 30,000 km. The extrapolated values at 70,000 km differ by 0.15 mag, which so far is the greatest discrepancy between simultaneous Rc-magnitudes by these two observers.
2013.10.06 Gary Cb-band Image & Magnitude Analysis
On this date I took 117 20-second images with my 11-inch telescope. The sharpest 17 were used to create the following stacked image.
Complicated conversion from observed brightness to displayed brightness for illustrating location of coma center in relation rest of coma and tail. Median combine of the sharpest 51 of 117 20-second exposures, Cb filter, 11-inch Celestron, by Gary, on 2013.10.06. North up, east left. This cropped image has FOV = 19.2 x 14.0 'arc.
Rc-band magnitude versus photometry aperture at comet's distance.
Extrapolating to an aperture corresponding to 70,000 km yields Rc = 13.20.
2013.10.05 Whitmer R-band Image & Magnitude Analysis
On this date Dennis Whitmer took 50 90-second images with his 14-inch telescope. The sharpest 20 were used to create the following stacked image.
Complicated conversion from observed brightness to displayed brightness for illustrating location of coma center in relation rest of coma and tail. Median combine of the sharpest 20 of 50 90-second exposures, R filter, 14-inch Celestron, by Dennis Whitmer on 2013.10.05. North up, east left. This cropped image has FOV = 12.2 x 9.8 'arc.
Rc-band magnitude versus photometry aperture at comet's distance.
Notice that the comet has faded 0.29 ± 0.05 mag's during the past 24 hours. I estimate an extrapolated R-mag for 70,000 km diameter of 13.39 ± 0.02. The 9 reference stars had low scatter, as did the photometry of images, indicating a SEs that ranged from 0.01 to 0.02 mag for the data plotted above. The 0.29 mag fade is therefore real.
2013.10.04 Whitmer R-band Image & Magnitude Analysis
On this date Dennis Whitmer took 60 90-second images with his 14-inch telescope. The sharpest 10 were used to create the following stacked image.
Average of 10 sharpest images of Oct 4 by Dennis Whitmer with a 14-inch telescope.
Rc-band magnitude versus photometry aperture at comet's distance.
For a reference coma diameter of 70,000 km the Rc-band magnitude is 13.07.
2013.10.01 Gary Cb-Filter Image & Magnitude Analysis
On this date I took 146 Cb images during a 1.5-hour interval (10:59 to 12:29 UT) using a Celestron CPC 1100 telescope and SBIG ST-10XME CCD.
Complicated conversion from observed brightness to displayed brightness for illustrating location of coma center in relation rest of coma and tail. Median combine of the sharpest 64 of 146 30-second exposures, Cb-filter (clear with blue blocking), 11-inch Celestron, 2013.10.01. North up, east left. This cropped image has FOV = 7.2 x 4.8 'arc.
r'-band (Gary) magnitudes versus amount of coma included in photometry aperture, for Oct 01, based on Cb-filter observations. Symbols for earlier dates show that on Oct 01 the outer coma appears to be eroded compared with the previous measurement on Sep 29. 18 stars with APASS r'mag's were used to establish calibration and a typical SE uncertainty is 0.008 mag; RMS differences about a r-mag/star color fit were typically 24 mmag (varied with photometry aperture), implying that the calibration was uncertain by at least 6 mmag due to this scatter.
The coma appears slightly smaller than on Sep 29, though the case for this is weak.
Extrapolating the mag vs. aperture trend to a coma diameter of 70,000 km yields r'-mag = 13.50 ± 0.05. Converting to Rc yields Rc-mag = 13.30 ± 0.05.
2013.09.29 Gary Cb-Filter, r'-Magnitude
On this date I took 162 Cb images and 40 r' images during a 1.6-hour interval (10:44 to 12:20 UT) using a Celestron CPC 1100 telescope and SBIG ST-10XME CCD. So far only the Cb image set has been processed.
Complicated conversion from observed brightness to displayed brightness for illustrating location of coma center in relation rest of coma and tail. Median combine of the sharpest 45 of 162 15-second exposures, Cb-filter (clear with blue blocking), 11-inch Celestron, 2013.09.29. North up, east left. This cropped image has FOV = 16.7 x 10.2 'arc. The tail is 5.0 'arc long in this image.
r'-band (Gary) magnitudes versus amount of coma included in photometry aperture, for Sep 29. Symbols for Sep 24 and a trace for Sep 16 are shown. 16 stars with APASS r'mag's were used to establish calibration; RMS differences about a r-mag/star color fit were typically 15 mmag (varied with photometry aperture), implying that the calibration was uncertain by ~ 5 mmag due to this scatter.
The 70,000 km diameter r'-mag = 13.32, which corresponds to Rc-mag ~ 13.12.
The size of the coma appears to have increased since Sep 24, and might actually be slightly lasrger than on Sep 16. If a stronger than usual solar wind on Sep 24 eroded the coma (and moved dust to the tail), then a return of the solar wind to a more typical value could explain the return of the coma size to a more typical value.
2013.09.24 Whitmer Rc Magnitude
Animation with 3 3-minute exposures, Rc-band, by D. Whitmer. Note the asteroid (left edge) moving in the same direction as the comet. Alex Amorim states that it is "433 Eros," at V-mag 13.6.
The moving asteroid is also present in my 50-image sequence.
Rc-band (Whitmer) and g', r' and i' band (Gary) magnitudes versus amount of coma included in photometry aperture, for Sep 24. Traces for Sep 16 are shown.
Rc-mag ~ 13.45 at ~ 70,000 km diameter. This compares well with Rc-mag ~ 13.50 derived from my r'-mag = 13.70 (from simultaneous observations from observatories ~ 2 miles apart). The agreement can also be seen in the "Comet ISON Magnitude vs. Date" figure at the top of this web page.
2013.09.24 Gary g'r'i' Magnitudes
Median combine of 51 20-second images, r'-band, unbinned.
g', r' and i' magnitudes versus amount of coma included in photometry aperture, for Sep 24 (Gary data); traces for Sep 16 are shown.
The above plot shows r'-mag ~ 13.70 at ~ 70,000 km diameter; this corresponds to Rc-mag ~ 13.50. There is essentially no brightness change during the past 8 days (when it should have brightened 0.26 mag). It also shows a smaller (more compact) coma. The inner part of the coma is slightly brighter (~ 0.1 mag) but the outer part is fainter. Maybe more of the coma is being ejected into the tail due to a stronger solar wind. This is consistent with the total coma brightness being less than expected.
SED for September 24.
The coma particles have an albedo that is low at g'-band (where most molecular emission lines occur).
2013.09.23 Whitmer Rc Magnitudes
Rc-band, unbinned, median combine of four 90-second exposures by Dennis Whitmer, 2013 Sep 23.
Whitmer has many more images but I only used 4 for the following analysis.
Rc-mag's on Sep 23 are ~ 0.6 mag brighter than on Sep 19 (vs. 0.13 mag expected).
Measuring flux using APT (80/30/29).
Total Rc-mag (tRc) = 11.93 ± 0.03.
2013.09.19 Whitmer Rc Magnitudes
Median combine of 4 60-sec images (comet-aligned).
Rc-mag's on Sep 19 are same as on Sep 15.
Oval aperture using APT.
Total Rc = 12.19 ± 0.03. Reduced Total Rc = 10.12.
2013.09.16 Gary g'r'i' Magnitudes
g', r' and i' magnitudes versus amount of coma included in photometry aperture, for Sep 16 (Gary data); traces of previous date's fit for g' & i' are shown.
From Sep 03 to Sep 16 at g'-band the 80,000 km diameter coma brightened by 0.30 magnitude (vs. the predicted 0.37 mag). At i'-band brightness increased 0.48 magnitude (slightly more than predicted). In other words, the broadband brightness of the comet increased essentially the same amount as predicted by a simple model that takes into account the comet's proximity to the sun and Earth. So there is no brightening due to water ice warming and changing to vapor, causing ejection of dust to the coma (e.g., crossing the "frost line").
Magnitudes for this date, for a coma diameter of 80,000 km:
g' = 14.20 ± 0.02
r' = 13.60 ± 0.02
i' = 13.38 ± 0.02
Converting r' to Rc:
Rc = 13.40 ± 0.03 (80,000 km diameter coma)
which uses the following conversion equations (derived from 9 solar-like stars with accurate Rc & r' magnitudes):
Rc = r' - 0.205, SEi = 0.011
What's the broadband "spectral energy distribution" (SED)?
Comet's spectral energy distribution (SED) for g', r' and i' bands compared with the SED for the sun and sun-like stars. Data of September 16 (using a coma diameter of 80,000 km). Details available from the author.
The Sep 16 coma SED is slightly redder than the SED for Sep 03. This must be due to the coma dust aerosols having an albedo that increases with wavelength. Most molecular emission lines are within g'-band, and since the observed flux in this band is lower than expected under a constant albedo versus wavelength assumption I would say that there is no evidence for molecular emission in the Sep 16 SED.
2013.09.15 Whitmer R-Band Image Analysis
Dennis Whitmer obtained 40 useful images this morning (20 20-sec & 20 60-sec). I've used 14 of the 60-second images to create a GIF animation.
Animation using the first 14 images from the 60-second image set. 14-inch Celestron, binned 2x2.
Below is an analysis using 4 of the 60-sec images for coma's brightness versus diameter.
R-band brightness versus amount of coma included in photometry aperture, for Sep 15 (Whitmer data).
Rc for 70,000 km diameter coma = 13.56.
Oval aperture (using APT) for determining total magnitude.
Total Rc-mag = 12.04 ± 0.03.
2013.09.12 Whitmer R-Band Image Analysis
Dennis Whitmer obtained 5 useful images this morning, and I analyzed the comet coma's brightness versus diameter.
R-band brightness versus amount of coma included in photometry aperture, for Aug 12 (Gary data) and Sep 12 (Whitmer data); trace of previous date's Whitmer fit shows that there was essentially no change from Sep 11 to Sep 12.
The slight fade for Sep 12 compared with Sep 11 (of ~ 0.07 mag) isn't significant, considering that the systematic error uncertainty is estimated to be greater than this.
2013.09.11 Whitmer R-Band Image & Analysis
Three 4-minute exposures, comet aligned. 14-inch, star auto-guided.
R-band brightness versus amount of coma included in photometry aperture, for Aug 12 (Gary data) and Sep 11 (Whitmer data). (The x-axis label should read "Photometry Aperture Diameter [km]")
It appears that the coma is becoming larger in physical size [km] and slightly brighter in the outer regions. Whereas the inner coma (<60,000 km diameter) should have brightened by ~ 0.92 mag it actually faded slightly. The outer coma enlarged and therefore became brighter. The overall brightness faded ~ 0.4 magnitude.
2013.09.03 g'r'i' Images
On this date I obtained ~ 75 images using filters g', r' and i' in rotation. Exposure times were all 30 seconds. The best quality images were obtained between 11:17 and 11:56 UT, when elevation ranged from 11.5 to 19.5 degrees. Here's a "not very colorful" false-color image from the best 39 images. Color balance was established using star-aligned image of a much larger FOV of stars. I used i'r'g' instead of RGB. I pixel edited out 5 stars.
Sep 03, B. Gary, RGB-style (i'r'g') color image, comet-aligned (stars edited out). FOV = 9.6 x 8.9 'arc (north up, east left). g' = 8x30s, r' = 10x30s, i' = 21x30s.
Sep 03, B. Gary, RGB-style (i'r'g') color image (before editing out stars; 1/2 image scale).
Sep 03, B. Gary, average of i'r'g' images (comet-aligned). FOV = 9.6 x 8.9 'arc (north up, east left). g' = 8x30s, r' = 10x30s, i' = 21x30s.
Magnitudes for this date:
g' = 14.46 ± 0.03 (photometry radius = 17.3 "arc (73,400 km)
r' = 13.88 ± 0.02 (photometry radius = 17.3 "arc (73,400 km)
i' = 13.90 ± 0.02 (photometry radius = 17.3 "arc (73,400 km)
Converting from g'r' to Rc & V:
Rc = 13.68 ± 0.03 (73,400 km diameter coma)
V = 14.11 ± 0.04 (73,400 km diameter coma)
which uses the following conversion equations (derived from 9 solar-like stars with accurate VRc & g'r' magnitudes):
Rc = r' - 0.205, SEi = 0.011
V = 0.56 * r' + 0.44 * g' - 0.028, SEi = 0.011
Is the comet SED compatible with the solar SED?
Comet's spectral energy distribution (SED) for g', r' and i' bands compared with the SED for the sun and sun-like stars. Data of September 03 (using a coma diameter of 73,400 km). Details available from the author.
Yes, all three magnitudes are internally consistent with a single albedo value and reflected sunlight. If molecular emission lines were present they would boost the g'-band brightness, leaving the r'- and i'-bands unaffected. The lack of extra brightness at g'-band can be viewed as an upper limit constraint on the amount of molecular emission (at this time).
Does coma size vary with wavelength?
g' and i' magnitude versus photometry diameter (expressed as km within coma).
No, coma size doesn't vary with wavelength enough to be measured by my 11-inch telescope (at ~15 degrees elevation). Specifically, it appears that the coma has the same diameter in g' and i' bands. I think this rules out the idea (suggested to me by Jacub Cerny) that maybe much of the g'-band coma is due to molecular emission which, due to the greater kick-off velocity of molecules compared with dust particles, would produce a larger coma at g'-band compared with longer wavelengths (especially at i'-band, where molecular emission lines are expected to be almost non-existent). If molecular emission were large then a fixed photometry aperture that's smaller than the largest coma size would capture a smaller fraction of the total coma flux at g'-band compared with i'-band. Good suggestion, but this appears to not be the case for Comet ISON at this time.
We are therefore left with the default position, that dust particles are sufficient to account for the coma brightness at all wavelengths (g', r' & i') and that dust albedo does not vary with wavelength.
APT elliptical photometry aperture used to measure flux of comet.
Total Rc-mag = 12.65 ± 0.02. Reduced tRc = 10.33.
2013.08.27 Image
August 27 image by Bruce Gary image. FOV = 20.6 x 15.0 'arc, northeast upper-left. Comet aligned. Stack of 23 20-second exposures.
3-image animation. FOV = 28 x 20 'arc. Each image is median combine of 8 20-sec exposures (comet aligned).
August 27 r'-band magnitude vs. photometry aperture (14 "arc = 62,000 km coma diameter).
For a coma aperture corresponding to 60,000 km, r' = 14.15 (i.e., Rc = 13.94, V = 14.32, assuming solar SED for comet).
APASS doesn't cover this part of the sky so I had to use CMC14 r'-mag's (slow-going for processing).
But what's the meaning of NO BRIGHTENING during the past 16 days? The frost line depends on albedo and thermal conductivity of surface regolith. I guess we could have its frost line to be closer than 2.3 a.u. if its albedo is >90% and gamma >1000! Surely there are ice crystals below the top meter of regolith!
At a photometry radius of ~ 18 - 20 "arc the brightness begins to "flatten out." This corresponds to a coma diameter of ~ 85,000 km. A residual increase will be produced by the tail (which was once part of the coma).
The slope between 4 and 10 "arc radius is 0.55 magnitude per doubling of photometry radius. This magnitude difference corresponds to a ratio of 1.65. Assuming that the speed of dust ejection is constant a coma volume that has twice the radius of a smaller volume should have twice the brightness (flux). Instead, the coma volume defined by a radius of 8 "arc has 1.65 times the brightness (flux) of a volume defined by 4 "arc radius. This could be accounted for by invoking a dust production rate that increases with time.
Extrapolating the magnitude versus radius slope, defined from 4 to 8 "arc, to ~ 0 "arc yields a magnitude for the nucleus of r'-mag ~ 15.6 (or V-mag ~ 15.9). This is 1.67 magnitudes fainter than the coma plus nucleus, or ~20% of the total - which is 1/4th of the coma by itself. If the comet has an albedo of 100% its diameter would be ~ 8 km for it to appear this bright. (This is larger than the 5.0 to 6.5 km estimate based on HST images).
Here's a 23-minute light curve using a 14 "arc photometry radius (62,000 km coma diameter).
Preliminary version of r'-mag vs. time, for a photometry aperture of 13.9 "arc, during 23-minute observing session on Aug 27.
There is no apparent comet rotation in the above light curve. None was expected for this short of an interval, but it shows the kind of precision that will be possible when the observing session is longer (assuming a 14.2 mag brightness).
2013.08.16 Observation
Can see tail in most of the 20-second images. Large photometry aperture (20 "arc) measurement yields r'-mag = 13.93 (i.e., V-mag ~ 14.10, assuming solar SED for comet, vs. 13.3 for JPL Horizons). In other words, the comet is ~ 0.8 magnitudes fainter than the JPL Horizons adopted brightness model (confirming my analysis of Aug 12 data).
August 16. FOV = 12.5 x 9.3 'arc, north up, east left. Median combine of 17 20-second exposures (aligned using comet).
Animation of motion during 20-minutes on Aug 16 (11:29 to 11:49 UT).
Magnitude vs photometry aperture radius for Aug 16 (green), Aug 12 (black dashed) and Aug 12 adjusted to Aug 16 using JPL Horizons brightness model (red dashed).
This plot shows that the coma has the same dimension and shape as 4 days earlier. Due to change in distances (sun-comet & Earth-comet) the comet should have brightened ~ 0.14 magnitude. However, it only brightened ~ 0.06 magnitude, which means that the coma plus nucleus seems to have faded ~ 0.09 magnitude (~9%) compared to a brightness model. The magnitude accuracies are ~ 0.04 magnitude for Aug 12 and 0.02 magnitude for Aug 16 (precision plus systematic), so comparisons between the dates are uncertain by ~ 0.045 magnitude. The suggested "fade" has only a 2-sigma significance.
On this date the comet's distance from Earth was 3.33 a.u., or 498 x 10^6 km. A 55,000 km diameter (27,500 km radius) corresponds to an aperture radius of 11.4 "arc. The r'-mag for this aperture is 14.24 ± 0.03. Converting to Rc-band, using -0.21 ± 0.02, yields Rc-mag = 14.03 ± 0.04.
The plot also shows that the nucleus brightness is > 1.3 magnitudes fainter than the nucleus plus coma. (The JPL Horizons brightness model has the nucleus 1.42 magnitudes fainter.) I don't have the spatial resolution to say anything more about this.
Magnitude vs photometry aperture radius for Whitmer's Aug 16 images (blue squares), and measurements by Gary at same time (red dotted trace).
There is excellent agreement between the Whitmer and Gary r'-band magnitudes versus photometry aperture size on Aug 16.
2013.08.12 Recovery Observation
Here's a stacked image of Comet ISON made 2013 Aug 12, from 11:33 to 11:56 UT (with telescope having effective aperture of ~ 8 inches).
FOV = 32 x 22 'arc, north up, east left. Total number stars ~ 116; faintest has V~ 16.0. Median combine of 23 20-second exposures,
centered on 2013.08.12 11:40 UT. Elevation = 6.0 degrees, airmass = 8.7.
And here's a version where I star-aligned using the comet. The stars are oblong because the comet is moving.
FOV = 11 x 8.5 'arc of median combine using object of interest for image alignment (causing stars to become oblong). Coordinates of object: 08:14:31.81 +24:01:24.7 at 2013.08.12, 11:40 UT.
The images were made with a Celestron 11-inch telescope and SBIG ST-10XME CCD, providing a FOV = 32x22 'arc (the effective aperture was actually ~ 8 inches due to aperture blockage by my dome opening). Elevation = 6.0 degrees, airmass = 8.7. I used a Cb filter (clear with blue blocking), which has an effective wavelength similar to r'-band (also Rc-band), as determined by "star color sensitivity" analyses. It is perhaps noteworthy that in the above image there appears to be the beginnings of a tail, and it's pointed away from the sun (the sun is to left and slightly below this part of the sky).
Return to Main Web Page for November Observations
____________________________________________________________________