ALL-SKY PHOTOMETRY
for YY Gem on 2011.10.28

Bruce L. Gary; Hereford, AZ, USA

This web page describes the all-sky observations and analysis conducted for the purpose of calibrating the YY Gem star field. The observations were made on 2011.10.28 using filters B, V, Rc, Ic, g', r', i' and z'.

Links internal to this web page
    Basic photometry equation
    Observations
    Analysis
   

Basic Photometry Equation

A good starting point for illustrating subtle effects is what I'll refer to as the "generic photometry equation":

   Magnitude = Z - 2.5 × LOG10 ( Flux / g ) - K' × AirMass + S × StarColor  + S2  × AirMass × StarColor                                                                               (1)

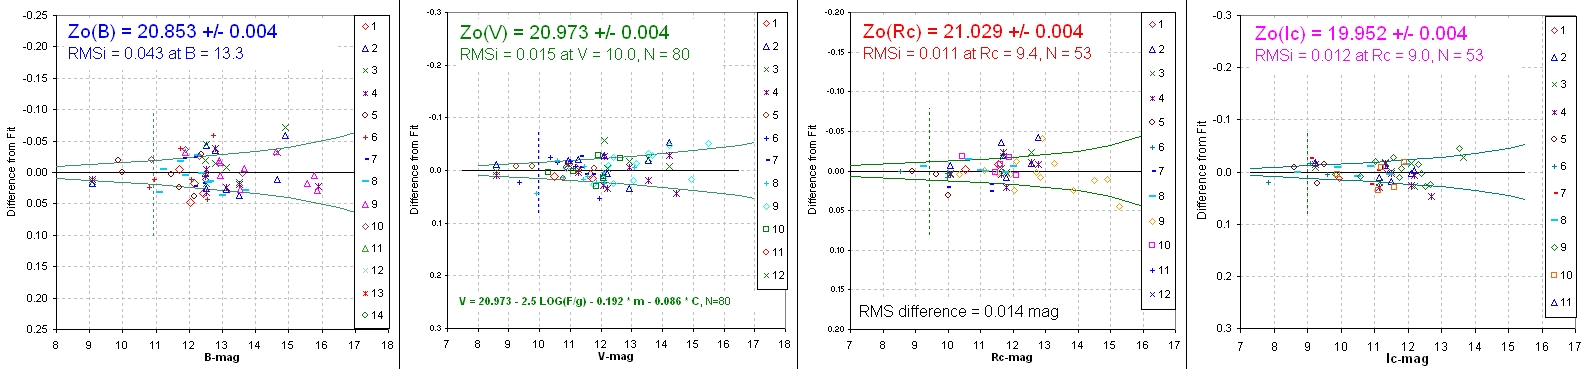
    where Z is a zero-shift constant, specific to each telescope system and filter (which should remain the same for many months),
    Flux is the star's flux (sum of counts associated with the star). It's called "Intensity" in MaxIm DL,
    g is exposure time ("g" is an engineering term meaning "gate time"),
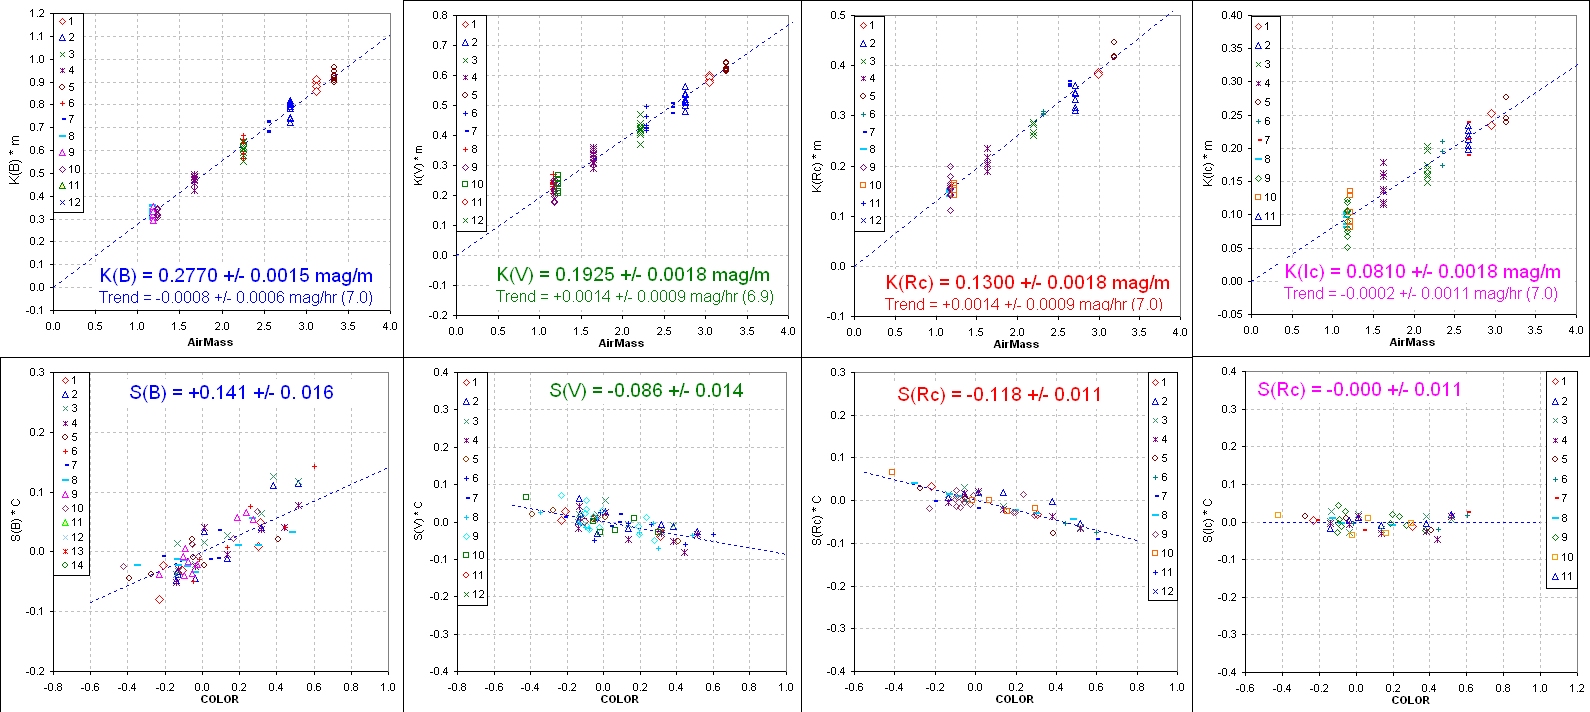
    K' is zenith extinction (units of magnitude per air mass),
    S is "star color sensitivity." S is specific to each telescope system (and should remain the same for many months),
    StarColor can be defined using any two filter bands. B-V is in common use; I use 0.57 × (B-V) - 0.33,
    S2 is a second-order term that is usually ignored because it is only important for high air mass and extremely blue or red stars.

This general equation is true for all filter bands (even unfiltered), though there are different values for the constants for each filter. For example, the magnitude equation for V-band (omitting the last term in Eqn 1) is:

    V = Zv - 2.5 × LOG ( Flux / g ) - Kv' × AirMass + Sv × StarColor                                                                                                                                            (2)

Similar equations exist for bands B, Rc, Ic, g', r' etc. 

Notice that in a "generic photometry equation" for a specific filter there are two terms associated with a telescope system that should remain constant (provided there are no hardware configuration changes). This is illustrated for V-band:

    V = Zv - 2.5 × LOG ( Flux / g ) - Kv× AirMass + Sv × StarColor                                                                                                                                           (3)

Zv and Sv are highlighted in green, and the task of "photometrically calibrating a telescope system" amounts to evaluating these two constants, as well as their counterparts for any other filter band of interest. Since extinction is different each night the K' terms have to be established each observing session; at least this is a common initial response to a review of the above equation.

I've chosen to define StarColor = 0.57 × (B-V) - 0.33 because it is zero for typical stars. This is an arbitrary choice but it is convenient for an iteration procedure I employ (described below).

Observations


A 14-inch Meade LX200-GPS telescope in a dome was used for these observations. The 10-position filter wheel included the following filters: Cbb, B, V, Rc, Ic, u', g', r', i' and z'. All but Cbb and u' were used for these all-sky observations.

Calibrated star fields were chosen that included Landolt (2009) updated magnitudes as well as SDSS calibrations (Smith et al, 2002). Eight of these star fields were observed, providing 60 stars with B and V magnitudes, 53 Rc and Ic magnitudes, and 22 stars with SDSS magnitudes. Some star fields were observed for several cycles. Each observing cycle consisted of 5 B-filter images (15-sec exposure time), 5 V-filter images (10-sec), 4 Rc images (5-sec), 4 Ic images (4-sec), 3 g' images (5-sec), 3 r' images (5-sec), 4 i' images (5-sec) and 4 z' images (15-sec). For YY Gem shorter exposures were used. The YY Gem observations continued for more than 5 hours, which provided welll-established extinction plots for each filter band.

Analysis


The B, V, Rc and Ic extinction plots are shown in the next figure. The slopes of K'×m correspond to the extinction coefficient K' for each filter. The extinction trend solution is also noted in the figure information box. The second row of panels shows star color sensitivity plots from which Sf values are determined. All SE values are determined using a chi-square analysis.


Data were accepted if their "difference from fit" / "model SE" > ~ 4. The "model SE" for each band is shown in the next figure. Note that SE increases with magnitude.


Related Web Page Links
    AAVSO photometry manual: http://www.aavso.org/observing/programs/ccd/manual/4.shtml#2
    Lou Cohen's 2003 tutorial: http://www.aavso.org/observing/programs/ccd/ccdcoeff.pdf
    Priscilla Benson's (1990's) CCD transformation equations tutorial: http://www.aavso.org/observing/programs/ccd/benson.pdf
    Bruce Gary's CD Transformation Equations derived from basic princples: http://reductionism.net.seanic.net/CCD_TE/cte.html
    Bruce Gary's All-Sky Photometry for Dummies: http://brucegary.net/dummies/x.htm
    Bruce Gary's All-Sky Photometry for Smarties - v1.0:
http://brucegary.net/photometry/x.htm
    Bruce Gary's All-Sky Photometry for Smarties - v2.0:  http://brucegary.net/ASX/x.htm
    Bruce Gary's Differential Alternative Equations http://brucegary.net/DifferentialPhotometry/dp.htm
    Bruce Gary's Astrophotos home page http://reductionism.net.seanic.net/brucelgary/AstroPhotos/x.htm
    Bruce Gary's All-sky Tutorial for latest procedure:  http://brucegary.net/allsky2011/  

____________________________________________________________________

WebMaster: Bruce L. GaryNothing on this web page is copyrighted. This site opened:  2011.11.01  Last Update:  2011.11.01