BROTHER BRUCE'S WIERD BELIEFS CONCERNING THE GENERATION OF CLEAR AIR TURBULENCE
Bruce "Bertie" Gary
1999
Synoptic Scale Vertical Compression as a Model for Producing CAT
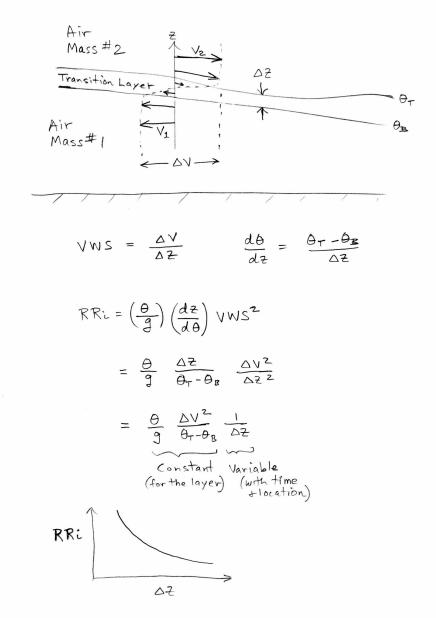
Imagine an upper air mass sliding over a lower air mass, and consider the interface layer separating them. In the following figure refers to RRi, or Reciprocal Richardson Number, defined as 1/Ri (where Ri is the commonly used Richardson Number). I explain elsewhere why I prefer the use of RRi over Ri (it has to do with my observationalist's perspective).
Figure 1. Sketch showing the effect that changing thickness of transition layer has on the layer's Reciprocal Richardson Number, RRi.
The air masses are moving in different directions, and the interface layer has vertical gradients for all properties in which the air masses differ. The profile of wind speed is illustrated here. Potential temperature is another property that will vary across the interface. These two gradients will vary inversely with layer thickness, as indicated in Figure 1. Reciprocal Richardson Number, RRi, varies with the square of the vertical gradient of wind, but only with the first power of the vertical gradient of potential temperature. Hence, as the layer thickness changes, RRi will vary inversely with layer thickness. Layer thickness will vary not only with location, but also with time at a given location.
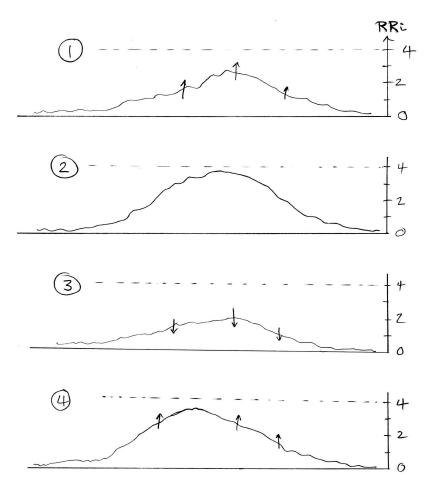
Figure 2. RRi verus horizontal location within the transition layer (usually an inversion layer), for 4 times.
In Figure 2 we are imagining a large synoptic scale expanse of the interface,
and we first ask how is RRi likely to vary along a cross-section.
The middle of the cross-section is where the interface layer is thinnest,
which is wehre RRi is the greatest. Over time, however, the weight
of the upper air mass will create a compression of the interface layer,
causing it to oscillate in thickness, varying on timescales of perhaps
many hours. The sequence 1 through 4 is meant to convey this oscillation.
The critical condition of RRi = 4 is indicated, and in Figure 2 the compression
has not caused any part of the layer to exceed RRi =4.
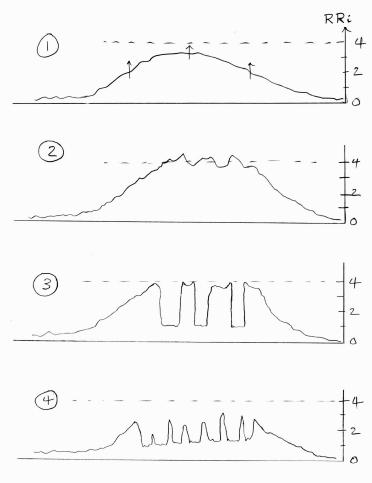
Figure 3. Later, at another 4 times times in the history of our hypothetical transition layer, the RRi(x) profiles show RRi reaching the critical value of 4 at a few locations, triggering CAT there, after which RRi is reduced to 1.
In this sequence the synoptic scale compression causes a few regions to exceed RRi = 4, leading to CAT. After CAT completely mixes the transition layer, the gradients of wind and potential temperature are changed, and in this simple rendition I have shown that in the middle of the layer the vertical gradients are are reduced to values that correspond to RRi = 1. (In this I am guided by my reading of what theoreticians claim should happen.) If compression proceeds, more regions becme unstable and produce CAT, causing large areas to reach RRi = 1. When compression subsides, the entire RRi pattern lowers.
In reality, the vertical profile of such tracers as potential temperature and wind will be complicated during the evolution of CAT. Just when compression has brought RRi past the critical value of 4 at the middle of the interface layer, the altitude profile of wind and potential temperature may look like Figure 4.
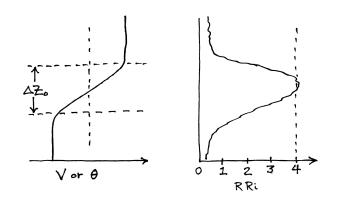
Figure 4. Altitude profile of "tracers" wind (or potential temperature) throughout the transition layer just prior to the triggering of CAT by RRi exceeding 4.
After the middle of the layer becomes unstable it produces CAT that is confined to the middle of the interface layer. The CAT partially homogenizes the wind and temperature field, leading to the profile of Figure 5.
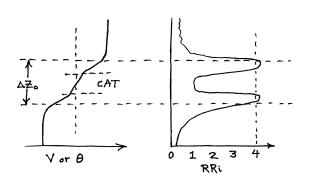
Figure 5. V(z) and theta(z) profiles after the middle of the transition layer has been mixed by CAT.
Now there are two RRi maxima since the CAT washed out most of the vertical gradients within the initial altitude region of CAT. These two shallower regions are unstable, and produce their own CAT layers, leading then to the profile in Figure 6.
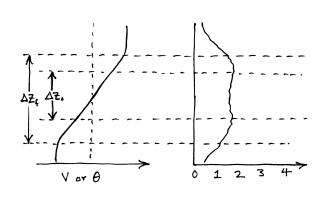
Figure 6. V(z) and theta(z) profiles after the entire transition layer has been mixed by CAT.
This is the "final" altitude profile for such "tracers" as wind or potential temperature. Notice that the final interface or transition layer is thicker than the original layer. Since the change of wind and temperature change the same amount over a larger altitude region RRi is less than the critical value throughout the transition, and the layer is thus stable. Referring back to Figure 1, the region of shallow interface transitions naturally thicken, and CAT is the process that keeps the two air masses "safely" apart. In effect, if you are inclined to anthropomorphize mechanical nature, you could say that the atmosphere solved its own instability problem by thickening the transition layer from one that was unstable to one that is stable. How clever Mother Nature is!
A sequence of altitude profiles of wind and temperature like the one presented here as Figures 4 to 6 was "common knowledge" during the 1960s, during the heyday of CAT studies. What I will take blame for, however, is the synoptic scale compression pictures in Figures 1 to 3.
Rolling Tubes
In this treatment I've omitted the very important early and brief phase of CAT generation that can be called "rolling tube" phase (Parks, et al, 1984). When RRi exceeds 4, a swath of the transition layer "overturns" and forms a rolling tube. We can imagine that the "tube" twists, and distorts itself in ways that causes a break-up of the tube pattern and leads to portions of the original tube that continue to spin with an axis that quickly takes on faast changing orientations. Eventually, the spinning tubules create a multitude of spinning tubulettes, having spin orientations that are random. The spectrum of sizes for these spinning air parcels, now exhibiting isotropic orientations, quickly "spreads" to smaller and smaller scales. This is how the classical picture of mature CAT is arrived at, where the energy spectrum of spatial motions has a -5/3 slope. The entire process, from the rolling tube to isotropic, mature CAT, may take only a few minutes.
Aircraft encounters with rolling tubes is rare, but when they happen the consequences can be deadly! If the rolling tube is approached from the direction in which the downward moving edge is encountered first, the aircraft will be pushed down abruptly, causing unbelted people to hit the ceiling. A few seconds later, when the aircraft exits the rolling tube on its other side, the air is moving in the opposite direction and the passengers hit the floor. I suspect that this rare "rolling tube" phase kills more people than the mature CAT phase, even though it's encounter is rare.
Any CAT warning system will have to prove itself for encounters with rolling tubes, if the goal is to reduce CAT fatalities. If the goal is to reduce the incidence of CAT encoutners, then systems that merely warn of CAT patches will be sufficient ... in my humble opinion.
References
Parks, E. K., R. C Wingrove, R. E. Bach and R. S. Mehta, "Identification of Vortex Induced Clear Air Turbulence Using Airline Flight Records," AIAA 22nd Aerospace Sciences Meeting, January 9-12, 1984, Reno, Nevada.
Dewan, 1981, "Turbulent Vertical Transport Due to Thin Intermittent Mixing layers in the Stratosphere and Other Stable Fluids," Science, 211, 1981 March 6.
__________________________________________________
Other CAT-related links:
Patents, 2 of which describe CAT warning and avoidance
AIAA'81, CAT & Decreasing Ri in squeezed Inversion Layer
AIAA'84, CAT Probability for T(z) Shape
Severe C-141 CAT Encounter of 1982 December 8
RRi from INS Winds & MTP Lapse Rate
Moderate ER-2 CAT Encounter of 1991 August 14
WB57 Event of 1998.04.11 Exhibiting Vertical Compression, Low Ri & CAT
~~~~~~~~~~~~~~~~~~~~~~~~~~~~~~~~~~~~~~~~~~
This site opened: August 25, 1999. Last Update: October 30, 2003