
VERTICAL COMPRESSION AND CAT:
EVIDENCE FOR AN ASSOCIATION USING MTP/WB57 DATA
Introduction
The following describes a small portion of a WB57 flight where clear air turbulence, CAT, was encountered in association with a region of "disturbed" isentropes. The properties of the isentrope disturbance appear to be consistent with a crude theory for CAT generation.
The following material is the result of a mere few hours of analysis,
and it is made available as a web page for the purpose of soliciting an
opinion from dynamical meteorology experts concerning the matter of whether
the data is of sufficient interest to warrant further analysis. I
am untrained in dynamical meteorology, so this is a first step in bridging
the gap between my observational competence and someone else's dynamical
meteorolgy competence.
Figure 1. Ground track for flight WB980411. The wide line segment corresponds to 61.5 to 63.1 ks (17.08 to 17.53 hrs UT).

Figure 2. Outside air temprature, OAT (red trace) and aircraft pressure altitude (blue trace) versus time for the flight segment of interest.
A superficial interpretation of the temperatrue oscillations (61.95
to 62.7 ks) would be that KH waves are present. However, at least
the first wave, and last two waves appear to be produced by altitude excursions.

Figure 3. Isentrope altitude cross-section for the flight segment of interest. The black trace is aircraft altitude. Isentrope surfaces are 5 K apart.
The isentropes don't show waves; rather, the aircraft oscillates in altitude through a field of insentropes that are free of oscillations that correlate with the above temperature oscillations. Howeever, the isentropes are sloped steeply down (with increasing time), and a vertical compression is apparent near flight altitude starting at approximately 62.1 ks (seen more clearly in the next two figures). The highly sloped isentrope surfaces imply the existence of strong horizontal gradients of wind speed (this has not been verified, yet).
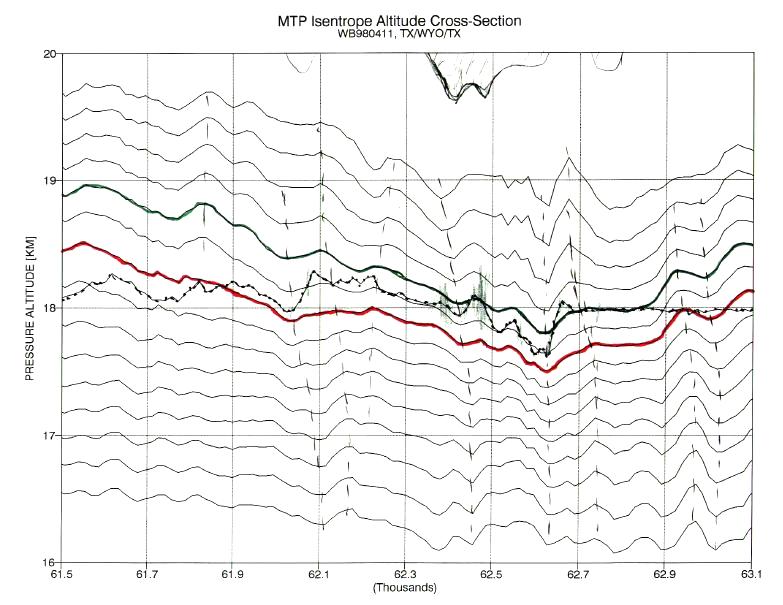
Figure 4. Isentrope altitude cross-section for the flight segment of interest, with two isentropes highlighted (465 and 475 K). Phase lines for peaks and valleys of isentrope displacements are hand drawn with dashed lines. At the top of the graph is an inverted trace of turbulence intensity.
The presence of an isentrope displacement pattern indicates that the
air is undergoing vertical oscillatory motion, characteristic of either
inertio-gravity waves or mountain waves. This wave pattern superimposes
itself upon a vertical compression of a region near flight altitude, perhaps
triggering KH waves that breakdown to produce CAT. The KH waves must
have a horizontal wavelength too short to be captured by the MTP data,
which has a sampling interval of 3.2 km. If the horizontal wavelength
were shorter than about 10 km, the MTP isentropes would not show them.

Figure 5. Thickness of the 465 to 475 K isentrope layer (thick green trace) and turbulence intensity (arbitrary untis, thin red trace).

Figure 6. Vertical wind shear, VWS, based on a patented technique relying upon the correlation of the U and V wind components with theta. The flight interval is longer than for the previous graphs.
.png)
Figure 7. Richardson Number. When Ri decreases below
1/4 a precondition is met for KH wave amplification and possible breakdown.

Figure 8. Reciprocal Richardson Number. When RRi exceeds the value 4 a precondition is met for KH wave amplification and possible breakdown. RRi is a better-behaved parameter, from an observationalist's standpoint, than Ri.
From the above plot of Reciprocal Richardson Number, RRi, it is possible to account for the generation of CAT by the breakdown of KH waves that were amplified within the vertically compressed layer. At 62.5 ks, when CAT intensity was maximum, there still were periods of high RRi. Mature CAT will produce very low values of RRi, so the high values encountered here imply that the CAT was "young," perhaps confined to shallow layers, and had not yet homogenized a thick layer. This is consistent with the fact that the isentrope surfaces had not been forced apart, vertically, according to MTP data (Fig's 3 and 4).
The pattern of CAT occurring in a region of vertical compression, with sufficient vertical wind shear to produce KH wave growth and subsequent wave breakdown, is consistent with a crude theory for CAT generation which I describe in the following web page: CAT & Compression Theory.
____________________________________________________________________
This site opened: February 9, 2000. Last Update: February 10, 2000