YY Gem Photometry
Bruce Gary, Hereford Arizona Observatory
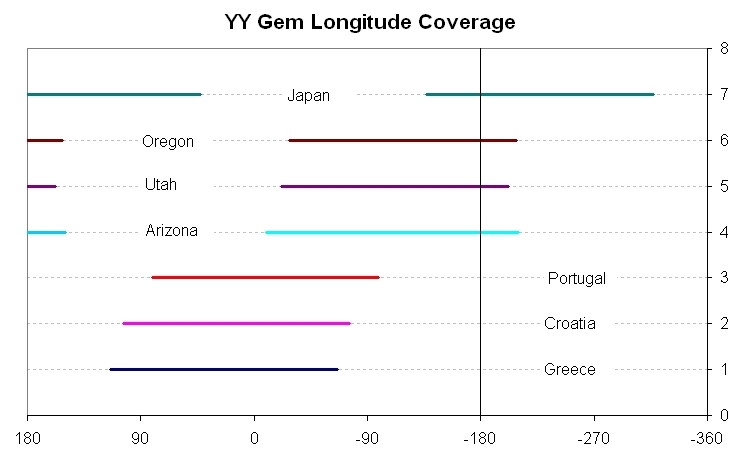
YY Gem is a pair of M dwarfs in a 19.5-hr orbit that transit each other. Their radii are inexplicably larger than model predictions, which is typical of M dwarfs. This discrepancy has been explained by invoking magnetic fields but observational support is lacking. During Jan 3-12, 2012, Dr. Hebb performed spectropolarimetric observations of YY Gem in order to determine the magnetic field strength and brightness distributions of both components. At Dr. Hebb's request I assembled a team of advanced amateurs and coordinated photometric monitoring during her 10-day professional observing dates. The amateur light curves are currently being used by Dr. Hebb to constrain solutions for brightness distribution on the stars (i.e., starspot maps). This web page is an archive of those amateur observations, as well as unrequested follow-on observations by amateurs whose curiosity was aroused by unexpected results from the scheduled observations. 

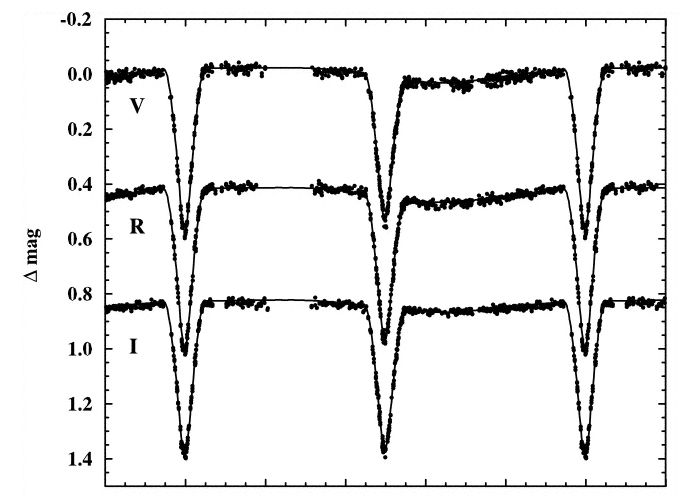
Published light curves show that transit depths are about the same for primary and secondary transits, b
oth transit depths decrease with wavelength and a small out-of-transit (OOT) variation is present. Flaring activity has been noted but not systematically studied. The amateur observations of this investigation are higher quality than all previous investigations; they have better wavelength coverage (B- to z'-band), essentially continuous multi-band monitoring during the 10-day observing period, and additional frequent observations for more than one year.

The transit identified as secondary a decade ago is now deeper than the other transit. The tentative explanation for this is that starspots at critical longitudes have changed during the past decade. This explanation has additional support from recent observations (November, 2012) showing that the OOT pattern has changed significantly during the past 8 months, as have the two transit depths - which implies very dynamic starspot activity! This, in turn, suggests that at least one of the YY Gem components is magnetically active. Indeed, during the October to mid-December, 2011 observations (for refining observing procedures) flaring was absent, but during the scheduled 10-day intensive monitoring period (Jan 3-12, 2012) flaring was very common. Because of these observations we have confidence in identifying the 2011/12 deepest transit as the historically identified "secondary" transit. This permits the determination of a greatly improved ephemeris, accurate to ~ 1 millisecond. It is anticipated that observations by amateurs will continue throughout the 2012/13 observing season for the purpose of monitoring OOT and transit depth changes on a monthly basis.
Links to Sections on This Web Site
    Publication summarizing results: SAS 2012 also Sky&Tel article about this pro/am collaboration 
    Science Goal
    Photometry Goal  
    Coordinates and Magnitudes
    Brief Summary of Results
    More Detailed Preliminary Results
    Observation Dates Summary
    Finder Image & Calibrated Mag's
    Instructions for Observers  
    Filter Passband Considerations  
    Observers  
    Some Published Results  
    References   
    GJ 2069A Light Curves (another web page)
    What's New? with YY Gem photometry analysis (another web page)

    Individual Light Curves for Pre-10-day and Post-10-day  (another web page)
   Jumping Off Page for 10-day Light Curves (another web page)  - this is the path for viewing all of the 10-day intensive observing period light curves.

   
Science Goal
(as described by Dr. Leslie Hebb, Vanderbilt University (currently at University of Washington):

"I have observing time on the CFHT 3.6-meter telescope (Mauna Kea) on January 4-13, 2012 to observe the well known M dwarf EB, YY Gem. The project involves getting time series spectropolarimetric observations of YY Gem which will allow us to measure the magnetic field strength on the surface of the components of the binary. One of the most compelling problems in stellar astronomy to appear in the last decade is that the radii of M dwarf stars are larger than models predict by about 5-10%. This is thought to be due to the magnetic activity on the stars, but no one has yet been able to confirm this. Thus, the goal of our project is to determine if and how the magnetic fields affect the radii of the low mass stars at the most fundamental level by actually measuring the magnetic fields of stars in a bright, well studied EB that are known to have enlarged radii. These would be the first magnetic maps of an M dwarf EB with properties (mass, radius, Teff) that are so well determined. In addition, these data will provide brightness maps of the surface of the stars through a technique called Doppler imaging."

"The project requires coincident time series photometry so that we can (1) rederive the stellar parameters by modeling the EB with the star spot positions and brightness known from the spectropolarimetry, and (2) determine small scale star spots through eclipse mapping techniques if the photometry is good enough. I need high precision photometry, and want observers to observe in different bands so we can do the best possible modeling."


Photometry Goal:  During the January 3-12 measurements it is important to document the OOT shape and is attributed to star spots or other causes for non-uniform brightness across the EB surface. Flares have been observed (U-band), so we want to know if any flare activity is occuring during the January observations. Good quality transit and eclipse shapes will be used for constraining models of EB sizes, shapes, orbits, limb darkening, etc.

The photometry LC observations are to be made at filter bands B, V, Rc, Ic and g', r', i', z'. Each observer is assigned a filter or filter sequence. Ideally, continuous coverage during the 10-day observing period would have been useful, but a reasonable compromise wais to try to get
LC observations for times that are observable in Europe, America and Asia. The observing team provided coverage from Eastern Europe, Western Europe, USA and Japan. If we had been lucky with the weather we could have obtained continuous coverage for most of the 10-day observing window. Dr. Hebb's observing time began January 4, 05 UT and ended at January 13, 16 UT. 

 Coordinates, Magnitudes and Ephemeris:
    RA/DE = 07:34:37.3 +31:52:09, "observing season" is centered on January 13.
    V = 8.99, Ic ~ 7.10 (Leung & Schneider, 1978). J = 6.073, K = 5.236 -> B = 9.7, V = 8.4, Rc = 7.69, Ic = 7.05 (Warner & Harris, 2007). This and other determinations are included in the table below.
Ref Star #1 (07:34:26.3, +31:51:00)
B
V
Rc
Ic
g'
r'
i'
z'
UCAC3a
J
K
Bt
Vt
B-V
Published catalogs


9.683
8.267(21)
7.688(18)
11.312
10.069

Based on above
11.014(Tycho)
9.984(UCAC3),
 9.957(Tycho),9.96(JK)
9.445(JK)
8.976(JK)


All-sky, 2011.10.28
10.917 ± 0.020
9.947 ± 0.016
9.419 ± 0.013
8.988 ± 0.016


+0.970 ± 0.026
Conversions from all-sky BVRcIc
Jester et al (2005)


10.409 ± 0.020*
9.650 ± 0.030*
9.459 ± 0.045*
9.318 ± 0.045*


Consensus (final in bold)
10.917 ± 0.020
9.947 ± 0.016
9.419 ± 0.013
8.988 ± 0.016
10.409 ± 0.020*
9.650 ± 0.030*
9.459 ± 0.045*
9.318 ± 0.045*

8.267 ± 0.021
7.688 ± 0.018


+0.970 ± 0.026

YY Gem
B
V
Rc
Ic
g'
r'
i'
z'
UCAC3a
J
K
B-V
Published

8.99(L&S), 8.4(JK)

7.10(L&S)


8.533
6.073
5.236

Based on above

9.07 (UCAC3)

7.05 (JK)


All-sky, 2011.10.28
10.451 ± 0.018
9.062 ± 0.013
8.156 ± 0.009
7.193± 0.012
9.775± 0.020*
8.589± 0.030*
7.912± 0.045*
7.342± 0.045*


+1.389 ± 0.023
Consensus (final in bold)
10.451 ± 0.018
9.062 ± 0.013
8.156 ± 0.009
7.193± 0.012
9.775± 0.020*
8.589± 0.030*
7.912± 0.045*
7.342± 0.045*

6.073 ± 0.0??
5.236 ± 0.0??
+1.389 ± 0.023
 I conducted an all-sky observation on 2011.10.28 using B, V, Rc, Ic, g', r', i', z' filters. Eight Landolt star fields were observed (60 stars), that included SDSS calibrated magnitudes (22 stars). More description is given at all-sky calibration.   g'r'i'z' mag's with * after SE are conversions from BVRcIc (Jester et al, 2005)

Torres & Ribas, 2002 (TR2002) performed a comprehensive analysis of YY Gem transit observations from 1925 through 1999 (a span of 73 years), consisting of 57 primary and 55 secondary transits.  They corrected Leung & Schneider, 1978 observations for a couple presumed mistakes, and these revised transit times are included in the TR2002 analysis. Their final ephemeris for primary transits is:

    HJD = 2449345.112327(87) + E * 0.814282212(12)                                                                                                                                                                                            (1)

Brief Summary of Results

Here is a list of results from my "amateur analysis" of this work's amateur photometric observations (as of 2012 Nov 9):

1) Transit depths for primary and secondary had reversed values during the 2011/12 observing season compared with 1949 and 1971 observations (i.e., secondary transit depth is now greater).
2) Transit depths changed significantly 8 months later (2012 Oct/Nov); both depths decreased but the secondary is only slightly greater than the primary depth .
3) Starspots in 2011/12 are significantly different from 1949 and 1971, based on out-of-transit (OOT) shapes.
4) Starspots changed significantly during the 8 months separating the 2011/12 observing season and 2012 Oct/Nov, based on a doubling of OOT amplitude of variation.
5) Flare activity was low in late 2011 but active in 2012 January. It again appears to be low (2012 Oct 30 to Nov 2).

An article describing the amateur photometry observations and their analysis was published (May, 2012) in the Proceedings of the Society for Astronomical Sciences (SAS), and can be viewed using the link in the Reference section of this web page (bottom of page). 

A professional analysis is being performed by Dr. Leslie Hebb of both the amateur photometry observations described here and spectropolarimetric observations conducted with the CFHT 3.6-meter observatory in Hawaii by Dr. Leslie Hebb. When this article is published everything on this web page will be superseded. 

Results in More Detail

Sample Light Curve of Primary Transit (last one taken)


Latest LC of a primary transit, showing shape and a small OOT variation. The previous LC was made 3.2 years earlier (2012.12.12) and it was also 1.2 minutes "early" using the same ephemeris. Both also have the same depth 530 & 528 mmag). The only thing different is the OOT variation, which was greater near primary transit in 2012 than 32015, implying that the starspots move in longitude.

Ephemeris

I recently analyzed 48 transits made between 2011 October and 2012 November (a span of 1.1 year) by the amateur team that I coordinated and have determined the following ephemeris:

    BJD = 2455935.10364(2) + E * 0.81428310(31)

Using the TR2002 ephemeris (eqn 1, above) to predict 8093 epochs ahead yields 2455935.09827(13). The present work has transits occurring 7.7 ± 0.2 minutes later. This is statistically significant, and it may be explained by a very different starspot situation (as shown by the OOT shape and depth relationships). I therefore am not willing to interpret the 8 minute discrepancy in terms of an ephemeris revision; instead, I will suggest (below) that this discrepancy is caused by a large starspot that affects primary transit egress.

Transit Depths vs. Wavelength

Previous transit depth determinations (Kron, 1952 and Leung & Schneider, 1978) showed depth decreasing with wavelength. For example, the LS78 V-band depths are 610 and 543 mmag, with the deeper depth being the primary.  The present investigation also shows depth decreasing with wavelength. However, a surprise awaited us.


Figure 1a (left panel). Transit depths for 2011 Oct-Dec ("2011") and 2012 Jan ("2012").
Figure 1b (right panel). Same transit depths as in left panel, but also showing 1971 depths by LS78. Symbols "S" and "P" are for 2012 Oct-Nov.

In the above figure the left panel tells the story that the secondary transit is deeper than the primary one! This surprising result puzzled us for several months. Dr. Hebb suggested that this might be caused by starspot changes. This theory gains credibility by the dramatic change in transit depths 8 months later, as shown by the "P" and "S" symbols that are based on observations between 2012 Oct 30 and 2012 Nov 2. In just 8 months both transit depths decreased, but the secondary transit depth decreased much more than the primary one.  As I suggest below, the recent decrease in primary transit depth may be due to the growth of a large starspot.

Phase-Folded Light Curves for 2011 Oct to 2012 Jan

Here's an example for Ic-band, made before the 10-day January observations:

  
Figure 2. Phase-folded LC for Ic-band, for all Ic-band data in the archive (as of 2011.12.31). Notice that the secondary transits is deeper than the primary.

 
Figure 3. Tentative fit to Ic-band transits. 

Here's a folded LC for all g'-band observations:


Figure 4. g'-band folded light curve, derived using assumption that "air mass curvature" at g'-band is -22 mmag/airmass for all dates. The OOT variation has a peak-to-peak amplitude of 37 mmag.

     
Figure 5a. Same data as in previous plot, but scaled to emphasize OOT variation. Assumes air mass curvature is -22 mmag/airmass.


Figure 5b. Phase folded for 8 r'-band LCs. 


Figure 5c. Phase folded for 10 i'-band LCs. 


Figure 5d. Phase folded for 8 z'-band LCs. 


Figure 6. Amplitude (1/2 of peak-to-peak) of out-of-transit (OOT) variations.

Phase-Folded Light Curves for 2012 Oct - Nov

Joao Gregorio and I have resumed observing YY Gem at the beginning of this observing season for the purpose of refining YY Gem's period. To my surprise, the OOT shape and transit depths have changed since the last observation 8 months earlier. Consequently I plan on conducting g' and z' observations once a month, on 4 consecutive nights, for the purpose of monitoring starspot changes. Joao is observing with a V-band filter. Here's the phase-folded g'-band LC that so surprised me.


Figure 7. g'-band phase-folded light curve for 2012 Oct 30 to 2013 Jan 07. The OOT variation has a peak-to-peak amplitude of 108 mmag (vs 36 mmag for 2012 January).

And below is the z'-band phase-folded LC from the same ? observing dates.


Figure 8. z'-band phase-folded light curve. The OOT variation has a peak-to-peak amplitude of ~ 45 mmag.

"Stay tuned" to this web page for monthly updates.

Starspot Model for 2012 Oct/Nov

Warning: I am an amateur, so you should assume that I'm prone to making mistakes due to the shortcomings of any amateur attempting something new that is rightly the reserve of professionals.

Since OOT minimum is at phase ~ 0.14 we can infer that a starspot is located at a longitude that is nearest star center (as viewed from Earth) for one of the stars at this phase. If OOT exhibits an additional real fade near phase  0.68 (as suggested by the g'-band phase folded LC, Fig. 7) then one of the stars must have a starspot at a longitude corresponding to this phase. There is a theoretical case for expecting starspots to be confined to mid-latitudes (e.g., 45 degrees) for stars within a mass range that includes M dwarfs (Granzer et al, 2000).  Following TR2002, I adopted an inclination of 86.3 degrees. I've created a really crude model representing starspot affects, and if I allow the latitude of both starspots to be constrained to between 40 and 50 degrees I get the following solution:


Figure 9. g'-band OOT data averaged for 5% phase bins, fitted by a 2 starspot model with latitude constrained to 40 - 50 degrees and temperature difference of 200 K.

 
Figure 10. Model image of g'-band starspot model of previous figure (for 2012 Oct 30 to Nov 19)..

If Spot #1 is located on the star being eclipsed during the primary transit, then according to this model the spot is large enough to affect the primary transit depth and egress shape. Notice that the flux from both stars begins to fade before primary ingress (phase ~ 0.87, Fig. 9).  Such a geometry will decrease primary transit depth, and shift the mid-transit time to a later time. This, indeed, is what we have observed (when adopting the high quality ephemeris of TR2002).

The z'-band phase-folded light curve for the same date region (~ Nov 1, Fig. 8) shows a smaller OOT variation. This is expected due to the fact that a fixed starspot temperature difference will have a smaller flux ratio (inside spot to outside spot) at z'-band than g'-band. This illustrated using a black body Planck function plot for photospheric temperature (3820 K, according to TR2002) and starspot temperatures that are cooler by hypothetical amounts of 100 K and 200 K.


Figure 11. Black body Planck function showing flux for star surface brightnesses of 3820 K (photospheric model) and two hypothetical starspot temperatures.

This graph allows us to predict that starspot effects at z'-band should be ~ 60% of their effects at g'-band (e.g., (1.00 - 0.79) ÷ (1.00 - 0.65)). Inspection of Fig.'s 7 and 8 shows that the ratio of the OOT variation at z'-band is ~ 50% (55 mmag ÷ 105 mmag) compared to the g'-band variation. The difference in variation is therefore compatible with the starspot explanation.


Figure 12. z'-band phase-folded light curve for 2012 Oct 30 to Nov 19. The OOT variation has a peak-to-peak amplitude of 44 mmag (vs 18 mmag for 2012 January).


Flare Activity

Prior to the 10-day intensive observing dates we observed for 56 non-overlapping hours. During this time only one small flare was observed. This corresponds to a flare activity level of 0.2 ± 0.2 flares per nominal 10-hour observing session.

During the 10-day intensive observing dates we observed a total of 180 non-overlapping hours, during which 20 flares were detected. Most of these hours consisted of observations by several observers using different filters. This allowed for an analysis of flare intensity versus wavelength. This corresponds to a flare activity level of 1.1 ± 0.2 flares per 10 hours, which is a ~5-fold increase in flare activity.

Here's an example of a light curve exhibiting a flare.


Figure 21. Light curve of 2012.01.06 by Srdoc, showing a flare at 26.2 UT.

And here's a "zoom" of the flare event:


Figure 22. Expanded version of previous LC's flare region, showing detail of the flare's rise and decay structure.

The flare rise is 2.6 minutes, from onset to peak, and the 1/2-life decay rate is ~ 8 minutes.

The same flare was observed at a shorter wavelength by several observers. Here's a Bs-band light curve:


Figure 23. Light curve of same date by Zambelli at a shorter wavelength, Bs-band, showing the dramatically greater flare intensity at short wavelengths.

Flare intensity is 660 mmag at Bs-band, versus the 150 mmag at Rs-band. This was the second largest flare observed by us, and it was feasible to measure intensity at the long wavelengths. The next figure shows this flare's behavior at 7 filter bands.


Figure 24. 10 LCs of the flare date, with 7 showing the flare and it's change with filter band.

Here's a plot of flare intensity versus wavelength:


Figure 25. When plotted on a log-log scale the flare intensity varies in a linear manner with wavelength.


Figure 26. This flare occurred on the first of the 10-day intensive observing dates, during secondary ingress. It's intensity is ~ 900 mmag.

A level of high flare activity started sometime after December 29 and before January 3. It was maximum on January 3/4 and subsided slowly throughout the 10-day of intensive observations. No flares were observed on the last of the 10 days, January 13/14.


Observation Dates Before and After 10-day Intensive Monitoring Run

Here's a list of all YY Gem observations before and after the 10-day January intensively monitored observing run. (A list of obserations made during the 10-day run can be found at status.)

YYYY.MM.DD Duration Observer Band  Primary/secondary    Depth          Miscellaneous

2013.02.06     10.4 hrs     Gary             g'           Secondary                                582 mmag , 1 small flare (130 mmag) during egress

2013.01.07     11.8 hrs     Gary             g'           Secondary                                585 mmag , 1 small flare (70 mmag)
 
2012.12.13     10.2 hrs     Gary             g'           Primary                                    547 mmag , 2 small flares  


2012.12.12     10.4 hrs     Gary             g'           Primary                                    529 mmag , no flare  

2012.12.11       9.6 hrs     Gary             g'           Primary                                    542 mmag , no flare     


2012.11.23  8.5 hrs Gary     g'    secondary            575 mmag, 90 mmag flare
2012.11.23  8.5 hrs Gary     z'    secondary            5?? mmag, no flare

2012.11.19  2.1 hrs Gary     g'    oot                  no flares
 
2012.11.19  2.1 hrs Gary     z'    oot                  no flares

2012.11.12  8.1 hrs Gary     g'    secondary            539 mmag, no flares 
2012.11.12  8.1 hrs Gary     z'    secondary            547 mmag, no flares

2012.11.02  7.2 hrs Gary     g'    primary              525 mmag, no flares
 
2012.11.02          Gary     z'    primary              517 mmag, no flares

2012.11.01  6.1 hrs Gary     g'    OOT                  No flares
 
2012.11.01          Gary     z'    OOT                  No flares

2012.10.31  7.1 hrs Gary     g'    secondary            572 mmag, no flares
 
2012.10.31          Gary     z'    secondary            540 mmag, no flares

2012.10.30  6.7 hrs Gary     g'    OOT                  No flares 
2012.10.30          Gary     z'    OOT                  No flares

2012.04.07  4.3 hrs Gary     i'    primary              531
± 2 mmag   No flare

2012.02.11  9.1 hrs Gary     i'    secondary            580
± 2 mmag   No flare

2012.01.03 to 2012.01.17  Listing of 77 Light Curves (multi-band, many observer) for 10-day intensive monitoring: http://brucegary.net/yygem/status.htm

2011.12.29  9.4 hrs Gary     g'    secondary            636 ± 8 mmag   Flare 62 mmag  
2011.12.29          Gary     r'    secondary            612 ± 7 mmag   Flare 21 mmag
2011.12.29          Gary     i'    secondary            584 ± 7 mmag   Flare  0 mmag
2011.12.29          Gary     z'    secondary            555 ± 7 mmag   Flare  0 mmag

2011.12.28  4.7 hrs Srdoc    Vs    primary              545 ± 3 mmag

2011.12.27 10.1 hrs Gregorio Ic    primary              
536 ± 2 mmag

2011.12.27  9.6 hrs Srdoc    Rs    primary              
538 ± 3 mmag

2011.12.26  6.1 hrs Foote J  Ic    primary

2011.12.26  8.8 hrs Foote C  Ic    secondary (& p)     
2011.12.26 11.1 hrs Gary     Ic    secondary (& p)      582
± 3 mmag

2011.12.23 10.7 hrs Srdoc    R+    primary              540
± 1 mmag

2011.12.23  7.3 hrs Garlitz  Rs    primary              553 
± 3 mmag

2011.11.27  8.8 hrs Gary     B     primary
             558 ±  7 mmag   BJDo = 5892.7610
2011.11.27          Gary     V     primary              562 ± 10 mmag   BJDo = 5892.7613
2011.11.27          Gary     Rc    primary              564 ±  9 mmag   BJDo = 5892.7614
2011.11.27          Gary     Ic    primary              549 ±  9 mmag   BJDo = 5892.7616
2011.11.27          Gary     z'    primary              546 ± 11 mmag   BJDo = 5892.7608

2011.10.28  4.5 hrs FooteC   B     secondary            

2011.10.28          FooteC   V     secondary
2011.10.28          FooteC   Rc
      secondary
2011.10.28          FooteC   Ic    secondary

2011.10.28  5.7 hrs Gary     B     OOT
2011.10.28          Gary     V     OOT
2011.10.28          Gary     Rc    OOT
2011.10.28          Gary     Ic    OOT
2011.10.28          Gary     z'    OOT

2011.10.24  3.8 hrs FooteC   Ic    
secondary            569 ± 1 mmag 
2011.10.24  3.7 hrs FooteJ   Ic    secondary            571 ± 1 mmag 
2011.10.24  6.6 hrs Gary     Ic    secondary            574 ± 1 mmag   

2011.10.20  3.2 hrs FooteJ   Ic    secondary
2011.10.20  3.5 hrs Gary     Ic    secondary
           565 ± 2 mmag 

Note: The "OOT offset" from true can be used to assess the feasibility of combining non-overlapping LC segments - provided there is no real OOT structure. Previously published LCs show OOT strutcture, so I don't know how useful it will be to search for constancy of "OOT offset" values for each observer/filter combination. A possible strategy for overcoming this uncertainty is to compare "OOT offset" values taken at the same phase (e.g., always straddling secondary transit). Another possible strategy is to compare "OOT offset" differences between observers for same LC segments.

Combined Light Curves

Here's a precise secondary LC shape:


Shape of secondary transit (Ic-band).

Individual Light Curves
(a separate web page)

Finder Image & Calibrated Magnitudes


Figure 28. YY Gem (red circle) and reference star #1 (green box) with
all-sky solutions for B, V, Rc, Ic magnitudes. The other stars have B,V,Rc,Ic magnitudes given in the table on the right. This is an Rc-band image (median combine of nine 3-sec exposures). FOV = 18 x 19 'arc, north up, east left. Notice bright Castor, at V-mag 1.6, a mere 71 "arc away. The upward spike is due to "saturation bleeding" whereas the pattern of fainter light in four directions is due to "pixel edge reflections." In order to keep the downward pixel reflections from contaminating the YY Gem sky background annulus I've rotated the CCD assembly 10 degrees counter-clockwise.

Instructions for Observers

In this section I'll describe what I've found "works for me" when observing this challenging target.

YY Gem is 71 "arc from Castor at position angle 165 degrees. There's a 7.4 magnitude difference, so Castor reflections are capable of ruining the YY Gem sky background levels. I have had good luck rotating my CCD assembly ~ 10 degrees counter-clockwise (as viewed from behind). This rotation caused a counter-clockwise rotation of the star field, and thus moved YY Gem away from Castor's pixel reflection pattern (see above image).

Because YY Gem is bright (V-mag ~ 9.1), unbinned observing allows exposure times to be 4 times longer than 2x2 binning. Even unbinned, with my 16-inch aperture my exposure times were short: B = 4 sec, V = 2 sec, Rc = 3 sec, Ic = 4 sec, 5 sec. Only one star is used for reference, Ref#1 in the above image, and since it is fainter than YY Gem you only have to assure non-saturation for YY Gem.

I've settled on an observing sequence consisting of 5 filters in alternation, which allows for LCs to be derived for bands B, V, Rc, Ic, z'. It's not necessary to alternate after just one exposure per filter; I expose 5 images for each filter before moving to the next.

I typically observe whenever a target is above 15 degrees elevation. For an object at YY Gem's declination this means my local hour (LHA) can range from -6.2 to +6.2 hours. For observing sites with latitudes north of mine (+31.4 deg.) a larger LHA range is possible (provided the mount permits it). I have found that photometry is free of detectable sky brightness systematics whenever the sun is below -11.5 degrees (which is 55 minutes after sunset, for me). On January 6, for example, YY Gem rises through 15 deg. EL 24 minutes after the sun goes below -11.5 deg. EL, and observing is forced to end due to the sun rising through -11.5 deg. EL when YY Gem is still at +21 deg. EL. Thus, at my latitude the longest observing session will be 11.5 hours (LHA from -6.0 hrs. to +5.5 hrs.). On January 13 UT YY Gem is at EL +16 deg when the sun is low enough beow the horizon to observe (LHA = -6.0 hrs.) and YY Gem is at +16 deg. EL when the sun becomes close enough to the horizon to terminate observing (LHA = +6.0 hrs). Incidentally, on Jan 9 the moon passes 13.5 degrees from YY Gem. B-band will be affected the most on this date.

Data file submission format is the same as for PAWM, described in the "Data File" section at:
http://brucegary.net/WDE/WDtargets.htm#Submission_Data_Format


Filter Passband Considerations

Not everyone uses Johnson-Cousins BVRcIc filters; however, almost everyone has SBIG RGB filters. The SBIG B has a slightly longer effective wavelength than the Johnson B (450 vs 440 nm), and it has a wider passband. The SBIG G has the same effective wavelength as the Johnson V-band filter (540 vs 540 nm)
, but it has a wider passband. The SBIG R has the same effective wavelength (640 vs 640 nm), but it has a more square passband shape. Therefore, the SBIG G and R filters are similar to the Johnson V and Cousins Rc filters, respectively. The filter passbands are shown in the following graphs.


Figure 29. Filter passband shapes.

Every telescope system has a unique passband shape for every filter, no matter how "standard" the filter is. This is due to wavelength dependent transmission of SCT corrector plates, focal reducers, CCD QE function and atmosphere quality. The only way to know how close a "telescope system passband response function" is of each filter to a standard filter passband is to observe a field of calibrated stars and inspect the relationship between instrumental magnitude difference from true magnitude and star color. When the slope of this scatter plot is zero, the effective wavelength is the same as for the standard filter's passband effective wavelength. Here are some examples of such plots for my telescope system.

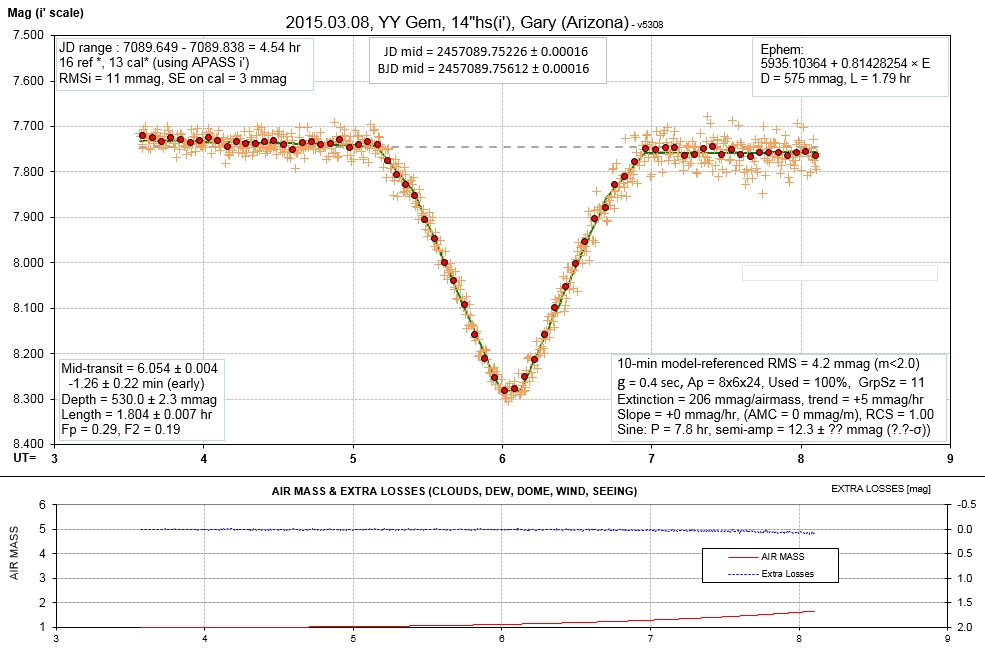
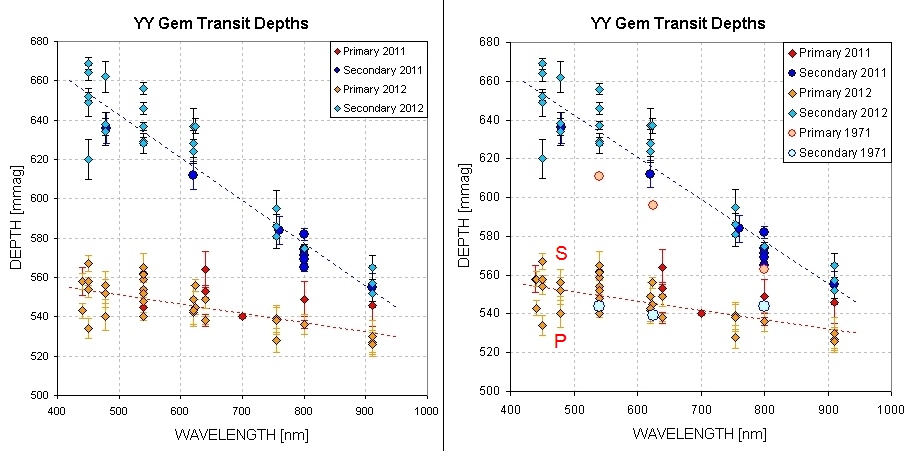
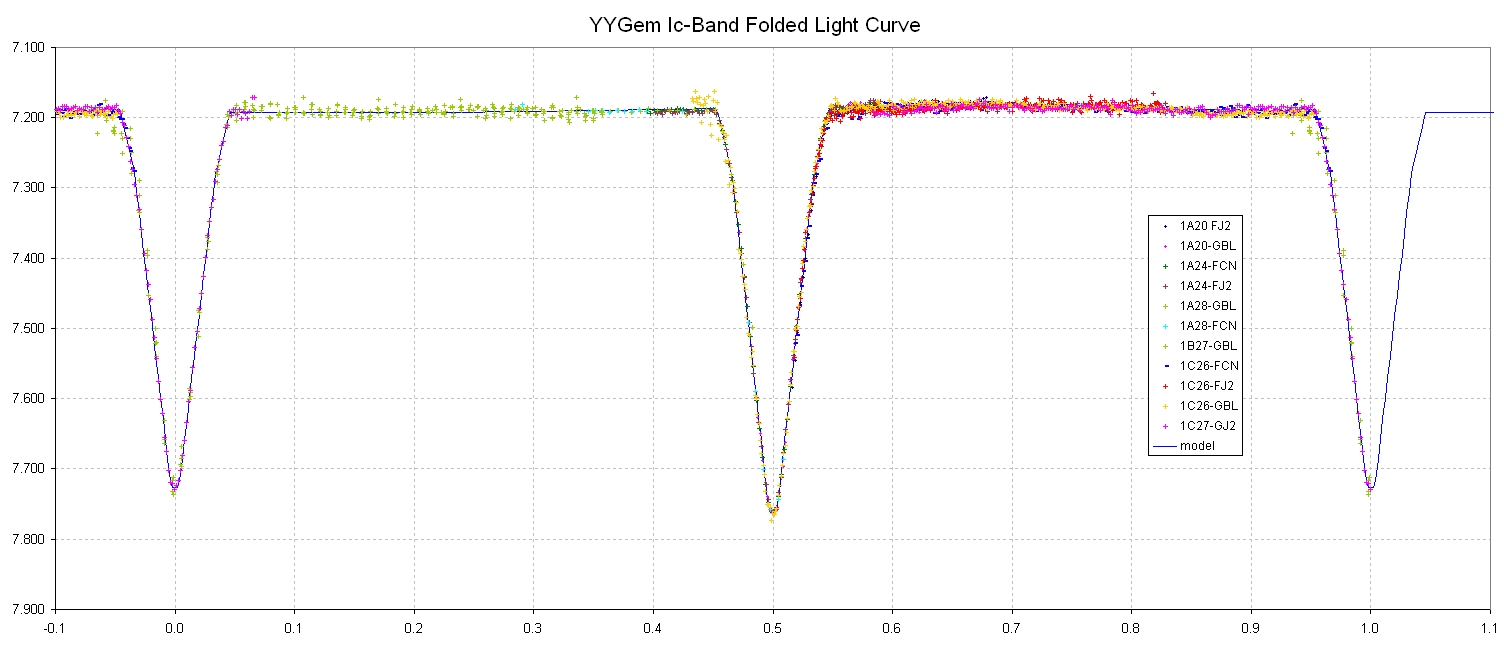
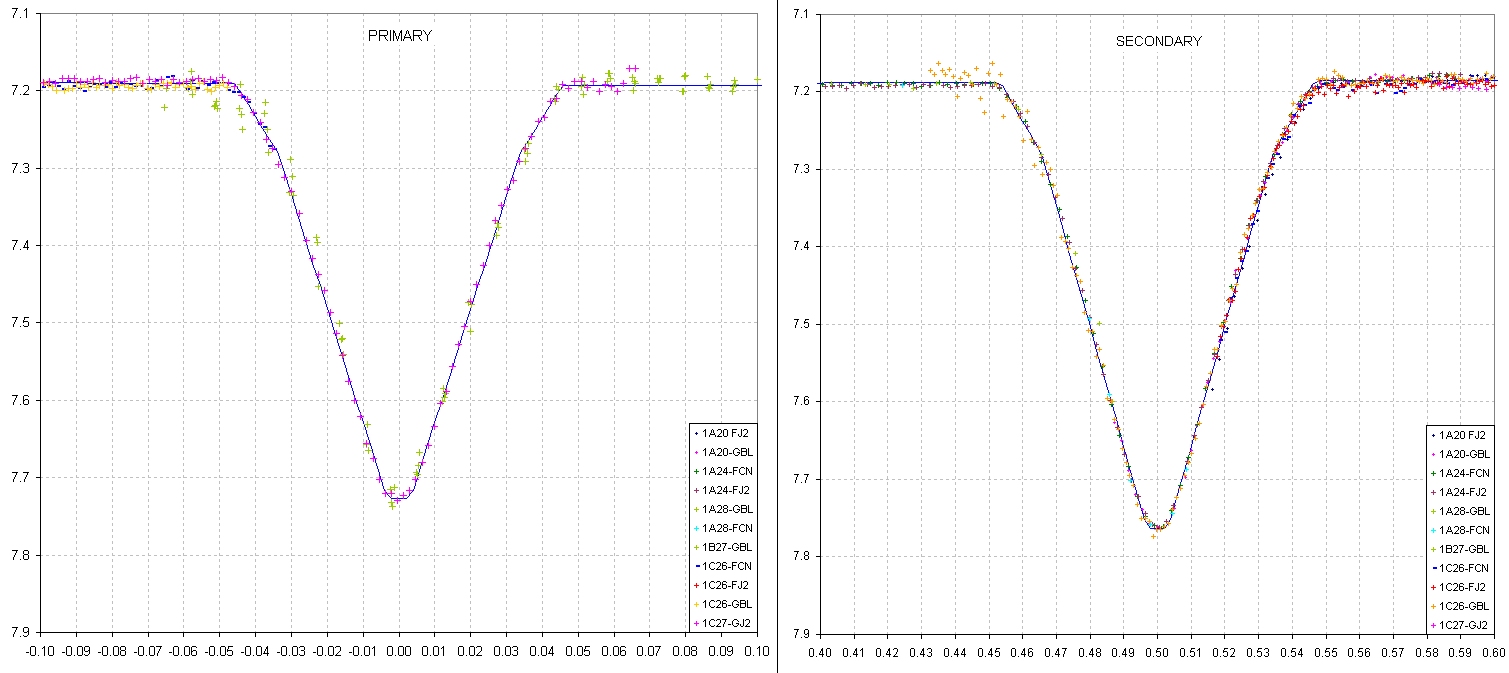
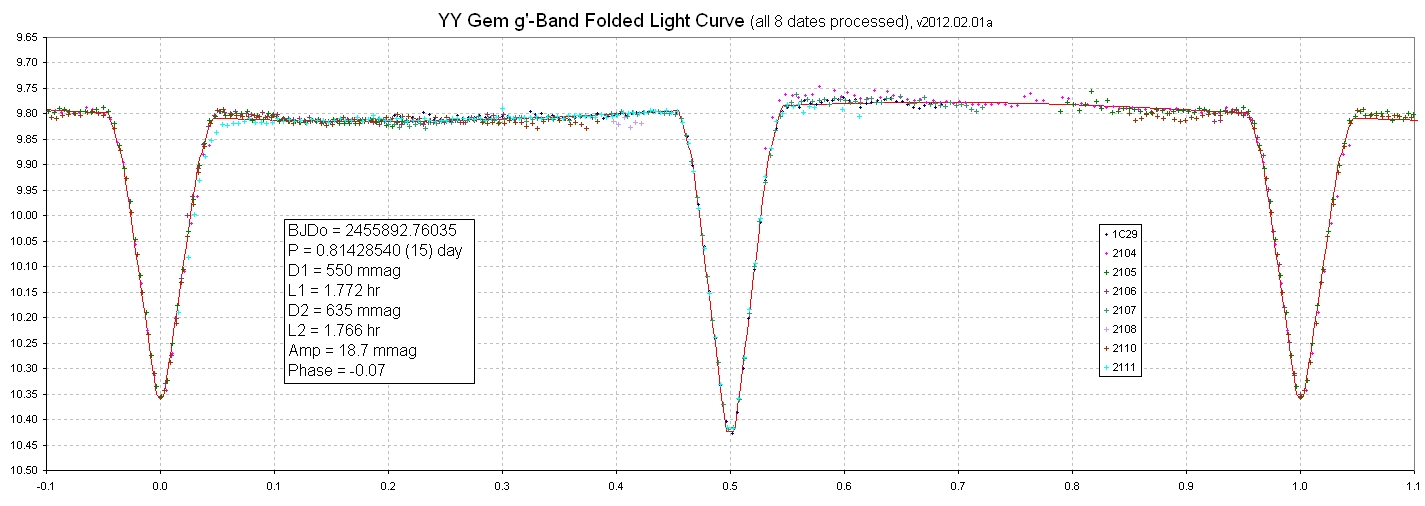
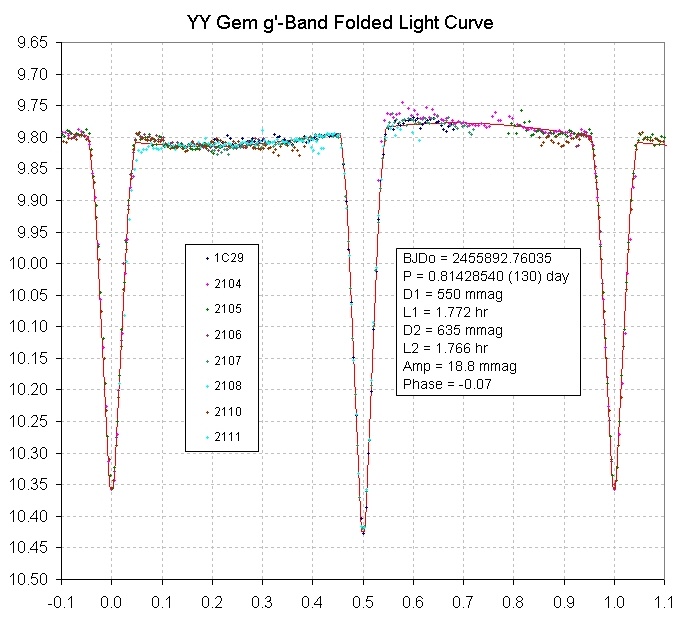
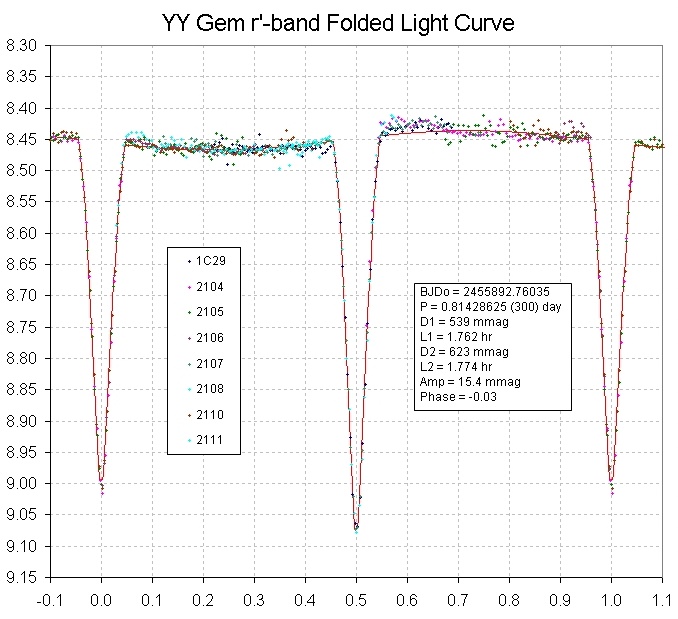
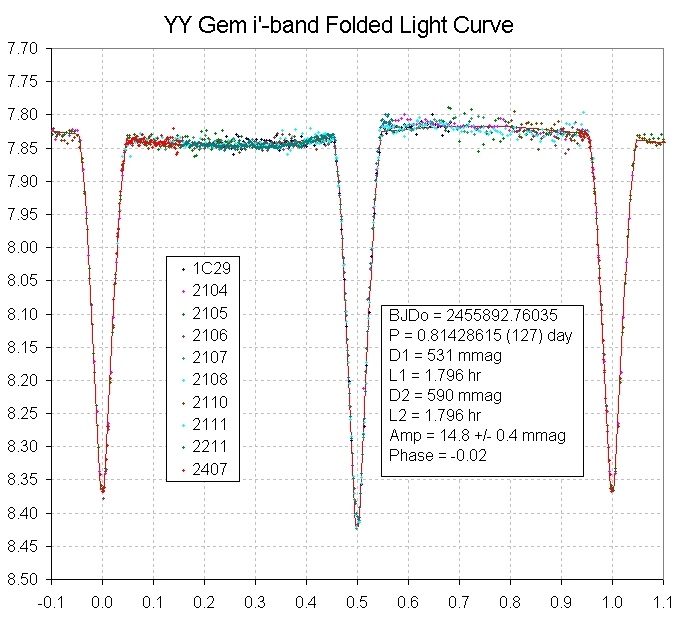
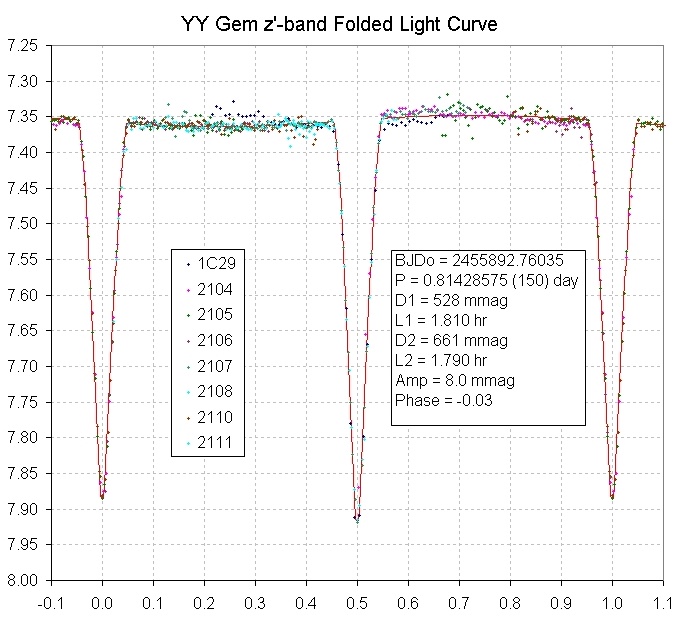
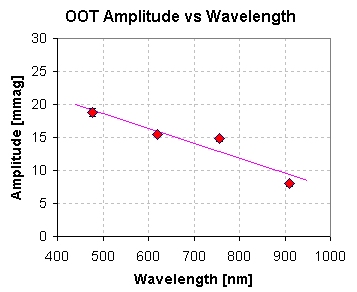
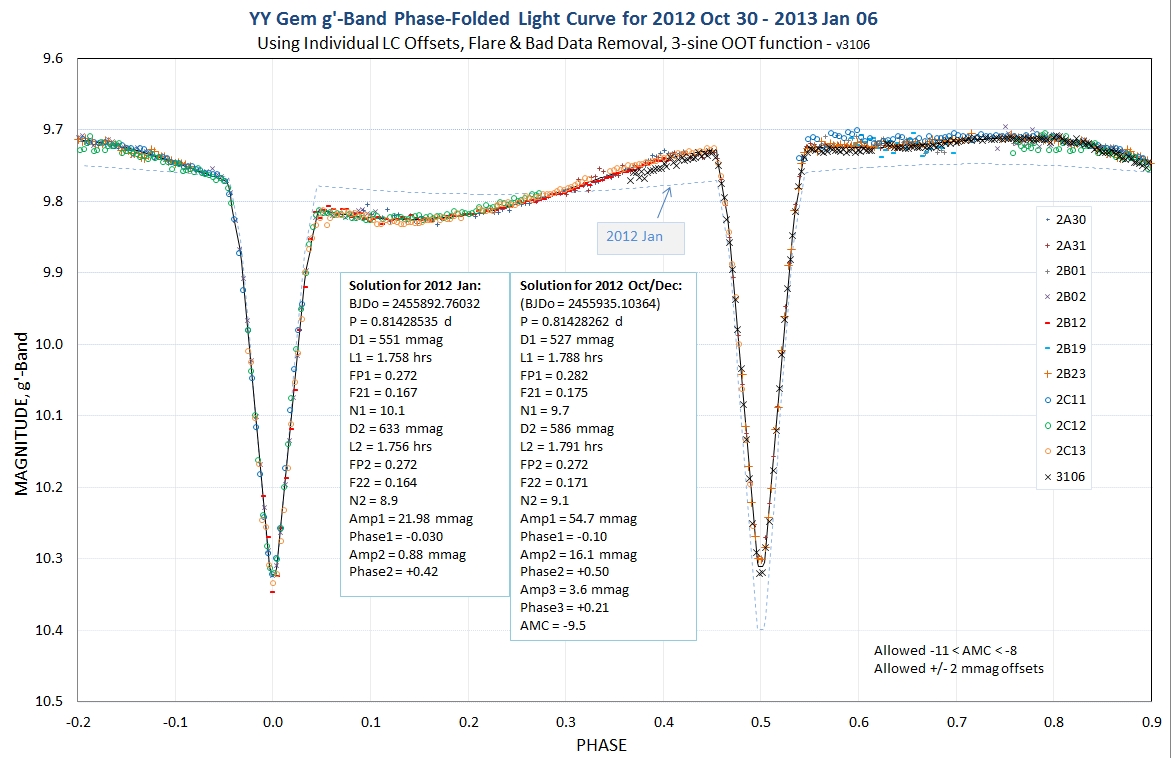
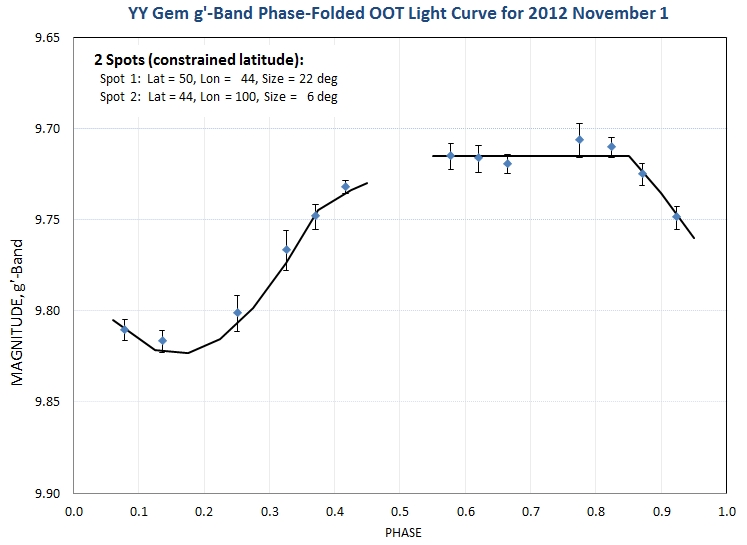
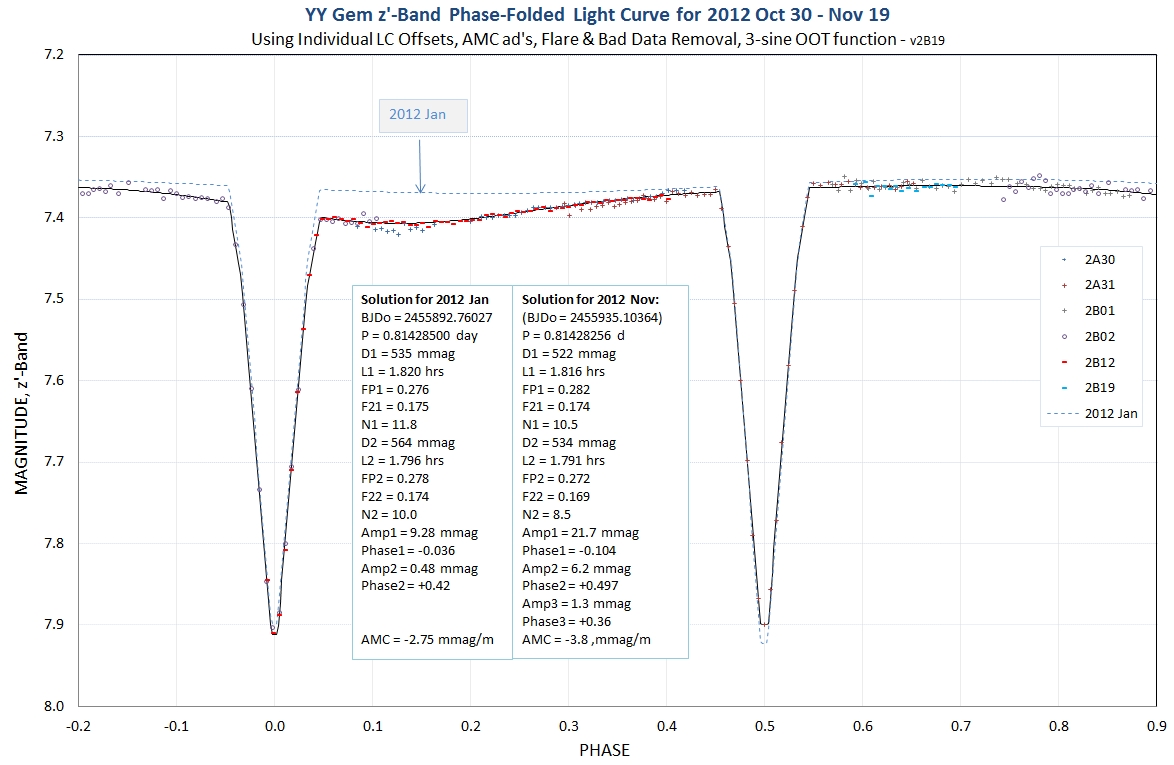
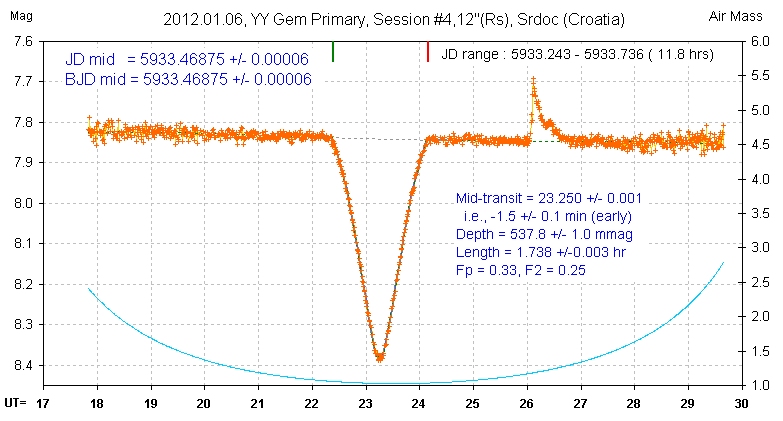
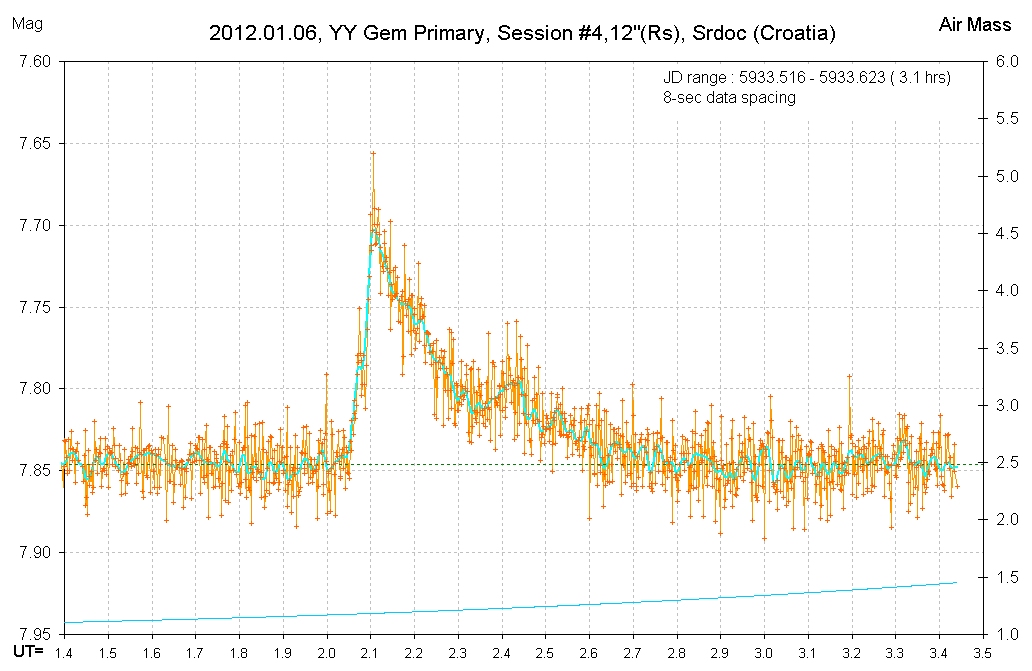
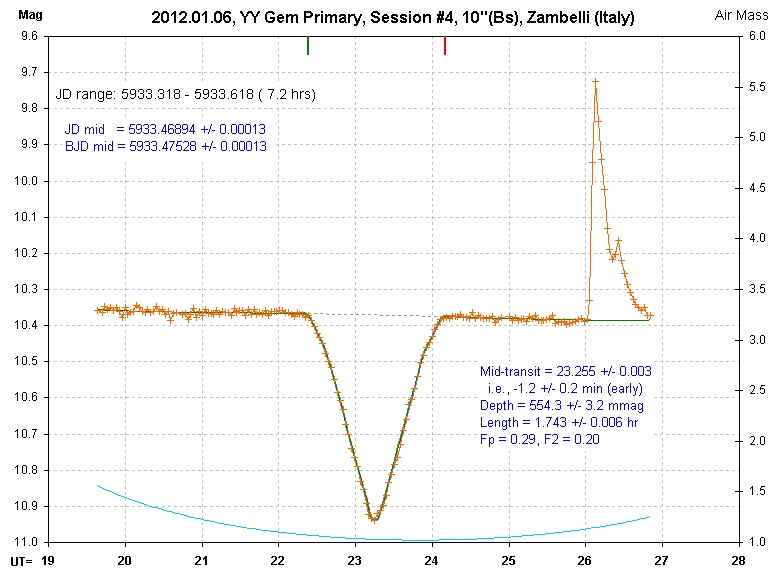
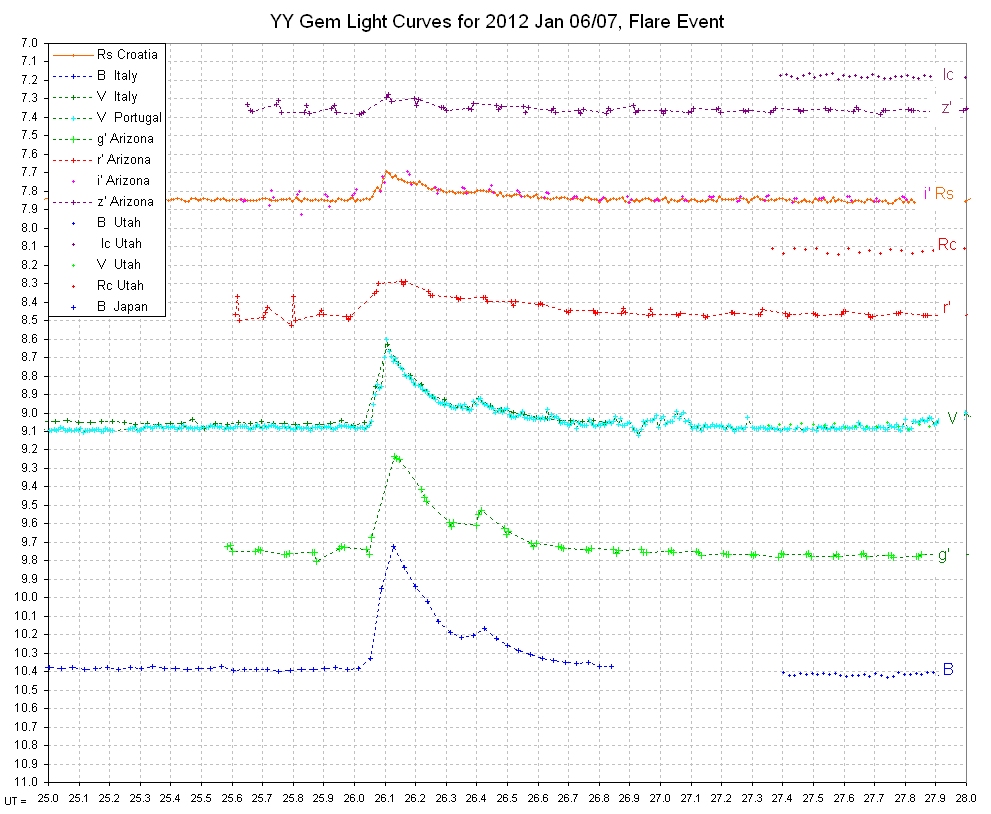
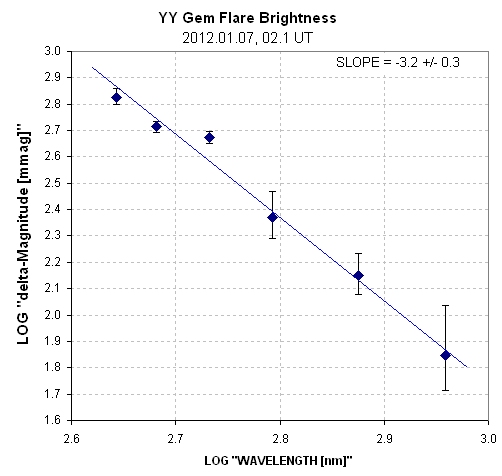
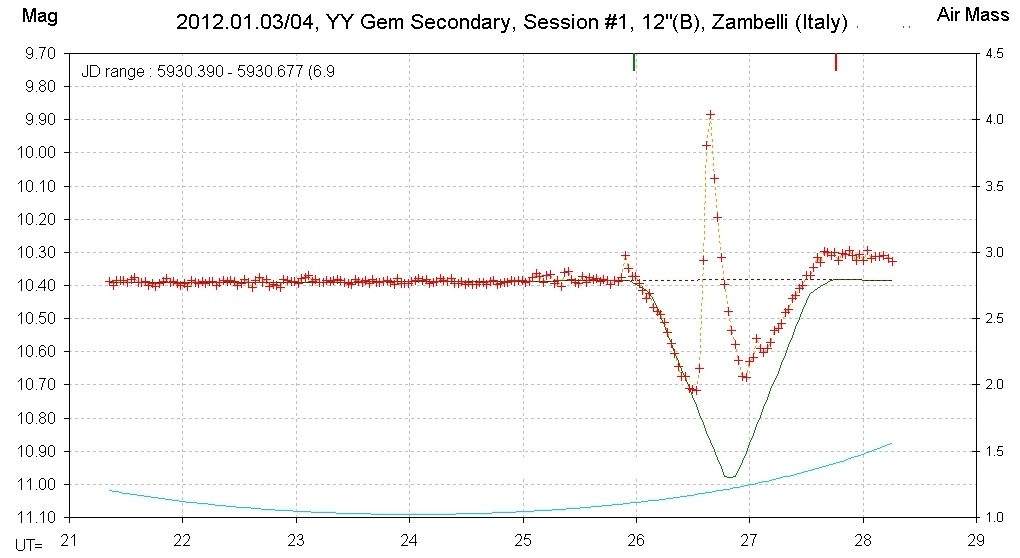
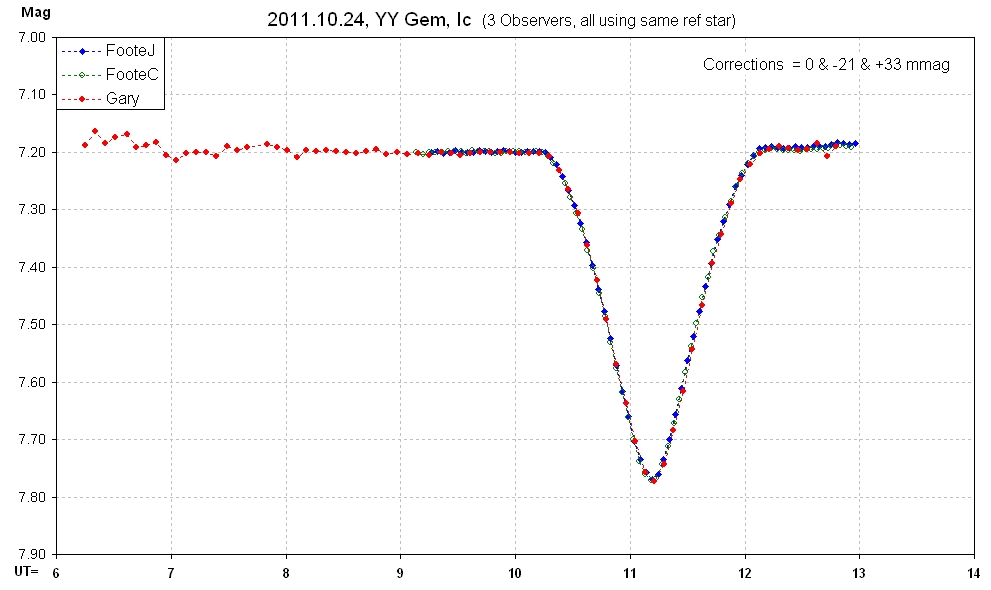
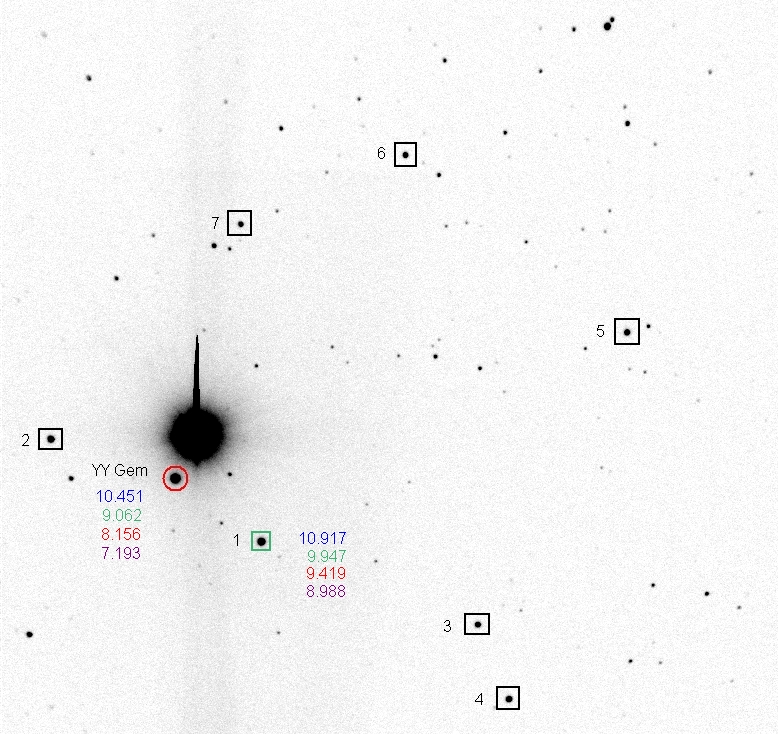
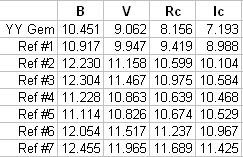
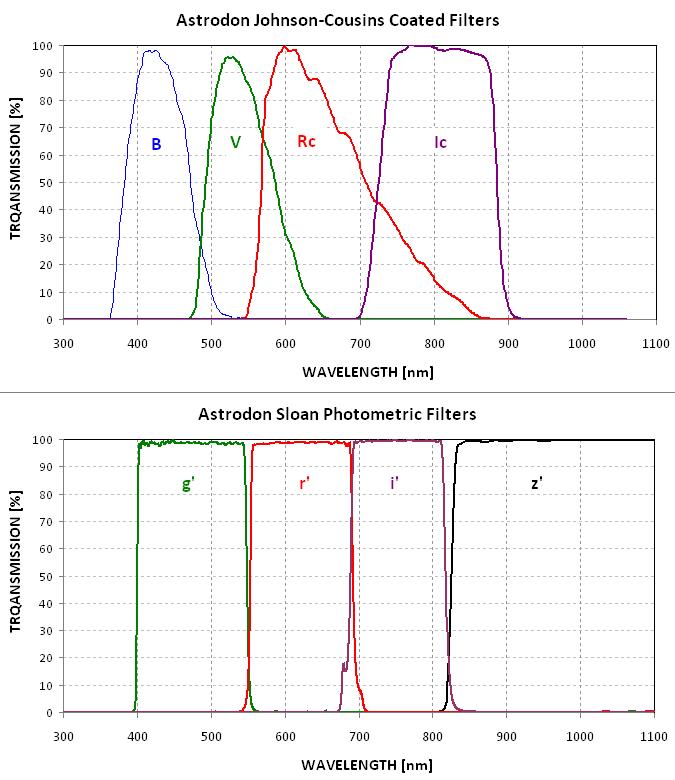
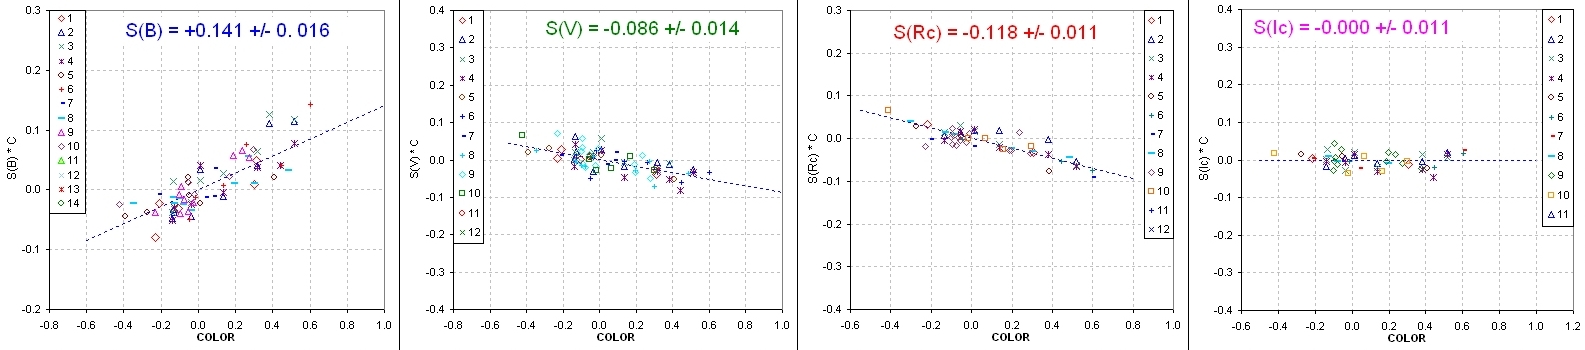
Figure 30. All-sky star color dependencies used for estimating effective bandwidth of various filters (as described in the text).

Since my Ic star color sensitivity is zero, it has the same effective wavelength as the standard Ic passband. My B-band instrumental magnitudes are too "bright" for red stars, so my B-band effective wavelength is longer than the standard passband's effective wavelength. My V and Rc effective wavelengths are shorter than the standard. A method for using the star color sensitivity plots, above, to derive effective wavelength for the filter in use. The details for this are described at EWL.

To illustrate use of the derivation at the above link, consider the slope for my B-band: dB/dC = +0.141 mag/mag. According to the relationship derived at the link, for filters near B-band:


WLeff = 446 nm + 42
× StarColorSensitivity       

According to this equation when I use my B-band filter the telescope system's response function has an effective wavelength of 452 nm. Similar equations exist for the other bands.

The need for determining star color sensitivity slopes for each of the YY Gem observer telescope systems is something I'm currently discussing with Dr. Hebb.
...

To summarize approximate effective wavelengths for the various filters (2nd column includes my non-standard notation):

  441 nm  B  (Johnson)
  450 nm  Bs (SBIG's B)
  478 nm  g'
  540 nm  V  (Johnson)
  540 nm  Vs (SBIG's G)
  620 nm  r'
  640 nm  Rs (SBIG's R)
  624 nm  Rc 
  755 nm  i'
  800 nm  Ic
  910 nm  z'
   

Observers

Here's the YY Gem observer list (name, location, E. Longitude, LHA range, filter assignment, effective wavelength, available filters in parentheses):

Ayiomamitis, Greece  +024 deg   -5.? to +5.? hr  SBIG's B  450 nm                (LRGB)
Srdoc, Croatia       +014 deg   -5.0 to +5.0 hr  SBIG's R  640 nm                (SBIG R, Baader long-pass R, V)
Gregorio, Portugal   -009 deg   -5.? to +5.? hr  V         540 nm                (VRcIc)
Gary, Arizona        -110 deg   -6.2 to +6.2 hr  g'r'i'z'  478, 620, 755, 910 nm (BVRcIcg'r'i'z')
Foote C, Utah        -112 deg   -5.0 to +5.0 hr  V & Rc    540 & 624 nm          (BVRcIc)
Foote J, Utah        -112 deg   -5.0 to +5.0 hr  B & Ic    441 & 800 nm          (BVRcIc)
Garlitz, Oregon      -118 deg   -5.? to +5.? hr  SBIG's B  450 nm                (SBIG's RGB)
Yada, Japan          +133 deg   -6.? to +6.? hr  SBIG's B  441 nm                (BV & SBIG's RGB)
Zambelli, Roberto    +010 deg   -5.? to +5.? hr  V & Bs    540 & 450 nm          (V, LRGB, Baader G)


Figure 40. Longitudes of YY Gem observability for members of this project's observer team.


Some Published Results


Figure 41. Data of Leung & Schneider (1978) fitted by Torres & Ribas. Notice that OOT is brightest just after primary transit and faintest just after secondary transit.


References

    Gary, Bruce L., Leslie H. Hebb, Jerry L. Foote, Cindy N. Foote, Roberto Zambelli, Joao Gregorio, F. Joseph Garlitz, Gregor Srdoc, Takeshi Yada, Anthony I. Ayiomamitis,
        "Photometric Monitoring by Amateurs in Support of a YY Gem Professional Observing Project," Society for Astronomical Sciences, 2012 Conference Proceedings
         (http://www.socastrosci.org/publications.html & PDF document download link).
    Granzer, T., M. Schussler, P. Caligari, K. G. Strassmeier, 2000, A&A, 355, 1087.
    Joy, A. H. ad R. F. Sanford, 1926, Ap. J., 64, 250.
    Moffett, T. J. and B. W. Bopp, 1971, AJ, 168, L117-120 (flare activity).
    Qian, Shengbang, et al, 2002, AJ, 124, 1060-1063 (ephemeris with E2-term for shortening period).
    Torres, Guillermo and Ignasi Ribas, 2002, AJ, 5567, 1140-1165, link (spectroscopic obsns, re-analysis of published LC tables, comprehensive review).

   
WebMaster: B. Gary.  This site opened:  2011.10.20 Last Update:  2013.02.06