[Published in The Minor Planet Bulletin, 2006 January/March, 33, 1, p 16-18]
Main-belt asteroid 46053 was fainter than magnitude 20 when light curve observations were made using an amateur telescope and image analysis software commonly used by amateurs. By subtracting images taken more than an hour apart the background stars were reduced to ~1% of their original intensity while preserving the asteroid at 100%. This method for dealing with interfering stars does not require the use of PSF-fitting and it is free of subjective artifacts associated with pixel editing to remove nearby stars. Imperfect matching of image pairs leads to residual systematic errors that vary during an observing session, but their fast-changing nature does not seriously impair the derivation of rotation light curves.
Asteroid 46053 Davidpatterson is a faint main-belt object discovered in 2001 by one of the authors (DH) using the Junk Bond Observatory 20-inch Ritchey-Chretien telescope. At the time of the two observing sessions described here the asteroid was predicted to be fainter than magnitude 19.7 and its location was only ~21 degrees from the galactic center. The asteroid’s highest elevation angle from our observing site was 34 degrees.
Amateurs usually do not attempt to measure rotation light curves for asteroids this faint, this close to the galactic center and at such low elevations (where seeing is degraded), partly because it is customary to use PSF-fitting programs for faint objects in crowded star fields, and few amateurs have the necessary programs (such as IRAF). This was an opportunity for evaluating an image subtraction procedure using general-purpose software.
Observations
Asteroid 46053 was ~1.65 a.u. from Earth during the two observing dates, 2005.09.01 and 2005.09.26, and its magnitude was predicted to be 19.7 and 20.1 (H = 16.2). The asteroid’s galactic coordinates were latitude -17 degrees, longitude +13, so there were more background stars than usual. Air mass ranged from 1.8 to 3.4 and the seeing was poor (5.0 to 6.5 “arc FWHM).
A 32-inch fork-mounted Ritchey-Chretien telescope (OGS
brand) was used with a SBIG STL-6303E CCD camera. Junk Bond Observatory (MPC
code 701) is located at 4425 feet altitude near
Author BLG has employed judicious pixel editing to remove stars in the sky background annulus, for example; this is a practice that should rightly produce shudders of concern. The following image subtraction procedure is an objective alternative for removing most of the effect of interfering stars.
Each raw image was calibrated using master dark and flat field images. During a 3-hour observing session the asteroid’s apparent motion was many times the FWHM of star images. This allowed for the creation of a “reference image” using several images when the asteroid was far from its location in a “signal image.” Since many images were used to create a reference image its subtraction from a signal image led to a “subtracted image” having a noise level similar to that of the signal image. Before subtraction the FWHM of the two images were checked for a match, and if they differed the reference image was either sharpened or smoothed to achieve a match. The flux (i.e, intensity) of a specific star was checked for equality, and the reference image was rescaled (during the subtraction process) to achieve a star flux match.
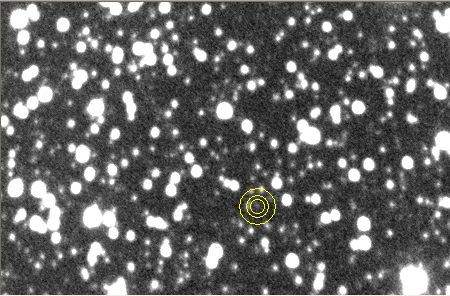
Figure 1. Signal image before subtraction showing asteroid (CV=20.0). FOV = 7.2 x 4.7 ”arc. The two stars to the upper-right of the sky background annulus have CV = 16.2.
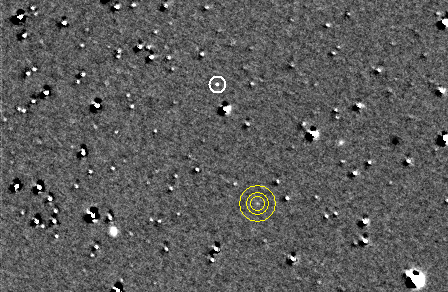
Figure 2. Subtracted image. Top circle is the “offset alignment dot.” The 3-circle photometry pattern is centered on the asteroid.
The most tedious part of this process is image alignment.
For the observations reported here the asteroid moved a significant fraction of
a FWHM distance between images. This meant that images could not be stacked
using the star field. This, and other considerations, led to a sequence of
manipulations that are described at the following web site: http://brucegary.net/ist/x.htm Only an overview
of the image subtraction concepts are described here.
Figure 1 shows a 4-image average before the subtraction process. Figure 2 shows a “signal subtracted image.” The asteroid is easily visible in the subtracted image. The sky reference annulus in Fig. 2 is clear of interfering background stars, whereas the Fig. 1 image has several stars within the sky reference annulus. The measured fluxes for background stars in the signal subtracted image are typically 1% of the values in the unsubtracted image. Since no rescaling (or smoothing or sharpening) has been performed on the signal image during the subtraction process the asteroid is present with 100% of its original flux.
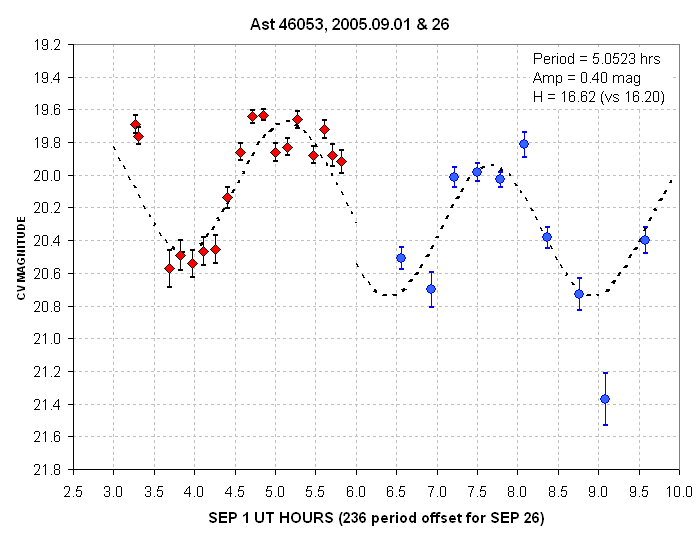
Figure 3. Rotation light curves for observing dates 2005.09.01 (red) and 2005.09.26 (blue). SE bars are stochastic (SE mag = 1.1/SNR). The time axis is 2005.09.01 UT hours, with 236 rotation periods subtracted from the 2005.09.26 data. The dashed sinusoid has a period of 5.0523 hours and an amplitude of 0.40 magnitude.
The asteroid’s average brightness faded 0.27 magnitude between the two observing dates, which is slightly less than the expected 0.47 magnitude fade. The 0.20 magnitude difference could be due to photometric calibration errors, or to the fact that the asteroid was observed from different perspectives and G differs from 0.15. Although we suggest a provisional H-value revision of +0.3 magnitude (H = 16.5) this is uncertain because the asteroid’s color is not known. We adopted a typical asteroid color V-Rc = +0.40 (Binzel, 2005); if V-Rc were actually +0.00, for example, the H-value solution would be 0.3 magnitude brighter (i.e., H=16.2) based on the telescope system’s clear filter sensitivity to star color (as determined from Landolt stars).
<>Although it is not our objective to report the asteroid’s period, amplitude or H value, it should be noted that when there are only two observing sessions separated by 25 days there will be an ambiguity of rotation period solutions, such that, in this, case P = 5.05232 + N * 0.01075 where N = -5 to +5, etc.Ghost Artifact Systematic Errors
The error bars in Fig. 3 are stochastic only. Clearly, some of the data differ from the “model fit” by statistically significant amounts. This cannot be due to shortcomings of the model since the timescale for the appearance of these large offsets have a timescale much shorter than the rotation period. It is far more likely that these large departures are due to shortcomings of the image subtraction process. For example, “ghost artifacts” from an imperfect subtraction (due to unequal FWHM or unequal intensity after rescaling) are more likely to show up in the sky background annulus than the signal circle simply due to the difference in pixel area of these two regions. When these artifacts are in the sky background annulus they may reduce the asteroid’s apparent brightness, whereas when they appear in the signal aperture they may make the asteroid appear brighter. The brightenings may be less frequent but they can produce larger errors. Consider also the case of an asteroid becoming fainter (due to rotation or changing observing date); faint and bright asteroids moving through similar star fields will exhibit different levels of systematic errors due to star ghosts. This may account for the one very low datum in Fig. 3 when the asteroid was faintest. Based on the appearance of Fig. 3 we estimate that when an asteroid as faint as 46053 is moving though a crowded star field (~21 degrees from the galactic center) the ghost artifacts due to incomplete star subtraction produce a component of varying systematic error of ~0.15 magnitude. However, as also can be seen from Fig. 3, these ghost artifacts come and go with a period of ~1/2 hour, which in this case is comparable to the time it takes the asteroid to move a distance of ~3*FWHM. Therefore, the image subtraction is unlikely to seriously impair the task of establishing an asteroid’s rotation light curve.
Conclusion
It is possible to perform image subtraction for the purpose of establishing rotation light curves of faint asteroids using standard, Windows-based astronomical image analysis programs, such as MaxIm DL. Considering the many user-commanded procedures required in this analysis it not known whether a program or script could be written that would perform most of the image subtraction tasks. We do not anticipate widespread enthusiasm for such a labor-intensive procedure. Nevertheless, this report demonstrates that amateurs are capable of measuring rotation light curves for faint asteroids in crowded star fields with a commonly-used Window-based astronomical image processing program such as MaxIm DL.
References
Binzel, Richard P., 2005, personal communication.
____________________________________________________________________________________________________________________
Related Links
Details of image subtraction used for this article
Another version of image subtraction for asteroids
Another example of an asteroid light curve using image subtraction
Astrophotos web page
____________________________________________________________________
This site opened: October 08, 2005. Last Update: March 30, 2006