PHOTOMETRY FOR DUMMIES
Some Quick and Sloppy Procedures
Bruce L. Gary, Hereford Arizona Observatory (G95)
Last updated 2005.01.09
This web page was inspired by the realization that astrometry
observations reported to the Minor Planet Center often include
brightness
estimates that are typically too faint by 1 or 2 magnitudes (for the
faint asteroids). I'm accustomed to sweating long hours to produce
photometry sequences with an accuracy of 0.03 magnitude, which is about
2 orders of magnitude better than these MPC submissions. Surely, I
told myself, by deleting a few terms from my complete equations it
should be possible to
achieve an accuracy on the order of 0.15 magnitude. Indeed, if this
accuracy is acceptable the "color terms" can be dropped, atmospheric
extinction can be treated carelessly, subtle considerations in choosing
photometry aperture sizes can be ignored, and a host of other details
that consume
the bulk of effort can be neglected. This web page is meant to guide
the astrometrist along a path leading to quick and easy photometry
results with accuracies no worse than 0.15 magnitude.
My only assumptions are that you 1) know how to measure a star's
"intensity" (flux, etc) using an image processing program (such as
MaxIm DL), 2) have a planetarium program for display of star fields and
star magnitudes (such as TheSky 6.0), and 3) for some of the more
advanced procedures that you are able to use a spreadsheet for simple
tasks. I'm going to also assume that you're working with an asteroid
(oops, "minor planet") that is fainter than about 14th magnitude, for
which you've exposed long enough to register it with a good
signal-to-noise ratio (i.e, SNR > 20).
Links Internal to this Web Page:
The following internal links are ordered from "sloppiest but
easiest" to "best but hardest."
Method
#1: 0.25 mag
SE, planetarium program using Tycho or UCAC2 catalog (3 minute effort)
Method #2:
0.15 mag SE,
planetarium program using several Tycho or UCAC2 reference stars (5
minute effort)
Method
#3: 0.15
mag SE, counts equation magnitude (5 minute effort, plus
once/year system cal)
Method #4: 0.15 to 0.30 SE,
R-mags using several Tycho or UCAC2 stars (10 minute effort)
0.07 mag SE, quick all-sky (4-hour effort, after
practice)
Method #6: 0.03 mag SE, all-sky
with color terms, BVRI filters (2-day effort,
after practice)
0.02 mag SE, ask Arne (1 minute e-mail and good luck)
Definitions
and good observing practices
Catalog Comparisons,
UCAC2 Accuracy
Additional Links
Method #1
0.25 mag
SE,
Planetarium Program Use of a Tycho or UCAC2 Reference Star (4 Minutes)
Order the UCAC2 3-CD set from USNO and copy them to your hard drive.
Tell your planetarium program to support UCAC2 (easy with TheSky 6.0).
Now you're ready for some easy and accurate photometry.
1) Look for a star in your image that's not seriously saturated (i.e.,
maximum counts <35,000).
2) Use your planetarium program to identify this star.
3) Use the planetarium program to determine the magnitude for
this star
(V-mag are normally displayed).
If it's from the Tycho catalog, great. The star's
V-mag is likely to have SE = 0.13 mag. Be sure the star isn't saturated
and proceed to next step.
If it's from the UCAC2 catalog, good. If V-mag
>10.5, add 0.25 mag. Proceed to next step.
If it's from the GSC catalog, try another star
(unless you're willing to accept SE = 0.44 with the possibility of
errors ~1.1). If you use it, subtract 0.33 mag.
4) Measure the star's "intensity" (set the photometry aperture so that
most of the star's image falls within the signal circle, and check that
no interfering stars are in the sky background reference annulus).
5) Measure the asteroid's intensity (using the same aperture settings).
6) Calculate the asteroid's magnitude: MagAsteroid = MagStar + 2.5
* LOG10 (IntensityStar / IntensityAsteroid)
Note 1: The accuracy of any measurement has two components: 1)
SEs, the
stochastic standard error (related to noise level), and 2) SEc,
estimated calibration uncertainty. Add them together (orthogonally) and
you get accuracy. Use the asteroid's SNR to calculate SEs [mag] = 1 /
SNR. (MaxIm DL displays SNR in the information window for the star
within the aperture circle.) Assuming your "reference star" magnitude
was
from the UCAC2 catalog, then SEc ~0.2 mag. If it's from Tycho, then SEc
~0.13 mag. Your final "accuracy" SE
= SQRT (SEs2 + SEc2).
Note 2: If you use a good observing and analysis program, such
as MaxIm
DL, the above procedure can be simplified using the "Calibrate"
tool to force an intensity to display the corresponding magnitude (in
an information window) as you
move the cursor over stars in the image. Doing this replaces steps 4, 5
and 6, above. I assume that if you're not
using MaxIm DL you can still read "intensity" (or flux, etc) using your
analysis program (if you can't then you're out of luck for this and all
the other procedures on this web page). Assuming TheSky6 and MaxIm DL
are both open, and your image of interest is on display, the entire
procedure for deriving an asteroid magnitude should take less than 3
minutes.
Note 3: If you're observing unfiltered then your asteroid
magnitude
(using V-mags for the reference star) can still be considered to be
some version of a V-mag.
It is only a good version of a V-mag to the extent that the asteroid's
color is the same as the reference star's color. Since the advertised
accuracy of this method is only 0.25 mag the color issue is unimportant.
Note 4: If your planetarium program is any good the Tycho
magnitude that it gives for a star will be an adjusted version of the
Tycho Bt and Vt measured magnitudes. If it doesn't make this
conversion, you'd
better do it yourself: V = Vt +0.008 - 0.0988 * (Bt -
Vt), which is Arne Henden's suggested correcting equation.
Method #2
0.15 mag SE,
Using
Several Tycho or UCAC2 Reference Stars (5 Minutes)
This method is a slight elaboration of the previous one and achieves it
improved performance by using several UCAC2 or Tycho stars as
"reference stars."
1) Look for at least 4 stars in your image that aren't seriously
saturated (i.e.,
maximum counts <35,000).
2) Use your planetarium program to identify these stars.
3) Use the planetarium program to determine the UCAC2 magnitudes for
these stars. If Vmag >10.5, add 0.25 mag.
4) Set the photometry aperture so that
most of the "light" from the reference stars fall within the signal
circle, and check that
no interfering stars are in the sky background reference annuli.
5) Select the Photometry Tool (in MaxIm DL click Analyze/Photometry).
6) Set the mode to Object and left-click the asteroid.
7) Set the mode to Reference, and for each UCAC2 reference star
left-click it and enter the UCAC2 V-magnitude for that star.
8) Click View, and save the results to a CSV-file.
9) View the CSV-file (using your favorite utility, such as Total
Commander), and read the asteroid's magnitude.
Note 1: Since the UCAC2 catalog exhibits magnitude errors that
appear to be random at a given star region it's possible to reduce the
UCAC2 calibration uncertainty, SEc, by using N reference stars the
calibration achieves a systematic uncertainty approximately given by
0.20 / SQRT(N). If you use 4 UCAC2 stars, then you may achieve 0.10 mag
SEc. This overlooks the fact that color terms are still missing from
the analysis.
Method
#3
0.15
mag
SE, Counts Equation Magnitudes (5 Minutes)
For this procedure you'll have to perform a once yearly calibration of
your telescope/CCD system. If you change configurations, you'll have to
repeat the calibration. I'll first show how to calculate magnitude
under the assumption that a valid system calibration exists, then I'll
describe that calibration observing session.
Procedure When System is Calibrated:
For my telescope system whenever the sky is cloudless I can convert a
star's "intensity" to magnitude in a couple minutes without consulting
a
star catalog for a reference star's magnitude or observing a Landolt
star field. The accuracy isn't very good, being ~0.15 magnitude, but it
sure is quick! The procedure is
straightforward, as summarized here (using MaxIm DL):
1) Move the photometer aperture pattern over a star and make sure the
signal
circle is large enough to "capture" most of the light from the object
of interest (the asteroid),
2) Make sure the reference annulus does not have interfereing stars
inside (if it does, either change the gap annulus width, change the sky
background width, or use the pixel edit tool to delete them),
3) Note the star's "intensity" (taking care with faint objects to
manually center the signal circle on the asteroid (and not the location
yielding maximum intensity),
4) Note the time of the exposure,
5) Determine air mass using a planetarium program (such as TheSky 6.0),
6) Calculate magnitude using an equation of the following form:
R-mag = (20.0 +/- 0.1) - 2.5 * LOG10
( INTr / g ) - (0.13 +/- 0.01 ) * m
where INTr = "intensity" of the asteroid using the R-band filter,
g = exposure time, m = air mass. The constant 0.13 +/- 0.01 is my
site's extinction {magnitudes per air mass). The constant 20.0 +/- 0.1
is unique to my telescope system and is the number that must be
calibrated once per year (or whenever the configuration changes). Each
filter has a different pair of constants, and I'm just illustrating the
equation for converting intensity to magnitude for one filter.
Note 1: Notice that it was not necessary to consult a star
catalog for obtaining a reference stat's magnitude. Reference stars are
not used with this procedure.
Note 2: This procedure only works when the sky is cloudless. To
assure that your observations are unaffected by clouds it is useful to
check the sky background level on images taken at about the same air
mass. This background level (after subtracting 100 counts) will be
proportional to air mass, and the slope of this dependence will be
greatest for the B-filter. Whenever I'm doing precision photometry I
monitor the sky background level (comparing it with charts) and I also
monitor an internet satellite IR image of my area to see when cirrus
clouds are moving toward my site.
Note 3: The first constant term in the equation, above, is
somewhat dependent upon the signal circle size. If the circle is
smaller than the size used for the annual calibration (and that's a
temptation, since your SNR for a faint object is best for smaller
signal apertures), then you'll have to determine the response ratio.
This is done using a bright, nearby star, where you note the ratio of
intensities for a large aperture that captures >99% of the star
light, and the intensity corresponding to the smaller aperture you want
to use for the faint asteroid. Use this response ratio to adjust the
asteroid's intensity before using the above equation.
Note 4: Notice that your asteroid magnitude will be more
accurate when observing at high elevations, where air mass is small and
the extinction term is smallest. It is difficult to know the
exact value of your extinction coefficient on a particular night, and
the
greater the air mass the greater the systematic error this uncertainty
will produce. At my site the clear sky extinction at zenith probably
varies from 0.12 to 0.15 during the year. An observer at a lower
altitude than my 4700 feet will have slightly higher extinction. For my
site extinction values for the filters BVRIC (where C = unfiltered) are
typically 0.28, 0.16, 0.13 and 0.09 magnitude per air mass.
Procedure for Annual System Calibration
The calibration observing session is meant to evaluate the first
constant in
the above equation, and possibly to check your assumed extinction per
air mass coefficient. Whenever I conduct a system calibration I cycle
through my 5 filters, BVRIC. Probably most
asteroid searchers observe unfiltered, so you may ignore references to
changing filters in the following description.
For the system calibration choose only a completely cloudless night
with no greater than calm winds. When these two conditions are met the
night is referred to as "photometric."
Start the night with dusk flat frames near zenith. I use a double
T-shirt "diffuser" placed in front of the telescope aperture to
eliminate the possibility of stars showing up on the flat frames.
Choose exposure times that produce a maximum counts value for the
entire image of no more than ~30,000 counts (in order to avoid
saturation). Don't use images with
exposure times <1 second (because shutters can introduce their own
component of vignetting for short exposures). I use only flat
frames with exposure times between 1 and 20 seconds. Using dark frames
is a good idea, but some people consider this optional. Don't use a
cooler for the CCD chip (or if you do, be sure the chip temperature is
very stable). After the flats are complete for all filters, turn on the
CCD cooler to a vlue that the TEC can reach in a reasonable time (a few
minutes) and start focus observations.
Select Landolt areas to observe that are at low and high air mass.
Try to position your FOV so that several Landolt stars are present. (As
a convenience, I've produced a TXT-file of the Landolt stars for import
into TheSky. During the import process TheSky creates a SDB-file for
fast loading on subsequent uses of the program. Whenever TheSky is run
it automatically includes the Landolt stars and displays their
magnitudes when a star is clicked.) Choose exposure times that avoid
saturation for all Landolt stars. For me 10 seconds works well. Make at
least 4 exposures of each Landolt area, and make at least that many
dark frame exposures. Calibrate the light images using many darks
(median combined) and your flats (averaged).
In theory you can stop after obtaining exposures of a Landolt area
at high air mass and another at low air mas, but it's prudent to repeat
the pairing to be sure temporal trends of extinction are not present.
Two pairs of Landolt area observations should take no more than 4
hours.
Analysis of these observations might be considered difficult by
observers not used to the joys of spreadsheets. I make manual readings
of intensity for all Landolt stars using a carefully chosen set of
photometry dimensions. The signal circle must be large enough to
accommodate >99% of the photons registered by the largest FWHM
Landolt star for the night. Each image must be inspected to assure that
nearby stars are not present in the sky reference annulus. If
interfering stars can't be avoided, then edit them away! Don't be
afraid of pixel editing, but be careful in using this tool to
select new pixel values that are representative of the sky background
level for that part of the image.
Record all intensities, and mid-exposure UT times, and use a
planetarium program to determine air mass values for each image. Enter
these data into a spreadsheet, and also enter the Landolt magnitudes.
To veiw a sample spreadsheet layout, click SampleSpreadsheet.
The
concept to be implemented in the spreadsheet is to perform a least
squares solution for that first term, unique to the telescope system,
such that the equation produces magnitudes that agree with the Landolt
magnitudes. With this as a guiding concept you are invited to create
your own spreadsheet to solve for the best value for this one
constant. You are also invited to solve for your site's extinction
coefficient, making use of the fact that you have high and low air mass
measurements of known stars. If you're ambitious, you can also try to
detect a temporal trend for extinction for this calibration
observing session.
When the results of this telescope system calibration are used for
the analysis of images taken on other nights there may be systematic
errors of 0.1 magnitude. I don't understand these changes yet, but
beware of systematic changes that might be even larger for unknown
reasons. It is always prudent to use another method to check the
magnitude determinations from this method if you want to be assured of
0.15 magnitude accuracy.
Method#4
0.15 to 0.30 mag SE,
R-Filter, Using
Several Tycho or UCAC2 Reference Stars (10 Minutes)
This method is the same as Method #2 except that catalog magnitudes
have to be converted to an R-magnitude. As stated before, be sure you
have UCAC2 files on
your hard disk and configure your planetarium program to support this
catalog.
1) Locate up to 4 unsaturated stars in your image that have Tycho
magnitudes displayed in your planetarium program. Avoid Tycho stars
with Vt > 10.5.
Note: You may not find any Tycho
catalog star in your FOV if it's smaller than ~15 x 25 'arc.
If you have many images at about
the same air mass try those
and use the "zero offset" value for analysis of the image of interest.
2) Convert Tycho magnitudes Bt and Vt to R using Arne Henden's
conversion equation: R = Vt -0.014 -0.5405 * (Bt - Vt)
3) If you have to use UCAC2 stas, convert UCAC2 V-mag (which I'll refer
to as Vu) and J magnitudes to R using:
R = 0.17 + 0.83 * Vu + 0.14 * J.
(Don't use the Vu 0.25 mag
correction mentioned elsewhere.) Estimated accuracy = 0.30 mag.
4) Set the photometry aperture so that
most of the "light" from the reference stars fall within the signal
circle, and check that
no interfering stars are in the sky background reference annuli.
5) Select the Photometry Tool (in MaxIm DL click Analyze/Photometry).
6) Set the mode to Object and left-click the asteroid.
7) Set the mode to Reference, and for each Tycho or UCAC2 reference
star
left-click it and enter the Tycho-based or UCAC2-based R-magnitude for
that star.
8) Click View, and save the results to a CSV-file.
9) View the CSV-file (using your favorite utility, such as Total
Commander), and read the asteroid's R-magnitude.
Note 1: The more Tycho stars you use the smaller your
systematic
error. With just one Tycho star you can expect SEc = 0.30 mag. With 4
Tycho stars it should be ~0.15 mag.
Note 2: This procedure is a lot more work compared with the
procedure for V-filter or unfiltered observations, and the results are
less accurate. This is due to the fact that star catalogs don't
include R-magnitudes (except for the very brightest, which will
always
be saturated for CCD users). Converting B and V magnitudes to R
involves additional errors, so the R-mags you calculate are less
accurate than the catalog V-mags. Here's an example of Tycho-based R
magnitudes versus "true" (Landolt-based) R-magnitudes for a region
chosen at random (the Landolt Area at RA = 00:55).
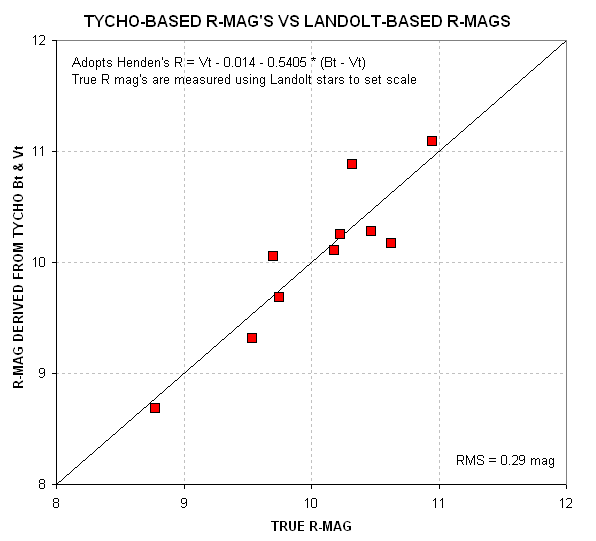
Figure 1. Tycho-based R-mags versus "true" R-mags, where "true"
R-mags were determined using an R-filter image that contained 21
Landolt stars for establishing a zero-shift value.
Note 3: I'm unsure about the accuracy of using UCAC2 stars for
deriving R-magnitudes. If the V-mags have SE = 0.2 mag, and the R-mags
should be even better (since I think they're derived from JHK
magnitudes). I did a quick correlation that indicates 0.15 SE for
R-mags derived from the catalog Vu and J mag's (using the formula given
in step 3, above).
Method#6
0.05
mag
SE, BVRI Equation Magnitudes of Landolt Area and Region of Interest (4
Hours)
I will use the term "photometric group" to refer to an
observing sequence of a Landolt Area (LA) and the unknown star field,
or Region of Interest (ROI) that are at the
same approximate air mass (m). A
photometric group consists of BVRI
images for the LA and BVRI images for the ROI. There are a total of 8
images that must be measured, 4 for the LA and 4 for the ROI. Each of
these 8 images, which for my usual observing sequence is obtained by
median combining 10 frames for each star field and filter combination,
which have been
calibrated (raw frame that has been dark subtracted and flat field
corrected).
I will use an example observation from 2004.12.10, when I performed
two "photometric group" observations, one at
m = 2.4 and the other at m = 1.8. Each photometric group produces
a complete all-sky photometry solution for the ROI. The remainder of
this web page describes my attempt to achieve an all-sky photometric
solution from
the first photometric group.
The first step in my procedure for producing an all-sky photometric
sequence is to solve for one unknown term in an equation for magnitude
as a function of star intensity, exposure time, air mass and star B-V
color. This is done using the Landolt stars, with known magnitudes (and
colors). For this first photometric group I obtained the following
equations:
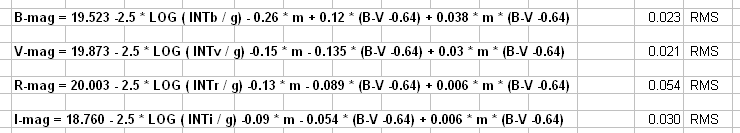
Figure 1. Equation magnitudes that account for measured
intensity (INT) for Landolt stars, using their known magnitudes, B-V
colors, air mass (m) and exposure time (g) for BVRI filter observations.
Other more extensive observations have produced values for the
coefficients related to extinction, star color and the product of air
mass and star color; only the first term, a constant, is solved for
using the Landolt stars.
When these magnitude equations are applied to the Landolt star measure
intensities they yield a set of magnitudes that can be compared with
the true magnitudes, shown in the next figure.
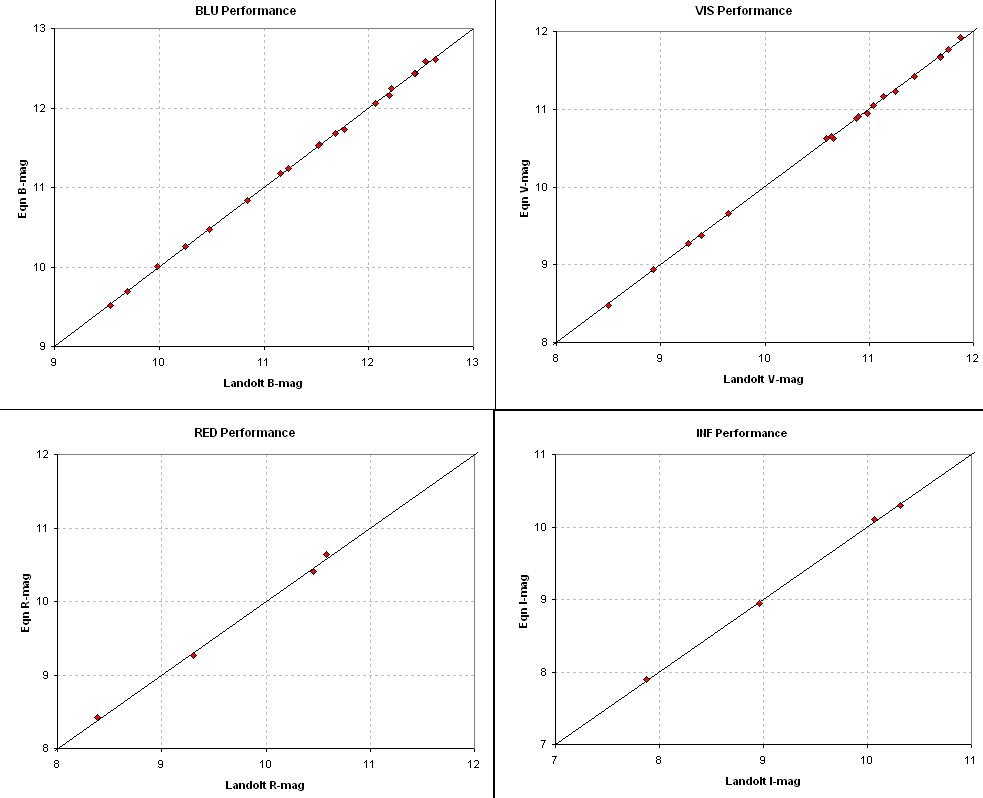
Figure 2. Comparison of equation magnitude solutions with
Landolt magnitudes for the LA0540 (Landaolt Area at RA = 05:40, Dec
~0). RMS scatter is 0.023, 0.021, 0.054 and 0.030 magnitude (for B, V R
and I). Observations were made on 2004.12.10 at an air mass of
~1.8.
These 4 panels show that the equation magnitudes can produce
acceptable fits with typical SE of ~0.03 mag by adjusting only one
constant (zero offset) in each filter's equation relating B-V, air
mass, exposure time and measured intensity. The next set of 3
graphs were produced by comparing colors for the unknown star field
(E0540) using the magnitude equations and constant solutions. If the 4
constants that work for the Landolt fields also work for the unknown
star fields, then the color/color scatter diagrams for the unsknown
stars should be in approximate agreement with the corresponding
color/color scatter diagrams for the landolt stars.
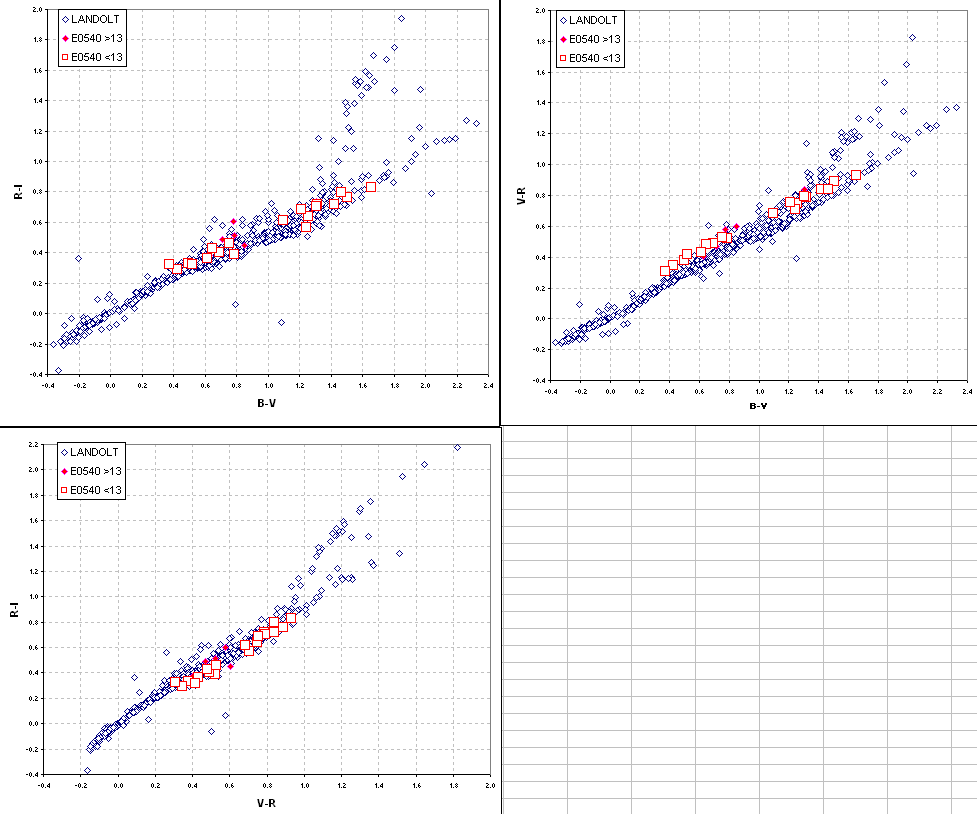
Figure 3. Star colors scatter diagram for 707 Landolt
stars and the 24 E0540 stars that were "solved" using my equation
algorithm.
This graph is a "sanity check" meant to uncover systematic errors
in the solutions for any of the 4 magnitude bands for the unknown
region
E0540. The E0540 stars exhibit small offsets with respect to the
Landolt stars. This could be caused by changes in extinction between
the time the Landolt area was observed and the time E0540 was observed.
It could also be caused by an error in my assumed extinction combined
with the fact that the E0540 ROI was observed when it was at a slightly
different air mass than the Landolt area. A third possibility is that
my filter wheel doesn't stop at the same location each time a filter is
selected, and the slight mis-alignment causes a slightly different flat
frame (indeed, I found evidence for this when exposing the flat frames:
the appearance of the flat frame image depended on the direction from
which I approached a specific filter). Whatever the explanation, it is
appropriate to make use of the extra information about star colors to
apply empirical adjustments to the equation magnitudes in order to
achieve agreement with the Landolt color/color scatter diagrams. When
this is done we obtian the following color/color scatter diagrams.
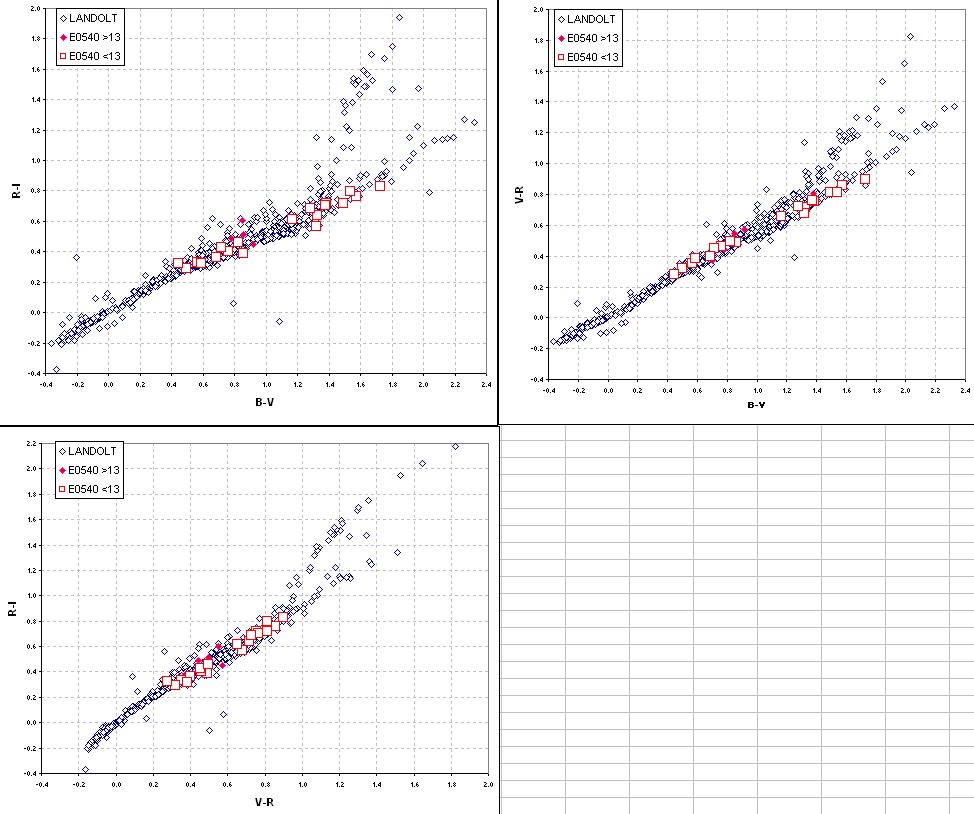
Figure 4. Star colors scatter diagram for 707 Landolt
stars and the 24 E0540 stars that were "solved" using my equation
algorithm. Adjustments of +0.04, -0.03, 0.00 and 0.00 were applied to
the E0540 BVRI magnitudes.
These color/color scatter diagrams were obtained by applying
empirical offset corrections to the B- and V-band magnitudes for E0540.
The corrections are +0.04 and -0.03 magnitude. No corrections for the
R- and I-band magnitudes were necessary. When Arne Henden makes
available his photometric sequence results I expect to find that my
star magnitudes exhibit accuracies of ~0.03 magnitude (based on past
such comparisons).
I should be able to achieve more accurate results using this technique
(as Brian Skiff poitns out), but I'm still learning. I suspect I have a
flaky color filter wheel, that doesn't end-up at the same location each
time (since I've seen sky flats look different depending on which
direction I approach a filter from). All-sky photometry must get easier
the more of it you do. I'm counting on that!

Definitions
and Good Observing Practices
Definitions
SE = standard error uncertainty; the orthogonal sum of SEs and SEc;
SE
= SQRT (SEs2 + SEc2)
SEs = stochastic SE; SEs = 1 / SNR in magnitude units (when SNR >
10).
SEc
= calibration SE; usually estimated. Check stars offer quick estimate
of lower limit to SEc, as do multiple measurements of a single star.
For faint asteroids SEs > SEc.
Photometer signal circle = the circular aperture containing star light
to be measured
Sky background reference annulus = the outermost annulus, with a gap
annulus between it and the signal circle, used to determine an average
level for subtracting from the signal circle readings
Intensity = sum of counts above background level; sum is performed
within a circular photometry aperture; background level is established
using an annulus (outside a gap annulus)
Good Observing Practices
Median Combining
It is a good practice to work with images that are a median combine
of 3 or more images (that have been dark frame and flat field
calibrated). This usually is not done for asteroid search programs
since triplets (or quadruplets) of images are taken of a specific star
field, each image >20 minutes after the preceding one, and this
image set is used to search for moving targets. Photometrists median
combine before doing photometry because this process removes cosmic ray
artifacts. Fortunately, it is still possible to remove the effect of
cosmic ray artifacts using a set of 3 or more images of an asteroid.
This can be done by median combining using the asteroid for image
alignment. In such an image the background stars disappear leaving only
an asteroid feature. There are two advantages for doing this: 1) the
asteroid feature has improved SNR, and 2) nearby stars are much less
likely to interfere with photometry since they are removed by the
median combining process. Combining images can also be done by
averaging, but in this case you actually increase the chances of having
nearby stars interfere with photometry. Here's an example comparing
averaging and median combining (using the asteroid for
alignment in
both cases).
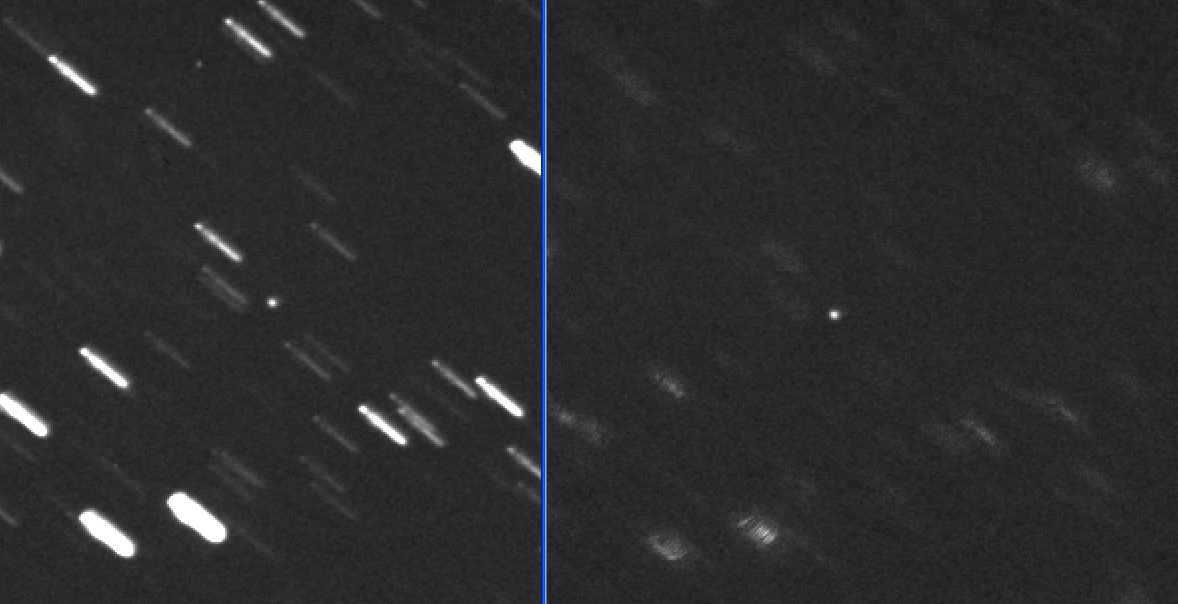
Figure 1. Two versions of combining 14 images of asteroid
2004 MN4 (V-mag = 16.88 +/- 0.15). Left panel shows averaging (using
the asteroid
for aligning), and the right panel shows median combining (also using
the asteroid for alignment). [Celestron 14-inch, prime focus f/1.86,
SBIG ST-8XE, red filter, total of 14 60-second exposures, unfiltered;
2004.01.08;
Hereford, AZ]
Median combining may incur a ~15% SNR penalty, but it removes cosmic
ray defects and it reduces the brightness of star tracks due to the
asteroid's motion. Notice that a cosmic ray is visible in the
upper-left region of the left panel. The reduction of star track
brightness can be an advantage when doing photometry with a large sky
reference annulus.
Pixel Editing
Professionals would be "horrified" to learn that someone was suggesting
"pixel editing" to recover an image for photometric analysis. But
that's what I'm going to do. Here's the situation where I recommend it.
Figure 2. Animation of Asteroid 12753 passing by a
bright star. This 26-frame sequence shows motion during a 5-hour period
(2004.12.31).
Notice that about 1/3 of the way through the sequence the asteroid
appears to fade. This set of observations was made for the purpose of
establishing a rotation light curve. But what can be done to minimize
the effects of the bright interfering star? Should this data be
rejected simply because it would spoil the signal aperture reading, or
spoil the sky background reference annulus reading? Here's the problem,
using Frame #10 as an example.

Figure 3. Frame 10 (enlarged) from the above sequence, showing
the "problem star" east of the asteroid (at center of aperture
circles).
The solutionis to "pixel edit" the problem star away.
Figure 4. Pixel editing was used to "remove" the problem
star, permitting the use of a better quality "sky background reference
annulus."
The final rotation light curve appears to be unaffected by this problem
star and a few other fainter ones that were dealt with in the same
manner, as the following graph shows.
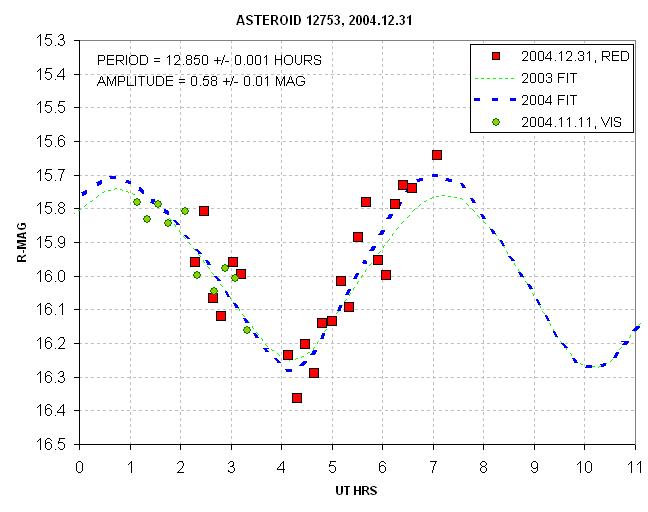
Figure 5. The red squares are from the 26-frame sequence
from
2004.12.31, using an R-filter. Only one frame could not be "rescued"
from the effects of nearby stars. The pixel editing example in the
previous figure led to the data point at UT = 4.1 hours. The
2004.11.11 data (green circles) are V-filter observations and they have
been adjusted
by -1.6 magnitudes to achieve agreement with the R-filter rotation
light curve. A full rotation occurs each 12.85 hours.
The rescue work appears to have been successful since the rotation
light curve is consistent with data from a month before and a year
before that. I therefore recommend pixel editing for the rcovery of
images that are affected by nearby interfering stars.
Catalog Comparisons
Not all catalogs are created equal when it comes to photometry. So
far the best ones are Tycho and UCAC2 (a 3 CD set, free from USNO), as
the
following graph illustrates.
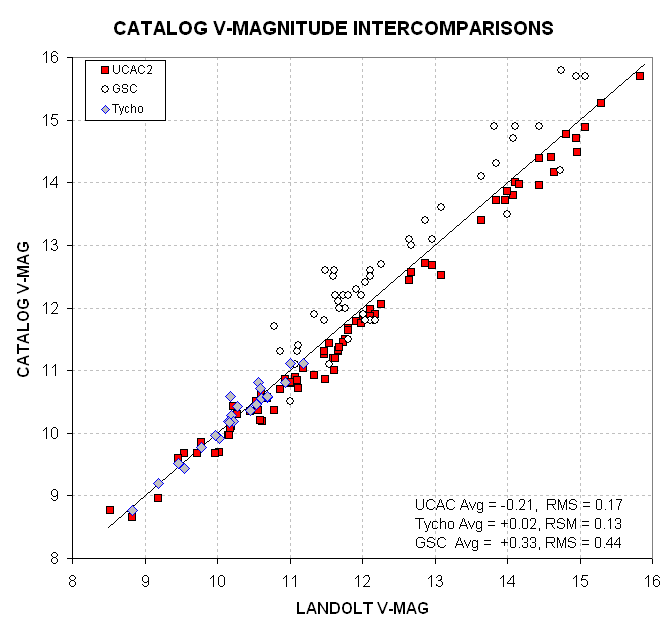
Figure x. Comparison of V-mag for 3 catalogs
available in planetarium programs. Landolt magnitudes are the standard
(truth).
This graph was constructed from a few stars chosen at 5 random
locations (well, 5 Landolt area locations). Given that the Landolt
magnitudes are a primary standard, biases and scatter are quite
different for these three catalogs. Maximum errors of ~1.1 magnitude
are possible for the much-maligned GSC, which was created as a guide
star catalog for Hubble Space Telescope and doesn't claim to have good
photometry. Now that the UCAC2 catalog is available (for free) on a
3-CD set, and considering that planetarium programs can be easily
confgured to support this catalog, there's really no excuse for anyone
serious about photometry to not upgrade for use of this catalog. This
brief analysis suggests that an additional improvement can be had by
adding ~0.28 mag to UCAC2 magnitudes for stars fainter than ~10.5. When
this is done we can expect the following performance. The Tycho catalog
is somewhat better, but it doesn't go any deeper than ~11.3 V-mag,
where most stars are saturated for asteroid searches.
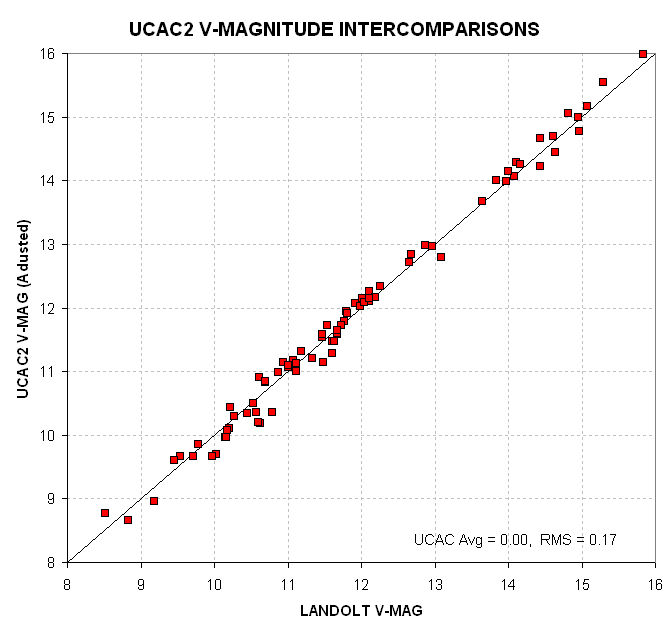
Figure x. UCAC2 V-magnitudes versus the Landolt
starndard V-magnitudes, after adding 0.28 mag to the UCAC2 stars
fainter than 10.5.
The UCAC2 catalog is complete for declinations south of +40 degrees
(some stars go as far north as +55 degrees). The USNO web site http://ad.usno.navy.mil/ucac/
modestly states that the photometry is poor, being 0.1 to 0.3 mag. For
astrometrists, that's good photometry. To order the 3-CD set containing
48 million UCAC2 stars from USNO: send a short e-mail message
to nz@usno.navy.mil with "request UCAC2" in the subject line
and give your mailing address in the main part of the message. Please
use upper case letters for your name and address in a format directly
usable for mailing lables.
To install it on your hard disk, and configure TheSky 6.0 to support
it, follow the Help instructions for TheSky. If you have trouble, you
may e-mail me.
Additional Links
Brian Warner's Guide
to Minor Planet Photometry
AAVSO's CCD
Observing Manual
Arne Henden's brief text
tutorial (pdf-file)
All-sky
photometry tutorial (one of my tutorials)
CCD
Transformation Equations explained (my derivation from first
principles)
Photometric
Sequence
Chart Creation for a 2004 nova (my example of typical session)
2004 MN4
rotation light curve (Jan 8 & 9)
CCD
Imaging Tips
AstroPhotography
Tips
Bruce's
AstroPhotos
You may e-mail me at B L G A R Y @ u m i c h . e d u
____________________________________________________________________
This site opened: January
1,
2005. Last Update: March 30,
2006