Bruce L. Gary (GBL); Hereford, AZ; 2004.08.22
This page has not been updated since July 6,
except for the internal link section Comparing With Arne.
This web page is devoted to a recently discovered cataclysmic
variable in outburst with object designations "VAR HER 04" and
"1835+25". Observations may be submitted to the AAVSO using either
object designation. The object is in the constellation Hercules at
coordinates 18:39:26.2, +26:04:10 (epoch 2000.0). Lew Cook first
reported a superhump variation with a period of 0.056 +/- 0.002 days.
More recently, Tonny Vanmunster reports an analysis of observations by
Lew Cook, Russ Durkee, Donn Starkey, Dave Messier, Brian Martin and
Tonny Vanmunster showing superhump variations with a period of 0.057717
+/- 0.000060 days (83.112 +/- 0.086 minutes, see VMT). Several AAVSO web pages
are devoted to this object; http://www.aavso.org/news/her04.shtml
has links to them all (I think).
Links Internal to this Web Page
Picture Preview
Light Curve
Photometric Sequence
Determination
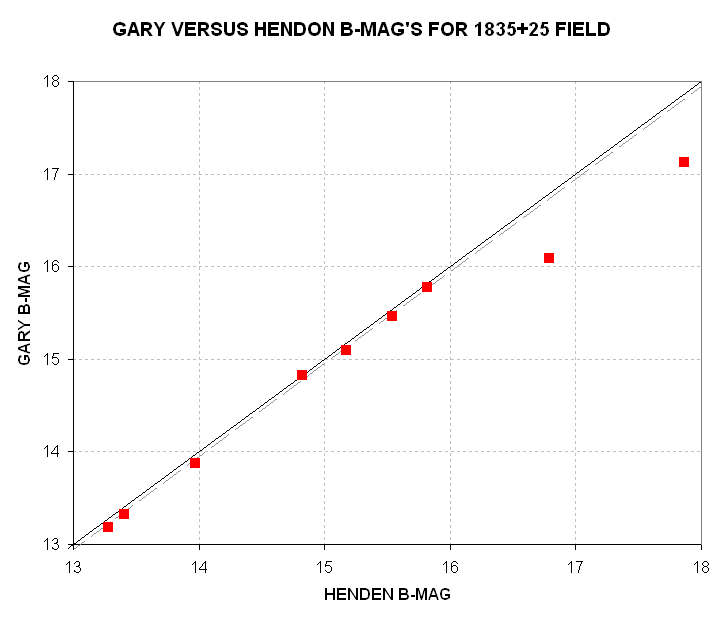
Comparing With Arne
Color Pictures
Variation
During Quiescence
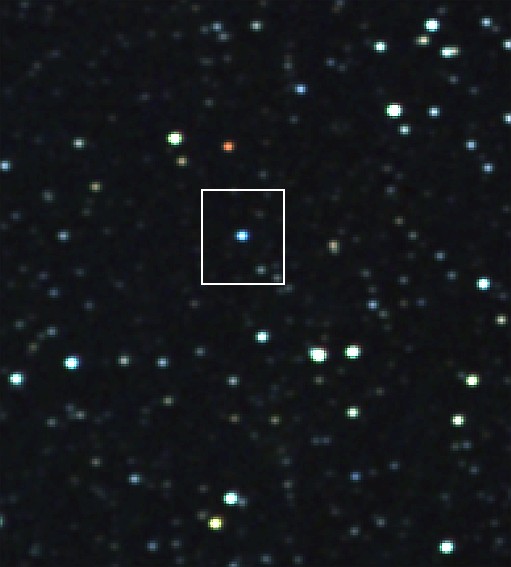
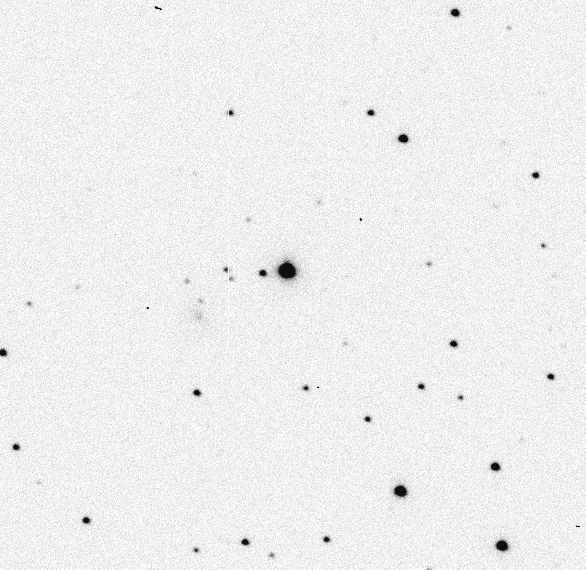
Figure 1a and 1b. The blue
star is 1835+25 (VAR HER 04). North is up and east is left for both
images. The image on the left is a RVB color image by B. Gary taken
June 28
UT and has a FOV = 8.8 x 10.1 'arc. The
white
rectangle shows the area covered by the image on the right, which was
taken by James Bedient and Dr. Jana Pittichova (probably June 22 UT)
and has a FOV = 2.0 x 2.3 'arc. The color image is a 4% areal crop of
an image taken with a 14-inch Celestron telescope (prime focus,
f/1.86),
and the FWHM resolution is ~8.5 "arc. The image on the right was taken
using a 2.2-meter telescope on Mauna Kea under light cirrus with 0.8
"arc seeing (FWHM resolution of ~0.8 "arc) for 7-second exposures. This
smaller "plate scale" and sharpness of this image shows that there is a
fainter star ~5"arc to the east of 1835+25 (about a month later,
after 1835+25 had faded, Arne Henden detected another star ~1 "arc
southeast of
1835+25
which he cautions makes it difficult to monitor the CV's brightness
versus
filter used as well as any rotation-related variations). Notice in the
image
on the left the very red star north of 1835+25 (having B-V = +1.69,
versus -0.05 for 1835+25). Stars that are so bright that they saturate
this 8-bit image appear white regardless of their real color.
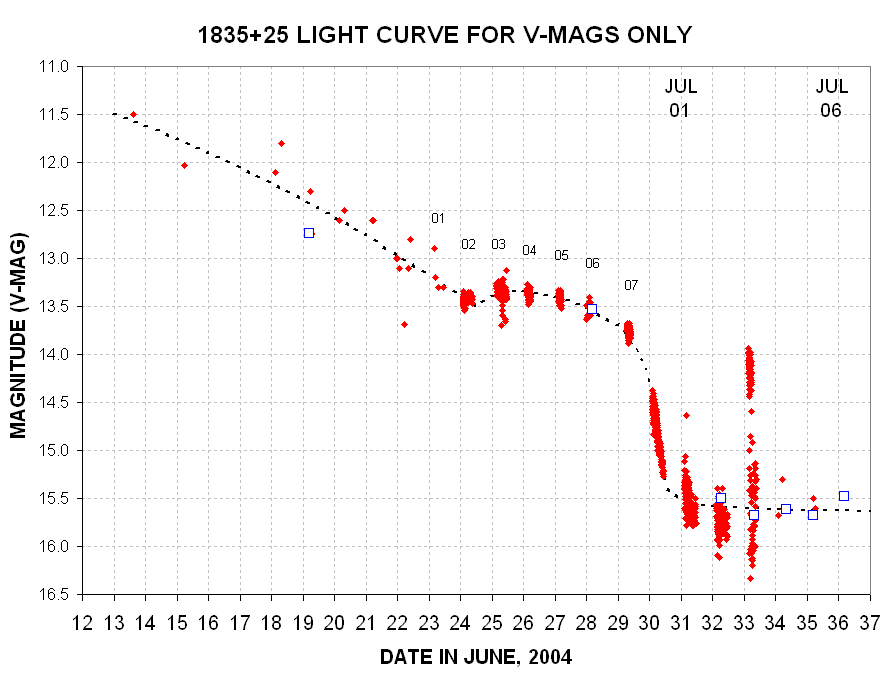
Figure 2. V-magnitude light curve based on observations
in the AAVSO Quick Look data base and other measurements that
have come to my attention. The trace after June 24.5 is a "hand fit."
(July 1 is represented as "31", etc.) The blue square symbols are
for
CCDV measurements that have been corrected for the observer's unique
system
color response (i.e., "CCD transformation equation corrected") and they
are an average for the observing session. One limitation for these last
few V-magnitudes is that the signal aperture includes a 17th magnitude
star 1"arc southeast of 1835+25. Therefore, 1835+25 is actually fainter
than 15.65 after Day 32. The fading continued after Day 36 based on
V-filter measurements on August 20, yielding Mv for "1835+25 plus the
1"arc southeast star" of 16.34 (SNR ~50).
The "CCD transformation correction" is important for an object that has an unusual color, such as 1835+25, which started out being very blue and became normal as it faded.
Photometric Sequence
Determination
An unofficial AAVSO Chart can be found at http://aavso.org/tmp/VARHER04-E.GIF
The sequence in that chart is based on my June 19 observations.
This section describes how I determined the photometric sequence (Arne
Henden is apparently out of town, so I was asked to try to do an
amateur's imitation of Arne).
A Celestron CGE-1400 telescope was used with a SBIG ST-8XE CCD at
prime focus, using a Starizona HyperStar adapter lens. Custom
Scientific B, V and R photometric filters were used. All images were
made with the CCD cooled to -10 C. Focus adjustments were made several
times during the 3-hour observing session. When I'm using a prime focus
configuration the Custom Scientific filters are not parfocal, and this
required that I refocus for each filter change. I used a table of
previously-determined filter focus offsets. Sky conditions were
"photometric" and based on atmospheric seeing of the past few nights
and the recent reliability of ClearSkyClock seeing forecasts for my
site, I suspect that the seeing afforded FWHM ~ 2.3 "arc (for a
Cassegrain configuration). The prime focus configuration produces a
"plate scale" of 2.8 "arc/pixel, and due to slight distortions caused
by an imperfect prime focus adapter lens I was able to achieve FWHM of
no better than 7.5 "arc. I at least covered a large field of view, 72 x
48 'arc, using a "fast" system, f/1.86.
BVR magnitudes for the nova star field are based on a total of 37 well-calibrated stars using my version of all-sky photometry. These "primary calibration stars" consisted of the Landolt stars in Area 111 (12 stars), Landolt stars in a region located at 16:37:21,-0:24.7 (16 stars) and a sequence established by Arne Henden for the blazar Mark 501 (9 stars). A range of air masses were used to establish extinction that encompassed a larger air mass range than was sampled for the region of interest (which I'll refer to as a "nova" for brevity).
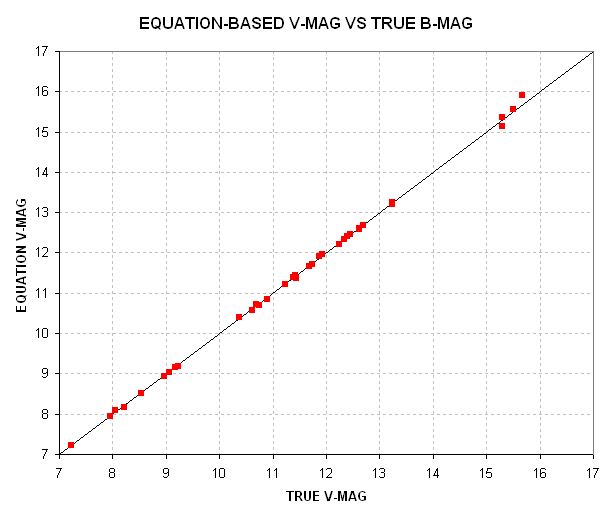
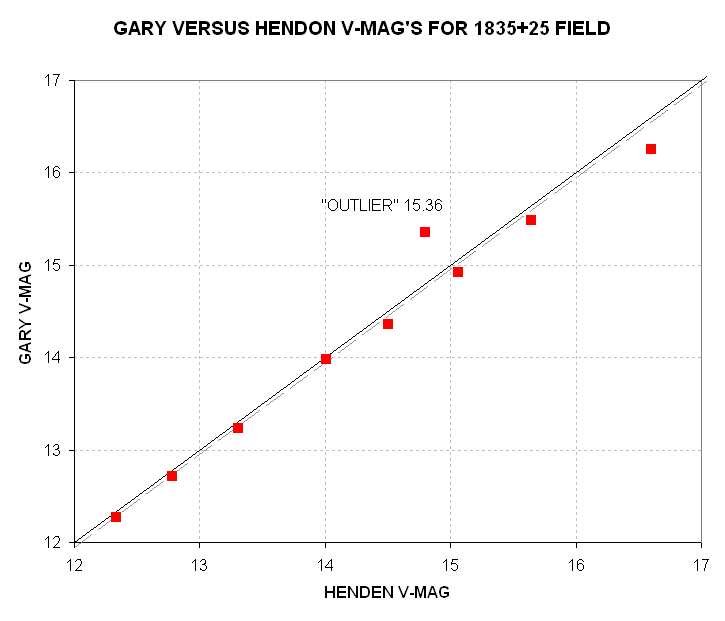
Figure 3. Landolt and Henden-measured stars (35 total) were used to derive an equation for predicting V-mag from the following independent variables: star intensity, air mass and B-V.
Predicted V-magnitude can be expressed using the following equation,
involving 4 constants:
Predicted
V-mag = Cv1 +Cv2 * 2.5 * LOG(50000/Iv) +Cv3 * (m-1.33) +Cv4 * ((B-V) -
0.90), where
Cv1 = 10.187
[mag]
related to CCD temperature, exposure time, signal aperture
size, telescope aperture, filter width and transmission,
Cv2 =
1.003
empirical scaling factor (absorbing nonlinearity issues),
Cv3 = -0.20
[mag/air mass] extinction for V-filter for the specific
atmospheric conditions of the observing site and date,
Cv4 = -0.07
related
to observing system's color response (i.e., the old CCD
transformation equation coefficients),
Iv = intensity using V-filter (integrated excess counts within
signal aperture that exceed expected counts level based on average
counts within sky reference annulus), and
m = air mass,
with
a residual RMS of 0.030 magnitude (for 31 stars brighter than Mv
= 13.5)
All star intensity measurements were made with the same "signal
aperture size" and usually the same dimensions for the annulus gap and
sky reference annulus. The RMS residual of 0.035 magnitude includes
stochastic and systematic calibration uncertainty components.
A similar procedure was used to derive an equation for converting
B-filter image star intensity [counts] to B-magnitude.
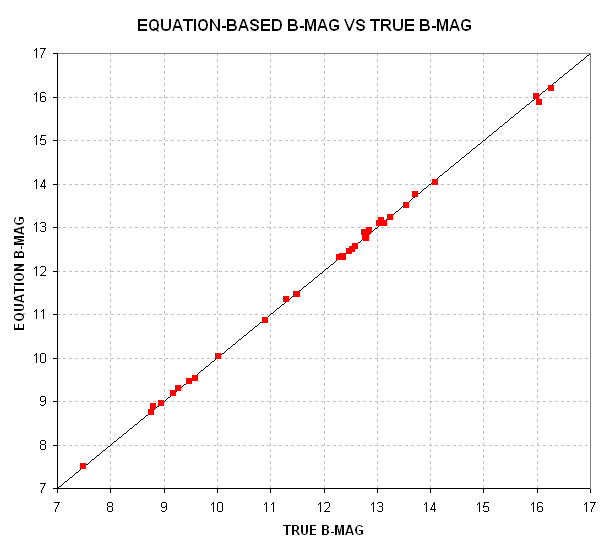
Figure 4. Landolt and Henden-measured stars (33 total) were used to derive an equation for predicting B-mag from the following independent variables: star intensity, air mass and B-V.
Predicted B-magnitude can be expressed using the following equation, involving 4 different constants:
Predicted
B-mag = Cb1 +Cb2 * [2.5 * LOG(50000/Ib)] +Cb3 * (m-1.33) +Cb4 * ((B-V)
- 0.90), where
Cb1 = 9.73
[mag]
related to CCD temperature, exposure
time, signal aperture size, telescope aperture, filter width &
transmission,
Cb2 =
1.003
empirical scaling factor (absorbing nonlinearity issues),
Cb3 = -0.25
[mag/air mass] extinction for V-filter for
the specific atmospheric conditions of the observing site and date,
Cb4 = +0.156
related
to observing system's color response (i.e., the old CCD
transformation equation coefficients), and
Ib = intensity
using B-filter (integrated excess counts within signal aperture that
exceed expected counts level based on average counts within sky
reference annulus),
with a residual RMS of 0.055
magnitude (for all 33 stars in this analysis)
And finally, a similar analysis was performed with the R-filter
images, yielding the following relationship between true R-magnitude
and measured intensity, air mass and V-R color.
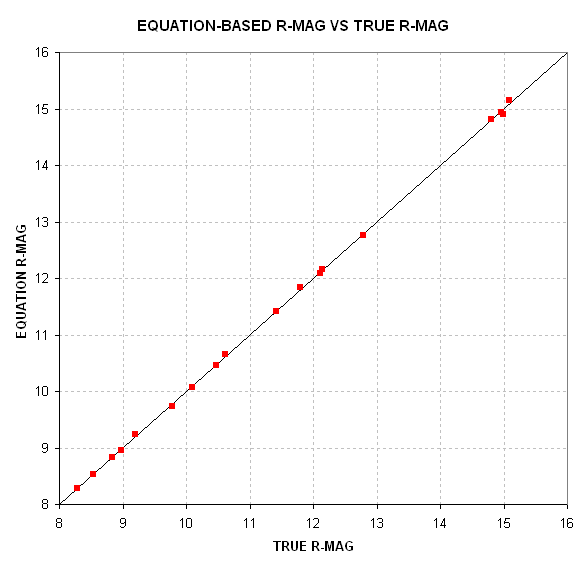
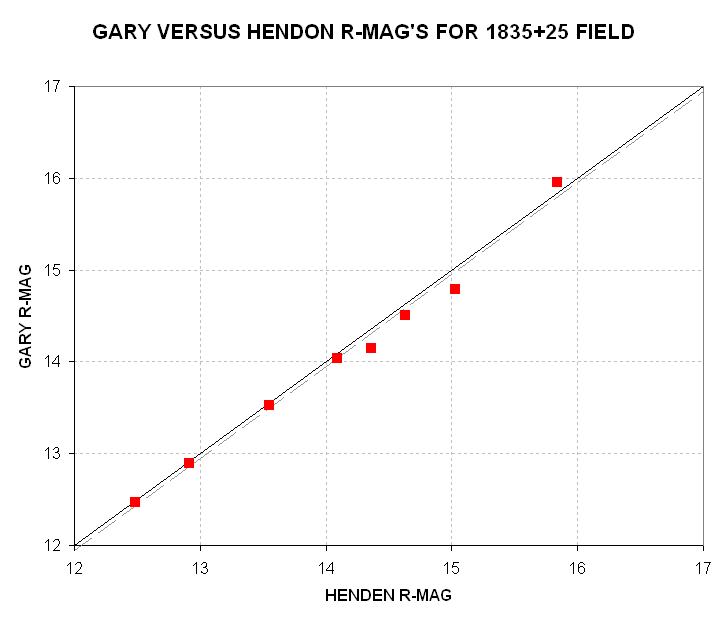
Figure 5. Predicted R-magnitude versus true R-magnitude
derived from 18 Landolt and Henden standard stars using 3 independent
variables: star "intensity," air mass and V-R color.
The R-magnitude prediction equation is:
Predicted R-mag = Cr1
+ Cr2 * [2.5 * LOG(50000/INT)] +Cr3 * (m-1.30) +Cr4 * ((V-R) - 0.53),
where
Cr1 = 10.428
[mag]
related to CCD temperature, exposure time, signal
aperture size, telescope aperture, filter width and transmission,
Cr2 = 1.010
empirical
multiplication factor (absorbing nonlinearity issues),
Cr3 = -0.19
[mag/air mass] extinction for R-filter for the specific
atmospheric conditions of the observing site and date,
Cr4 = -0.19
related to observing system's color response (i.e., the old
CCD transformation equation coefficients),
INT = intensity
using R-filter (integrated excess counts within signal aperture that
exceed expected counts level based on average counts within sky
reference annulus), and
m = air mass,
with a residual RMS of
0.037 magnitude (for all 18 stars in this analysis)
As an aside, I want to say that the standard procedure suggested for
use by AAVSO members is to convert apparent magnitude to true magnitude
using "CCD Transformation Equations" with a set of CCD Transformation
Equation Coefficients (TEC) determined once or twice per year. This
procedure has the limitation that a TEC set established under one
atmospheric extinction condition and one range of air mass values (and
one telescope configuration) cannot be expected to perform well under
different atmospheric extinction conditions and different air mass
situations (and different telescope configurations). Professional
astronomers employ a rigorous but more complicated set of
transformation equations that explicitly take into account extinction.
The procedure I am using overcomes the
limitations of the simpler transformation equations without the
complication
of the rigorous transformation equations. A more detailed description
of my procedure is being prepared at http://brucegary.net/AllSky/x.htm
The following image is a crop of a larger FOV image, showing the
region centered on the nova and the V-magnitude solutions using the
procedure just described.
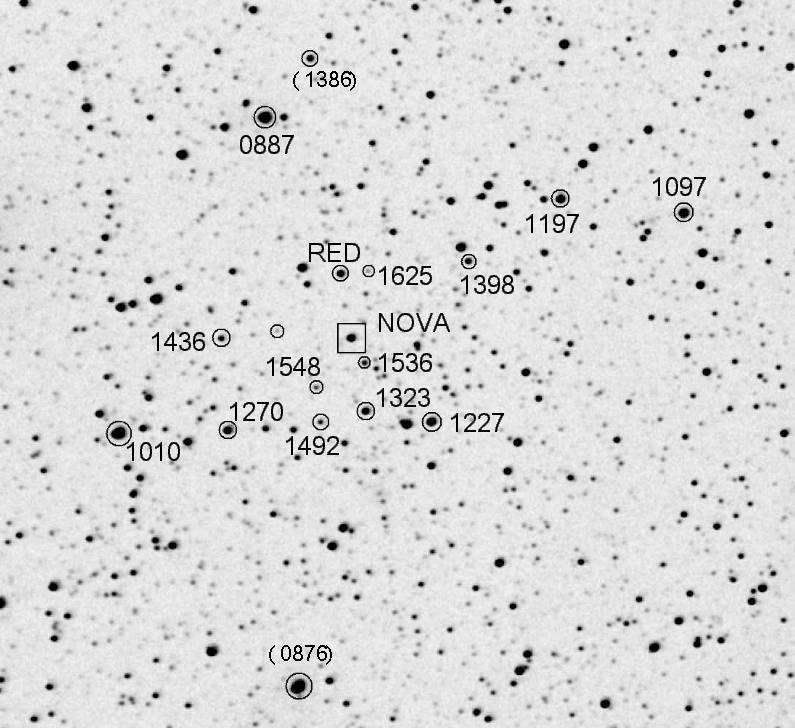
Figure 6. V-magnitudes for the nova's star field. North
is up and east to the left. FOV is 24.8 x 25.1 'arc (EW & NS). FWHM
resolution is ~8.5 "arc. The nova is shown by a rectangle, and at
the time of the images that were used for this average image (June
19.7 UT) the nova had a V-magnitude of 12.75. An
extremely red star (possibly variable, according to Lew Cook) is
located at 18:39:27.46, +26:06:14.3.
The following table shows B, V and B-V values for most of the stars
in the previous figure (for June 19.7). The error entries are the
orthogonal sum of measured stochastic SE uncertainty and estimated
calibration SE uncertainty.
Table I - Summary of BVR
Magnitudes for calibrated stars and 1835+25
("1835+25a"
is for June 19.23 UT, "1835+25b" is for June 28.18 UT)
| Object |
B mag |
V mag |
R mag |
B-V |
| 1835+25a |
12.67 +/- 0.05 |
12.66 +/- 0.04 |
12.59 +/- 0.04 |
+0.01 +/- 0.06 |
| 1835+25b |
12.53 +/- 0.04 |
13.53 +/- 0.04 |
+0.00 +/- 0.07 |
|
| Star 1323 |
13.88 +/- 0.04 |
13.23 +/- 0.04 |
12.89 +/- 0.04 |
+0.65 +/- 0.06 |
| Star 1492 |
15.78 +/- 0.07 |
14.92 +/- 0.04 |
14.51 +/- 0.04 |
+0.86 +/- 0.08 |
| Star 1548 |
16.09 +/- 0.10 |
15.48 +/- 0.05 |
14.79 +/- 0.04 |
+0.61 +/- 0.11 |
| Star 1625 |
17.13 +/- 0.25 |
16.25 +/- 0.15 |
15.95 +/- 0.10 |
+0.88 +/- 0.29 |
| Star 1270 |
13.18 +/- 0.04 |
12.71 +/- 0.03 |
12.47 +/- 0.06 |
+0.47 +/- 0.06 |
| Star 1010 |
10.70 +/- 0.04 |
10.10 +/- 0.04 |
9.78 +/- 0.06 |
+0.61 +/- 0.06 |
| Star 0887 |
09.46 +/- 0.04 |
08.87 +/- 0.04 |
8.54 +/- 0.06 |
+0.60 +/- 0.06 |
| Star 1197 |
12.43 +/- 0.04 |
11.96 +/- 0.03 |
11.76 +/- 0.04 |
+0.47 +/- 0.06 |
| Star 1227 |
13.32 +/- 0.04 |
12.27 +/- 0.03 |
11.73 +/- 0.04 |
+1.05 +/- 0.06 |
| Star 1536 |
15.46 +/- 0.08 |
(15.36+/-0.06) |
14.15 +/- 0.08 |
+0.09 +/- 0.10 |
| Star 1436 |
15.10 +/- 0.05 |
14.36 +/- 0.04 |
14.04 +/- 0.07 |
+0.74 +/- 0.07 |
| Star 1398 |
14.82 +/- 0.05 |
13.98 +/- 0.04 |
13.53 +/- 0.05 |
+0.84 +/- 0.07 |
| Star 1097 |
12.03 +/- 0.04 |
10.97 +/- 0.04 |
10.40 +/- 0.06 |
+1.06 +/- 0.06 |
| Red Star |
15.88 +/- 0.07 |
14.19 +/- 0.04 |
12.59 +/- 0.10 |
+1.69 +/- 0.09 |
The following image is a color version of the a FOV slightly larger
than the preceding image.
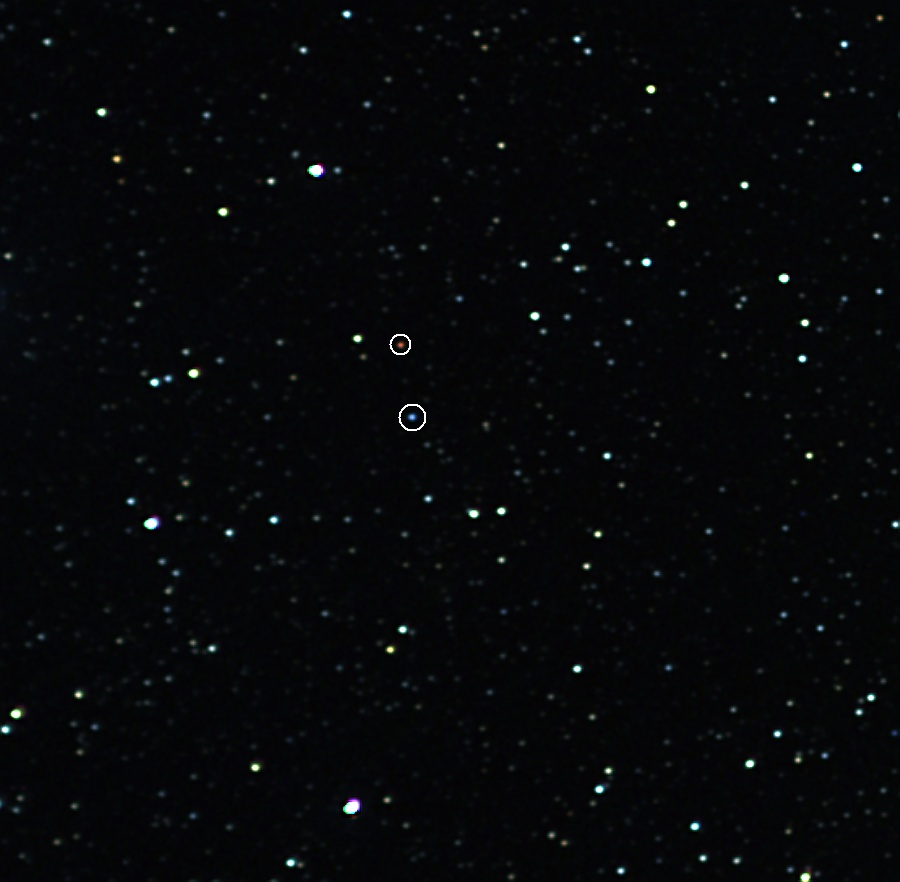
Figure 10. RVB color image of 25.9 x 25.3 'arc FOV,
showing 1835+25 circled (blue) and the "red star" circled.
A larger FOV color image is shown below.
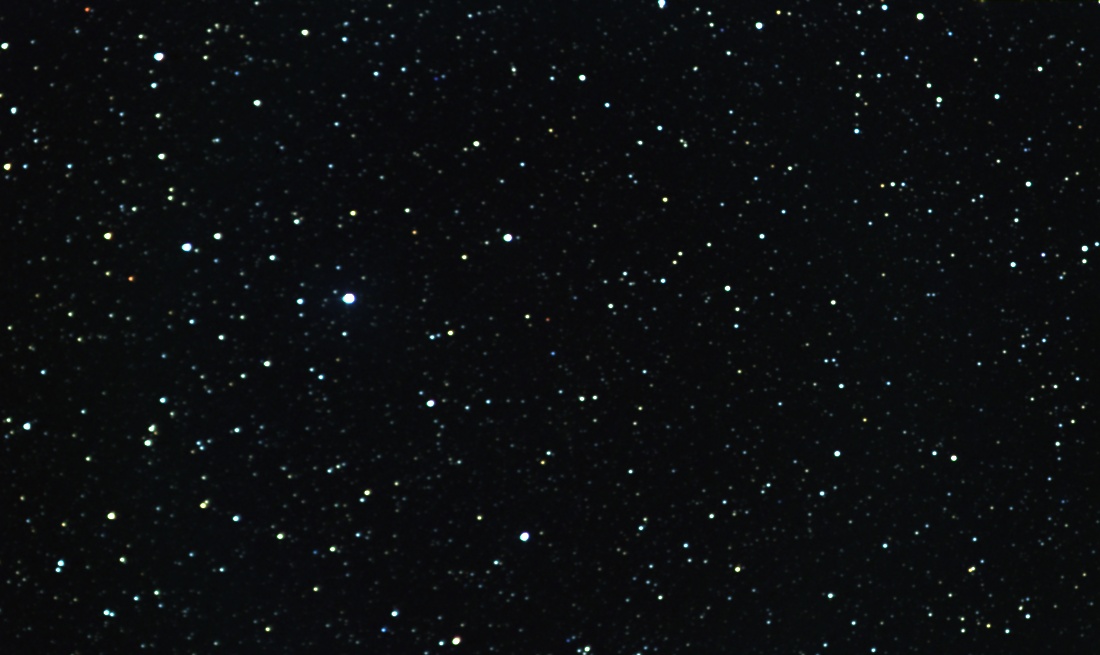
Figure 11. This RVB image is for a FOV = 67.4 x 40.2
'arc. Note that the "plate scale" is slightly different than for the
preceding images. As before, north is up, east is to the left.
[Celestron CGE-1400, HyperStar prime focus transition lens, SBIG CFW-8,
Custom Scientific filters, SBIG ST-8XE CCD; exposure times are 16x10s,
13x10s and 17x10s for R, V and B; Hereford, AZ]
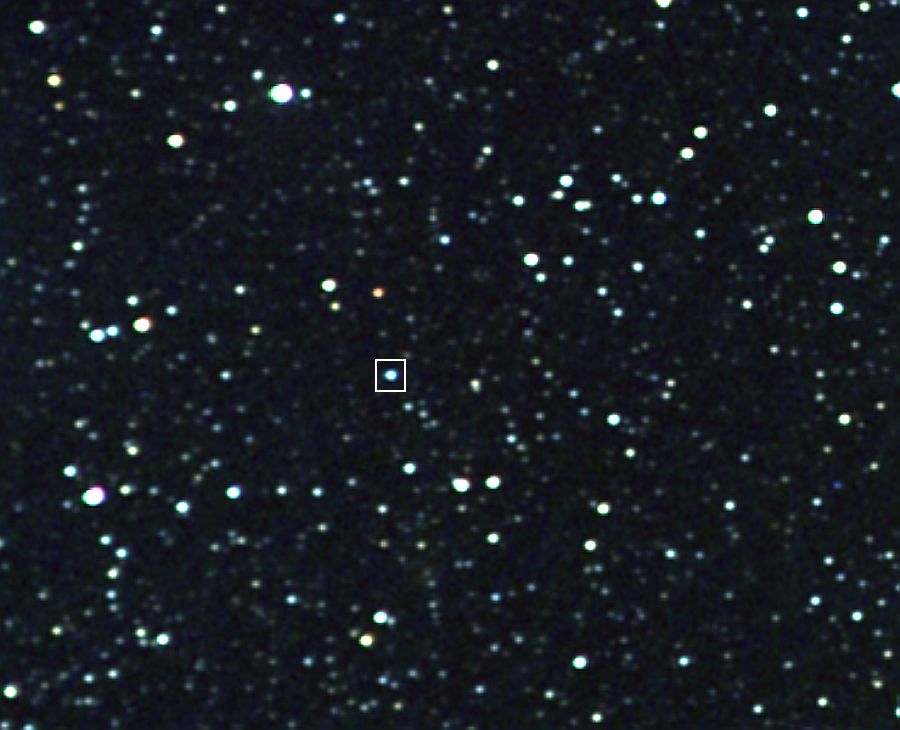
Figure 12. Zoom factor 2.5 of center region of
previous image (plus some sharpening and Gamma adjust), showing fainter
stars. The box surrounds 1835+25. FOV = 17.3 x 14.0 'arc.
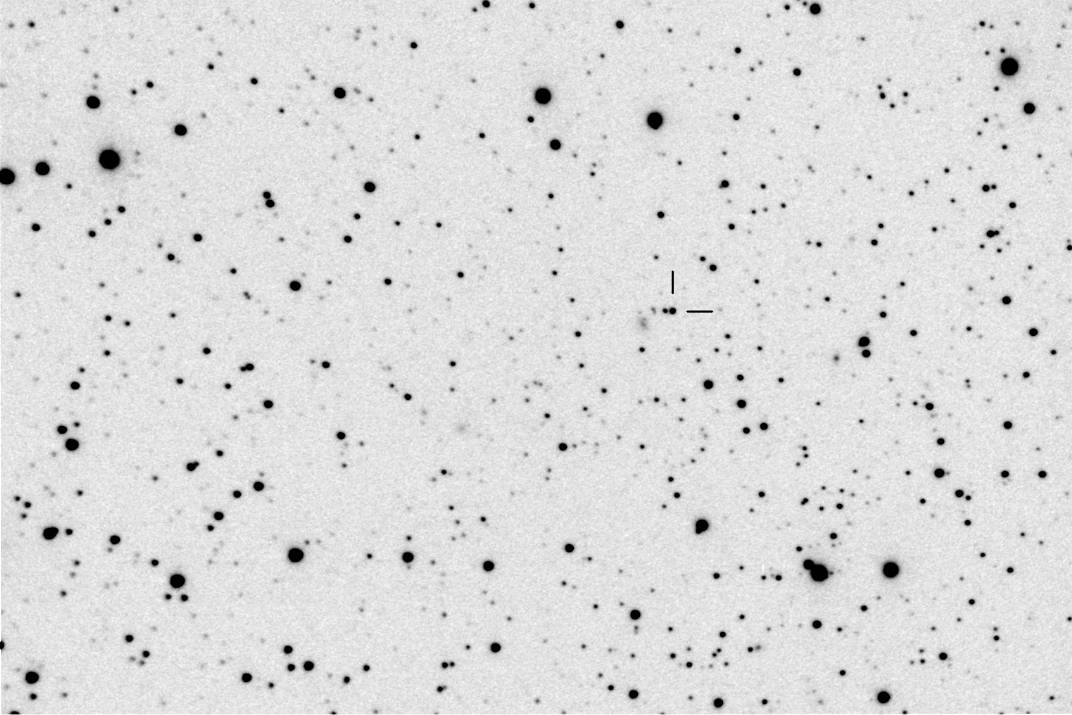
Figure 13. "Deep"
exposure using 14-inch Celestron in Cassegrain configuration during
good seeing. [Celestron CGE-1400, AO-7 tip/tilt image stabilizer, SBIG
ST-8XE CCD; 15-minute total exposure, unfiltered; 2004.08.22; Hereford,
AZ]
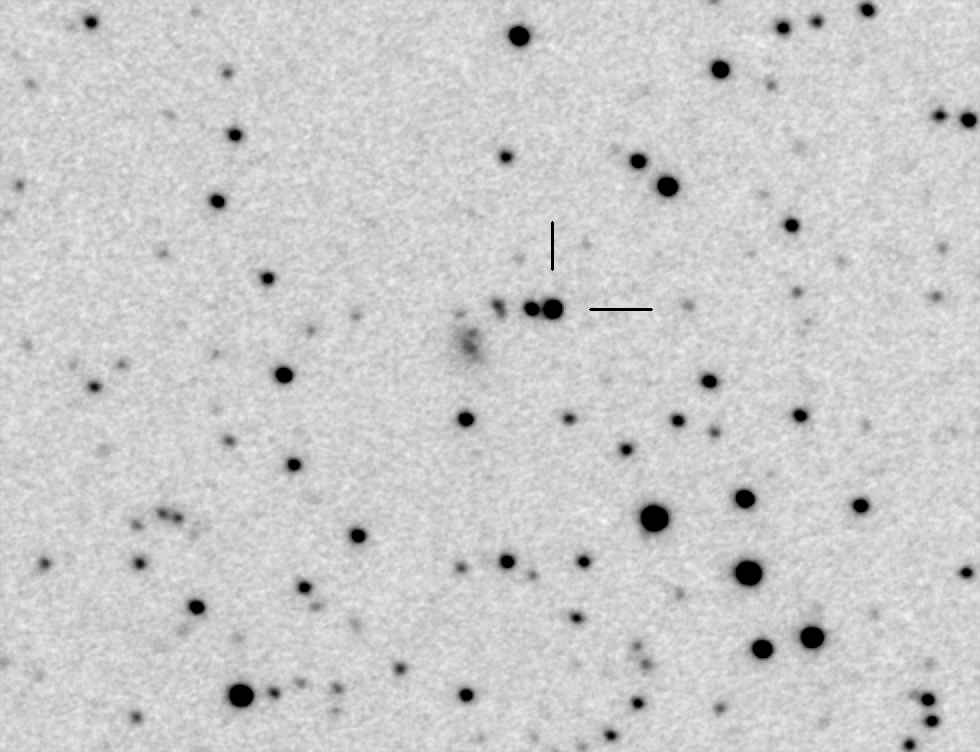
Figure 14. Enlarged crop
of previous image. Faintest stars have a magnitude of 21.5. FWHM is 2.3
"arc. The CV is indicated by two lines. Immediately to the CV's left
(5.0 "arc east) is a star with Mv = 16.9. Farther to the left is either
a pair of fainter stars or a galaxy. To the lower-left of this object
is a galaxy with maybe a foreground star superimposed on its northern
edge. At the time of this image the CV had a magnitude of 16.6. The
purpose for this image was to attempt to resolve the CV's faint
companion 1.1 "arc to the southeast but with a "seeing" FWHM of 2.3
"arc this wasnot possible.
Variation
During Observing Session
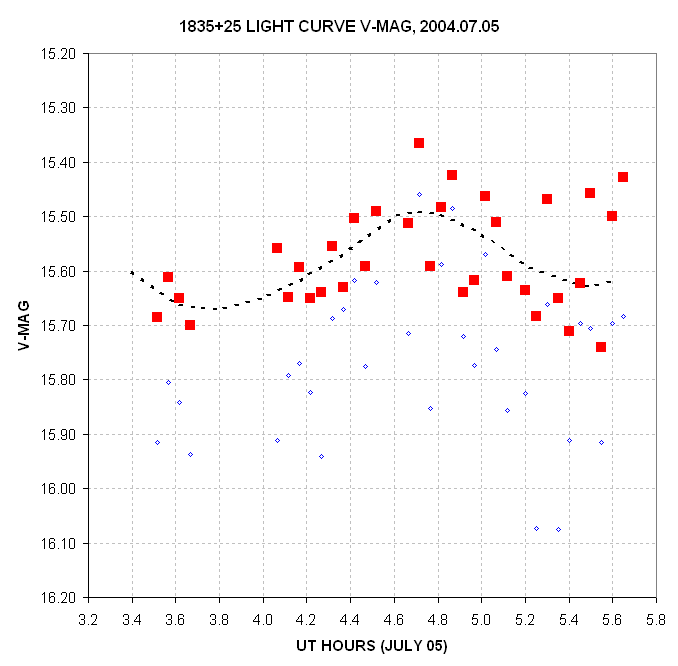
Figure 15. Variation during an observing session when
1835+25 was quiescent. Solid red squares are from a 400-second total
exposure (3-minute data sequence) median combined image. The small blue
diamonds are an attempt to remove the effect of the nearby star 11" arc
to the east. All measurements are corrected for system color response.
The measurements plotted in this figure are not adequate to state
that 1835+25 was variable during the 2.4-hour observing session.
Webmaster e-mail address: B L G A R Y @ u m i c h . e d u
Return to Bruce's
AstroPhotos
____________________________________________________________________
This site opened: June 19, 2004 . Last Update: March 31, 2006