This web page summarizes my observations of Ceres during the 2014 opposition. I present solutions for H & G, for each of the six Framing Camera "color" filter bands. Geometric albedo versus rotation phase is presented for each band.
Recent Update History
2015.01.13 Added link to calibration description web
page: link
(in progress)
2015.01.11 Added HG plot with
rotation variation removed; scatter is slightly better
2015.01.10 Added new data file
(DR20150110), plots of H(WL) and G(WL), & plot pairs
showing phase functions and brightness variation with rotation
for each FC band.
2014.09.17 Updated flux table
txt-file (DR20140916); added phase function plot.
2014.06.15 Completed observations and
analysis of Ceres FC observations.
Downloadable text file of Ceres
fluxes: DR20150110
H & G vs. Wavelength
The two plots are based on BLG data only. JYL plot points are based on a data file that had the wrong phase angle listed for May 8 data, so I need to update those points. The H values are in excellent agreement, while the G values are slightly different. This might be caused by the bad May 8 phase angle, so the JYL G points should be updated.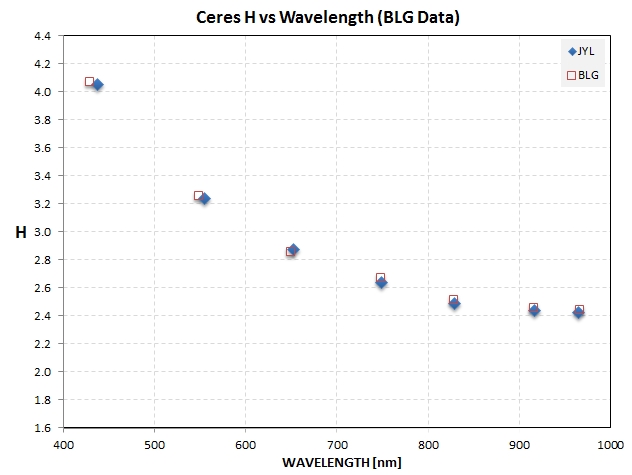
Comparing two solution sets for H vs. wavelength from same data (JYL used data with wrong phase angle for May 8 data (my fault)).
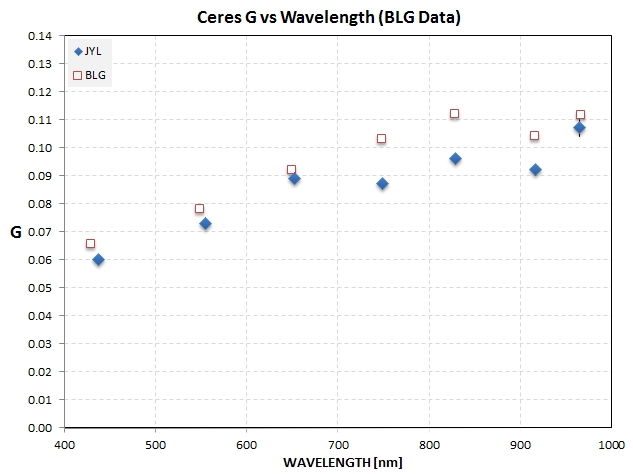
Comparing two solution sets for G vs. wavelength from same data (JYL used data with wrong phase angle for May 8 data (my fault)).
Note that since both JYL and BLG analyses give the same H values both analyses will also yield the same geometric albedos.
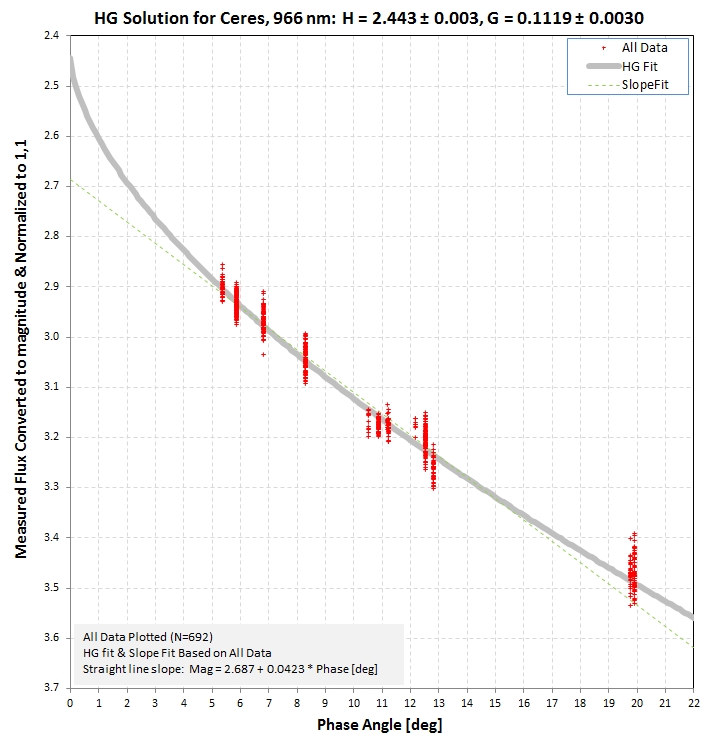
Note also that the pattern of a drop in G value at 915 nm suggests that Band I effects might be responsible for the G feature.
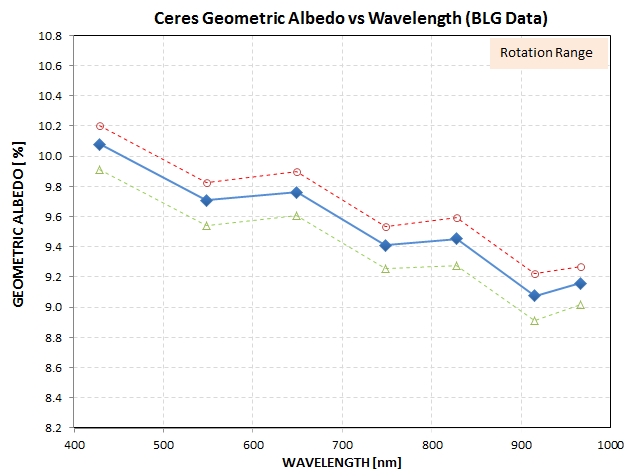
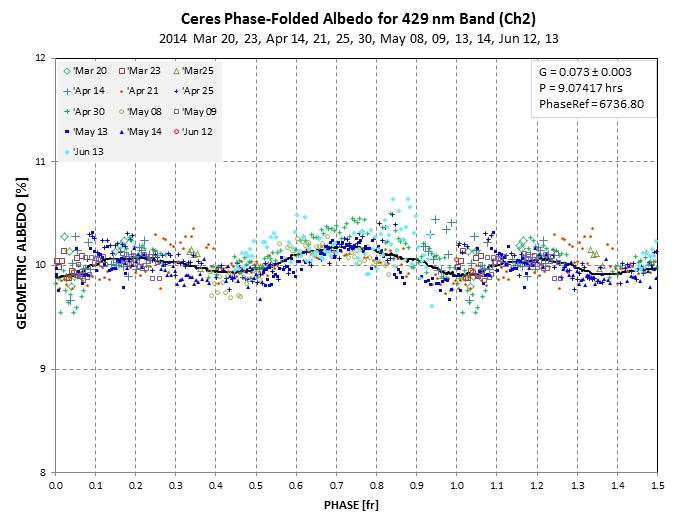
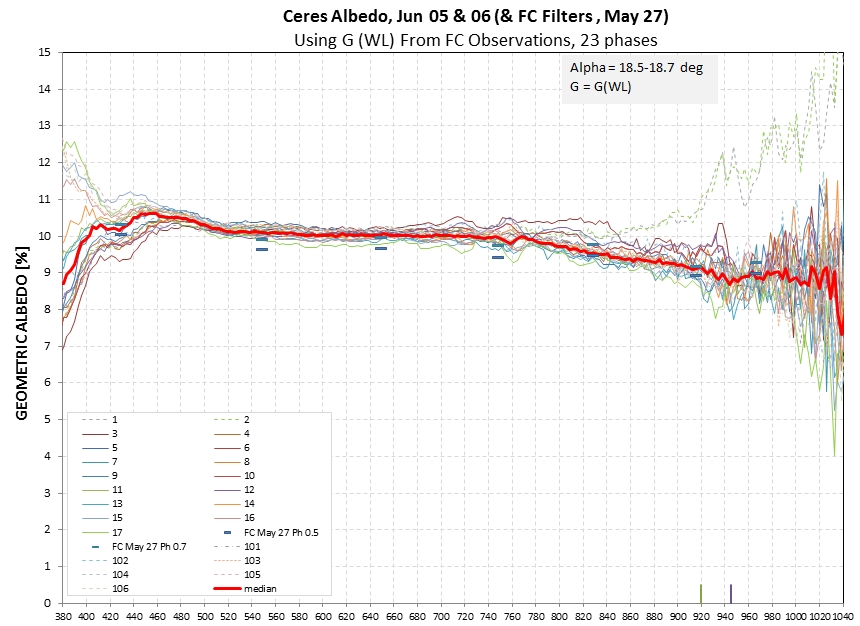
Upper and lower traces show maximum and minimum albedos during a rotation.
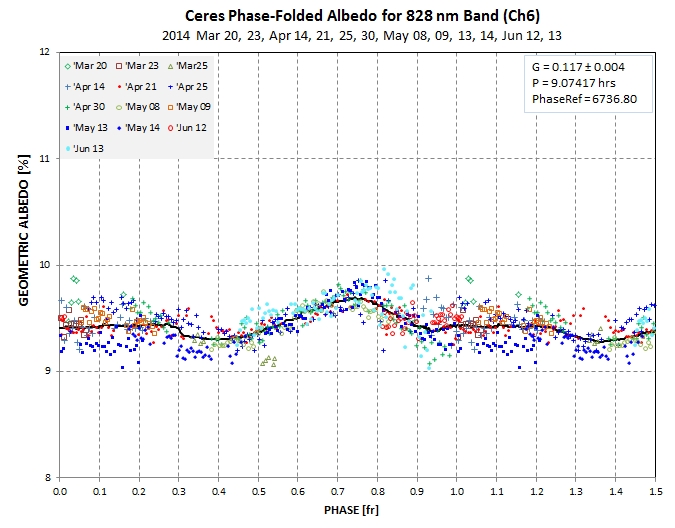
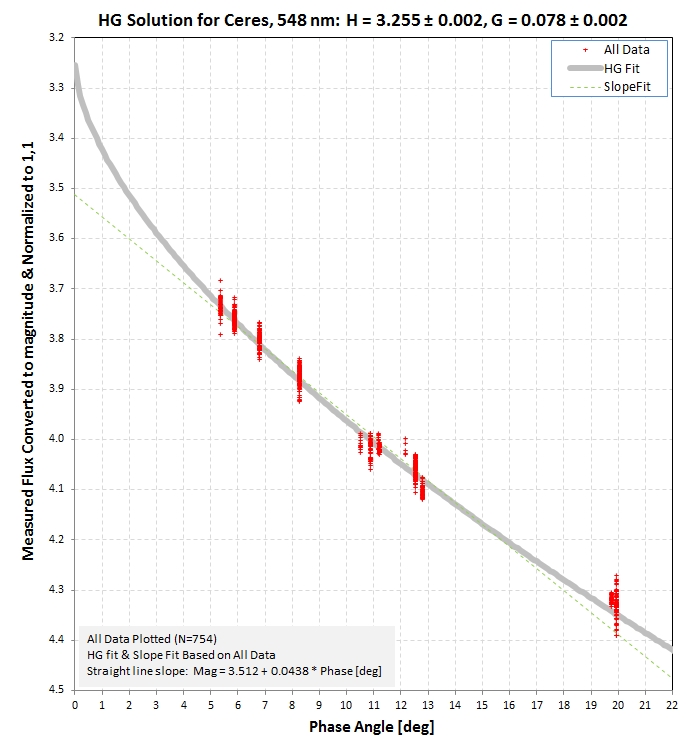
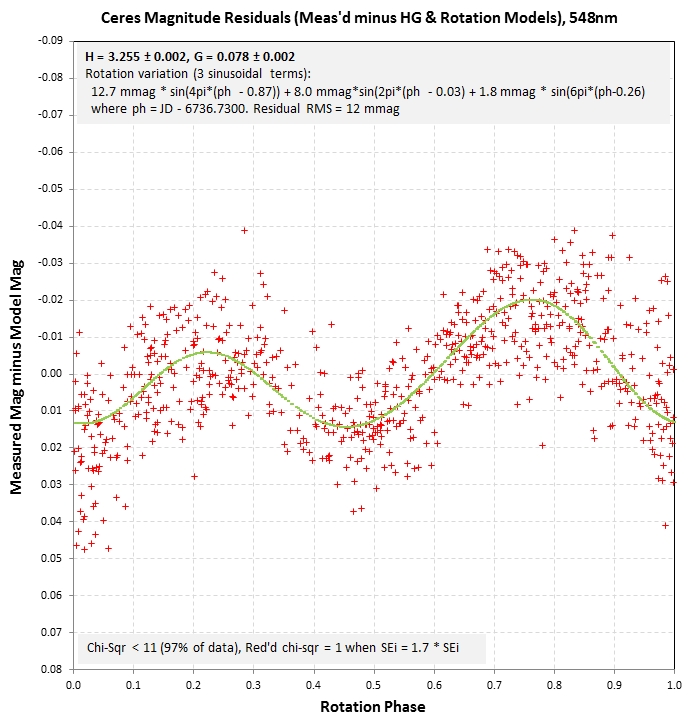
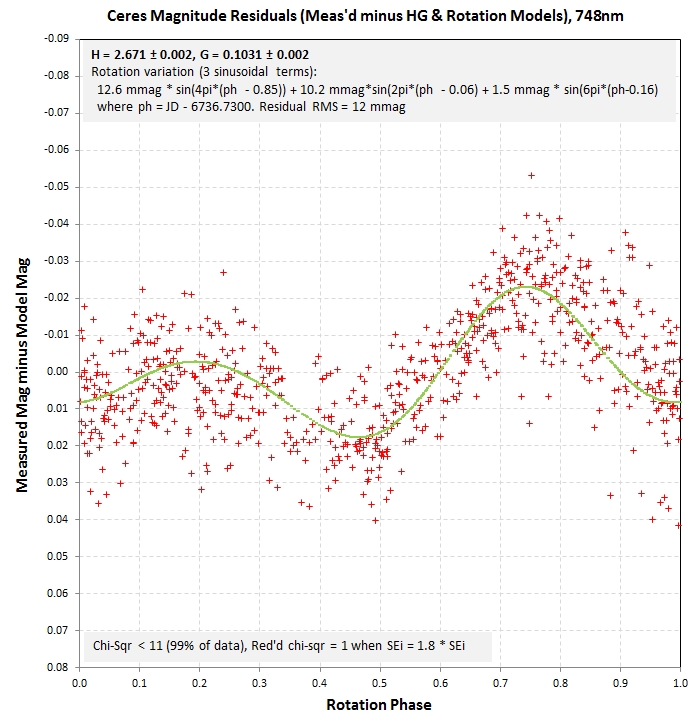
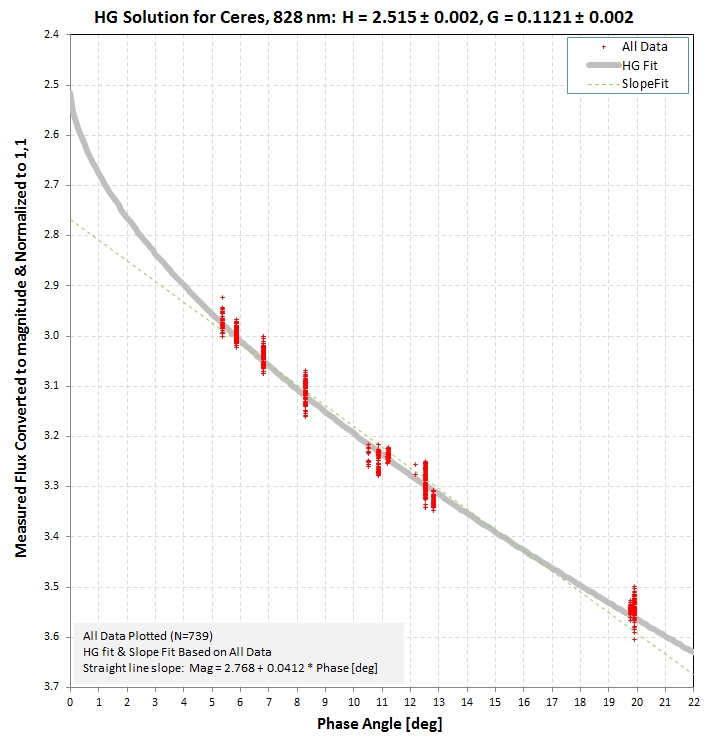
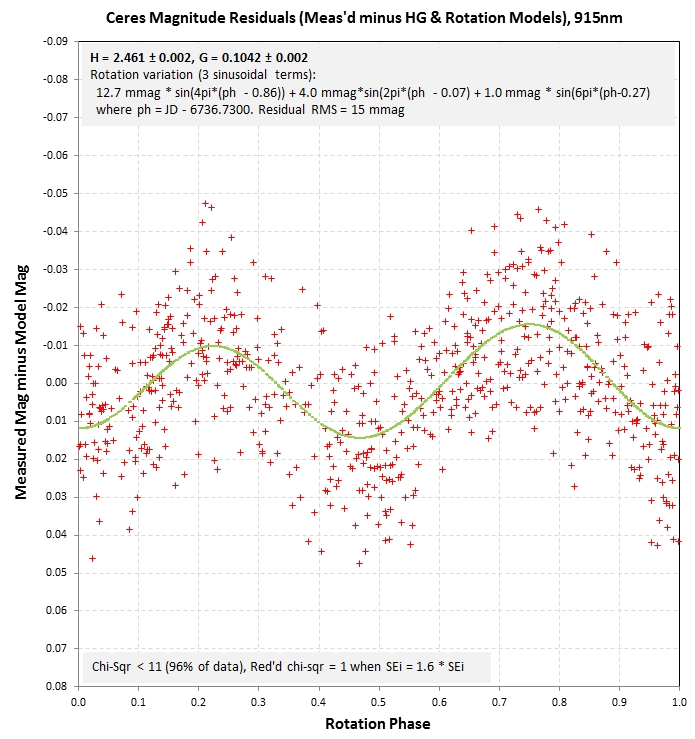
Phase Functions and Rotation
Variation
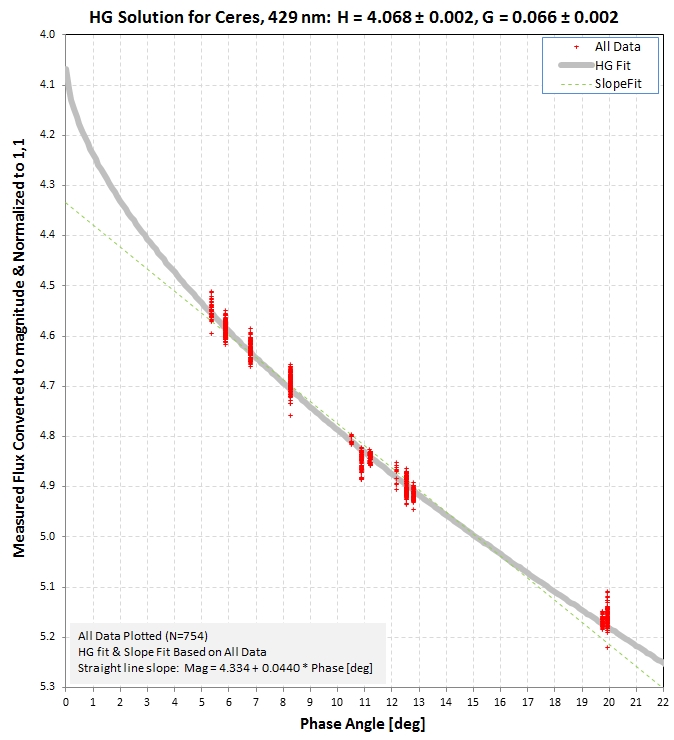
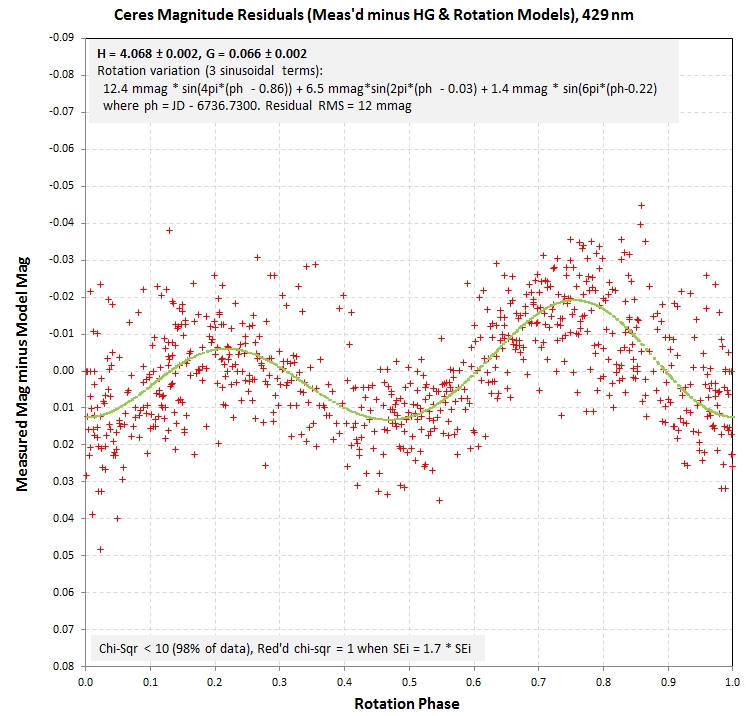
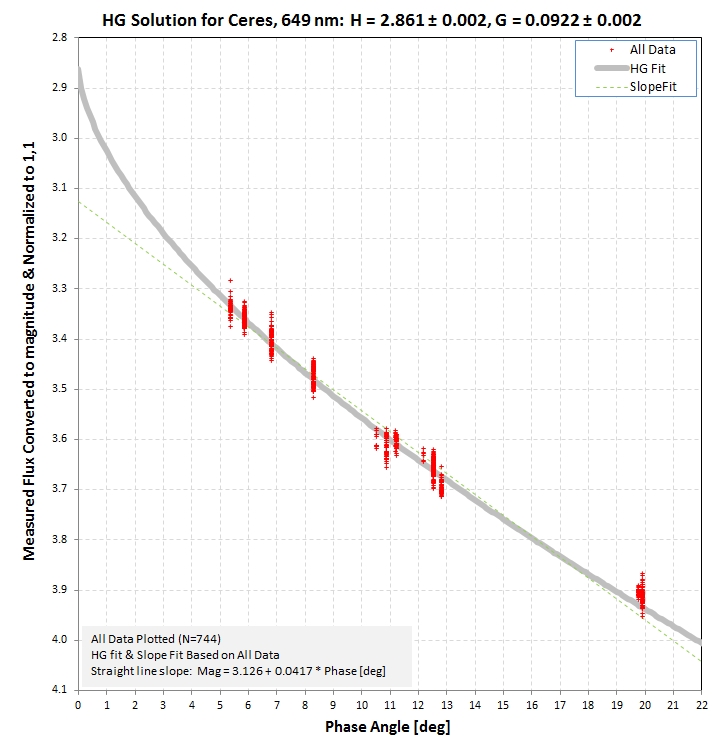
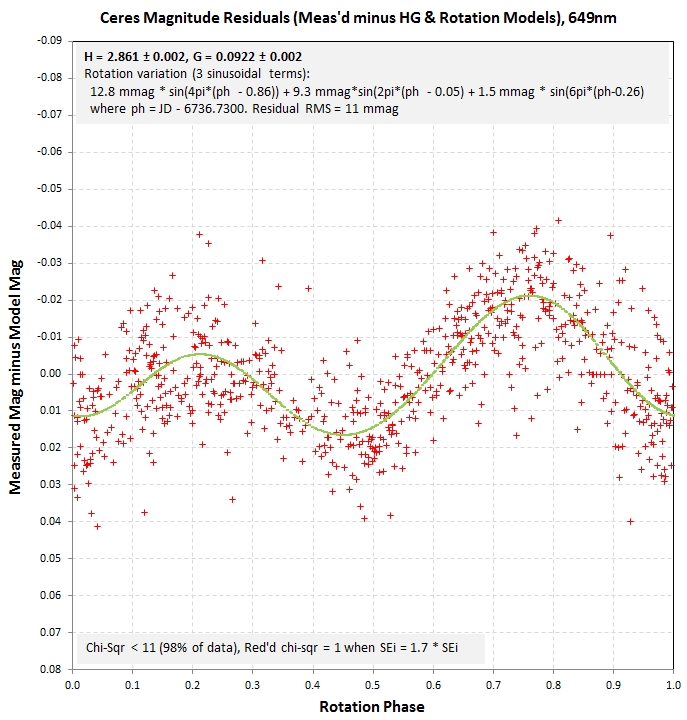
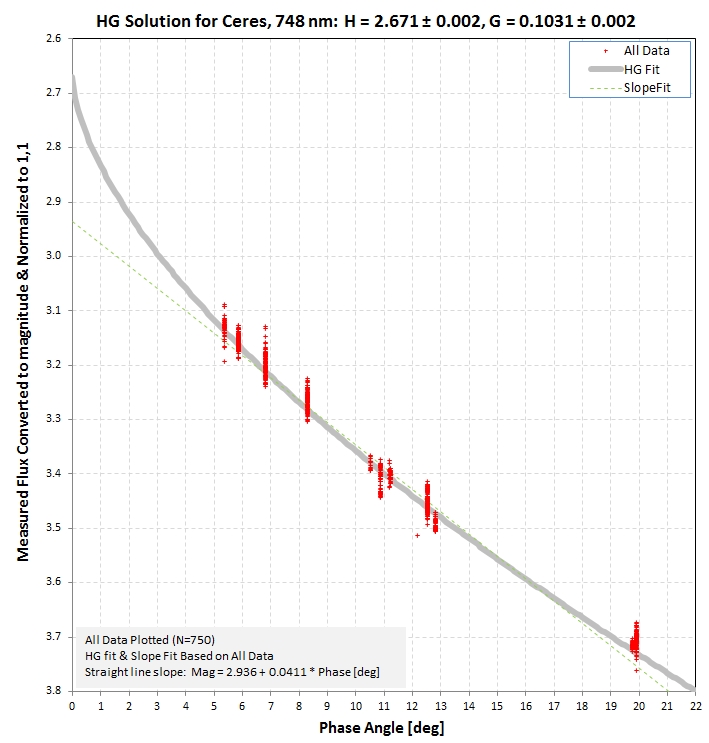
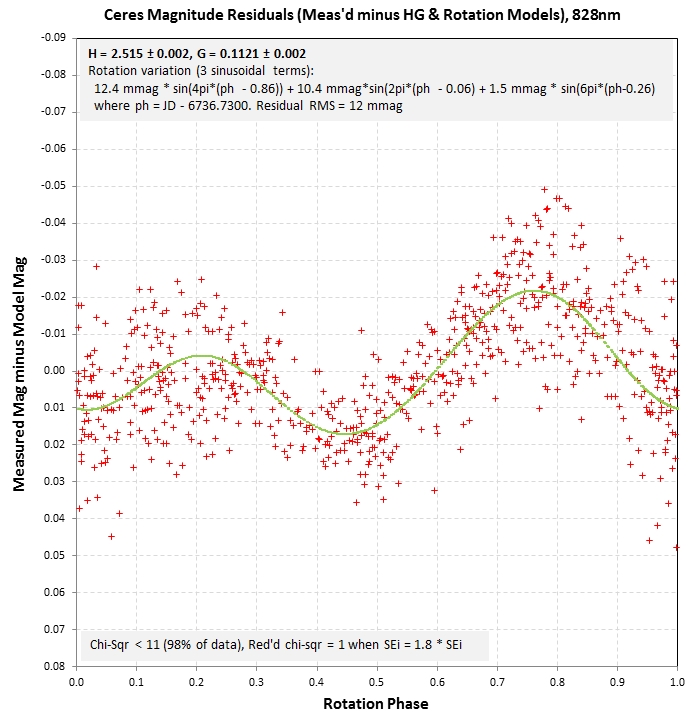
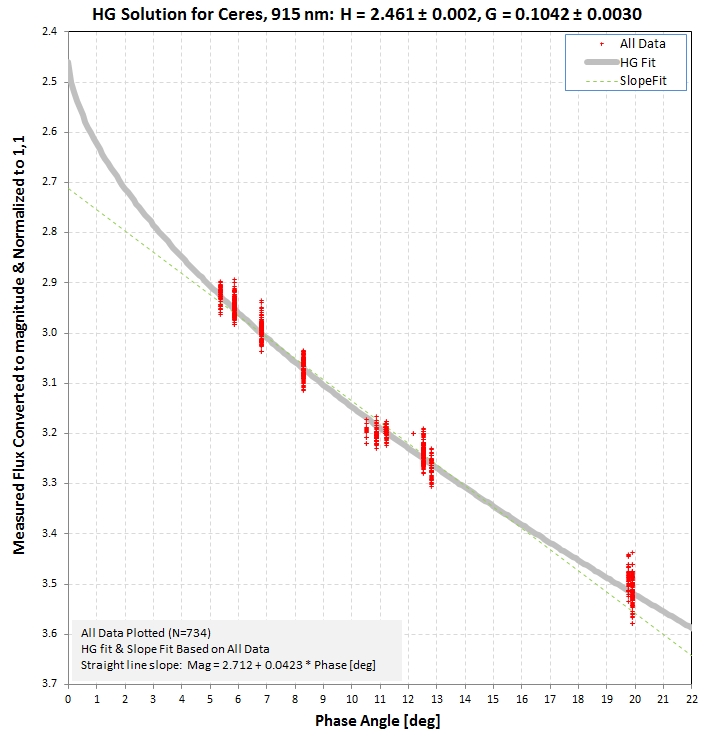
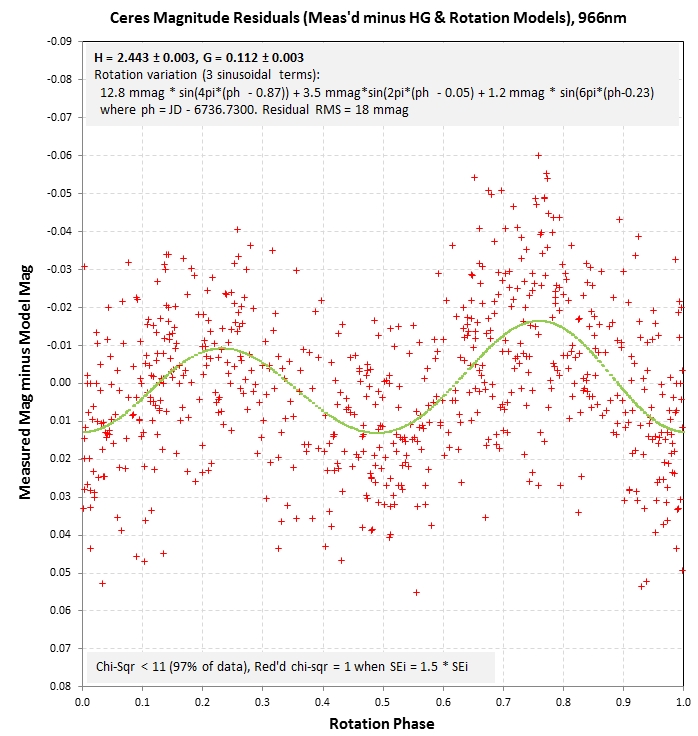
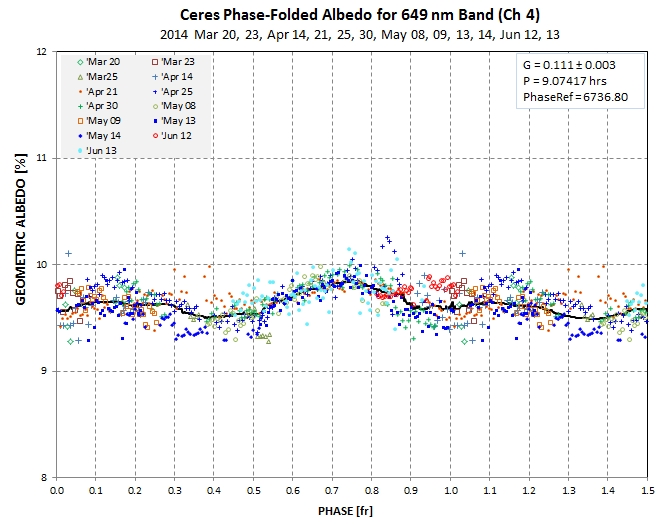
One more HG fitting is possible: since we have a rotation variation model let's remove it from the plot of HG data! This should reduce the scatter of points and be more representative of the HG relation. The next pair of plots, for 649 nm data, shows that there is a small improvement.
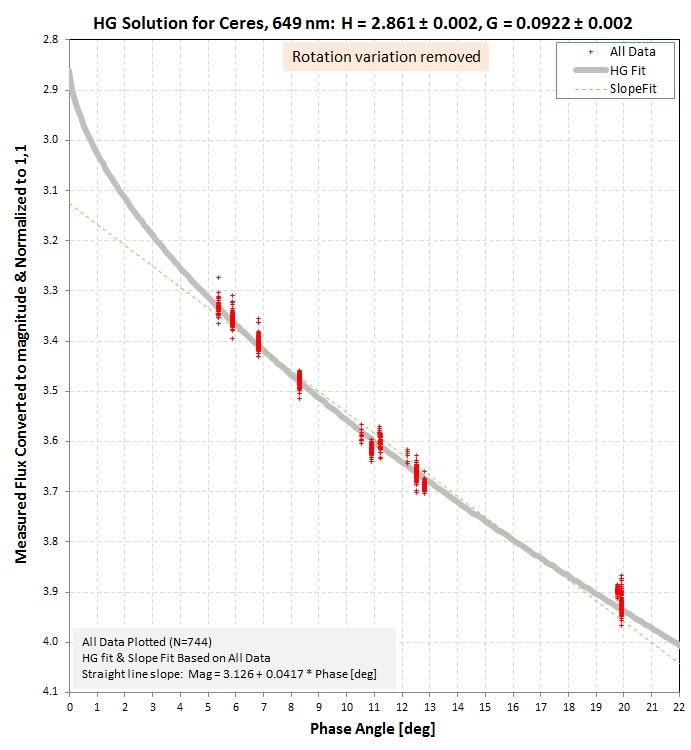
Before and after removal of rotation variation, showing a slight reduction of scatter.
SOME MATERIAL BELOW HERE NEEDS TO BE UPDATED! WILL DO IN NEXT FEW DAYS.
Albedo Spectrum
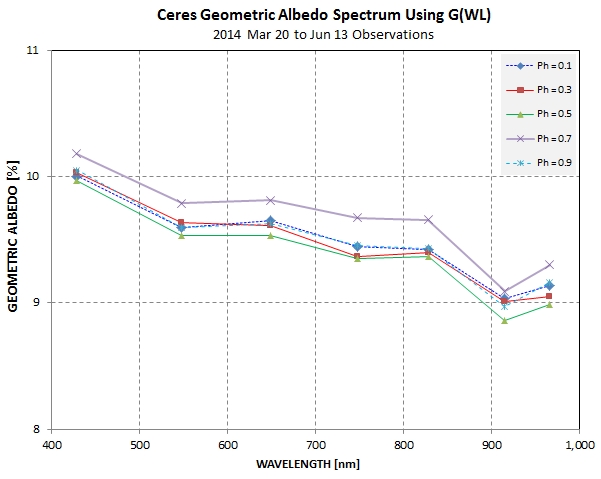
Geometric albedo spectrum for selected phases from all data to
date (Mar 20 to Jun 13), using a phase parameter G shown in
the next graph.
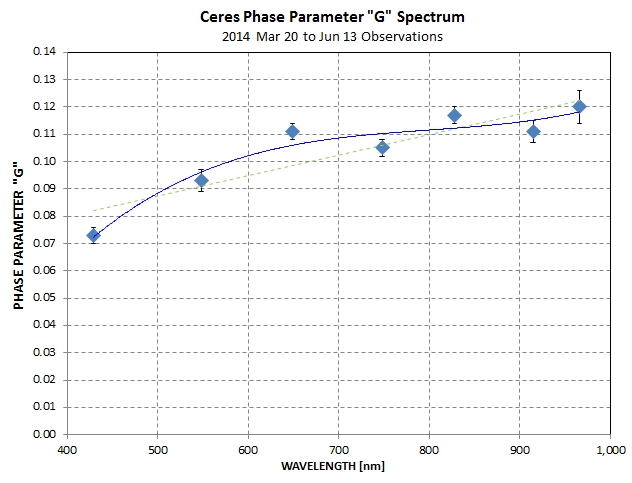
Dependence of phase parameter G on wavelength (WL).