Throughout this MTP tutorial I will rely on the approach of successive approximations in describing concepts and procedures. In this chapter we will assume many things, some of which might occur in the real world, but all of which will have to be dealt with in more detail in later chapters.
Recall from Chapter 4 that with the MTP mounted in an airplane flying at the altitude Zo, the "applicable altitude" Za is related the "applicable range" Ra for any viewing angle above the horizon, theta, by the following equation:
Za = Zo + Ra * sine (theta)
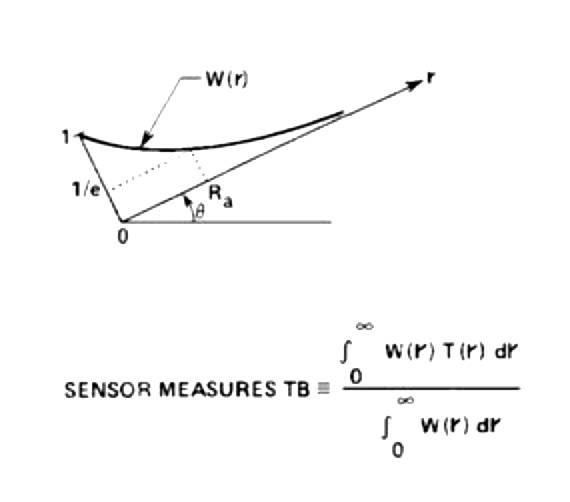
and recall further that the MTP measures brightness temperature versus theta, TB(theta), as summarized in the following figure (repeated from Chapter 4).
and recall further that the MTP measures brightness temperature versus theta, TB(theta), as summarized in the following figure (repeated from Chapter 4).

Figure 6.1. Geometry of an MTP looking in a direction inclined above the horizon and measuring a brightness temperature, TB, that is approximately equal to the atmosphere's temperature at an applicable range Ra. (Repeat of Fig. 4.1)
The other assumption for this figure is that the temperature field is horizontally stratified. This is equivalent to requirng T(z) be a linear function above (or below) the aircraft.
As this figure shows, the weighting function versus range, W(r), has the shape of an exponential function. The shape would be exactly the same as an exponential only if the atmosphere's absorption coefficient, Kv, were constant along the line of sight. If this were the case we could assume that Ra = 1/Kv. For frequencies near 60 GHz and altitudes below ~18 km, this assumption is acceptable because Kv is so high that Ra is small, which means that density and temperature are not likely to change much thoughout the altitude regime that matters (~2 * Ra).
For the more realistic case of temperature and air density changing with range (ie., changing with altitude), an equivalent Ra can be calculated. For upward viewing the equivalent Ra will be larger than 1/Kv, whereas for downward viewing it will smaller. The equation for Ra is
Ra = Integal {z * W(z) * dz} / Integral {W(z) * dz}
It is possible to calculate a table of Ra values corresponding to a range of altitudes and air temperatures. In the early days I interpolated within such a table to calculate a most likely Ra for use with each scan cycle.
It is straight forward to convert a measured TB(theta) to T(z), by reversing the order of the equation for TB, TB(theta) = T(Ra*sine (theta)):
T(Ra*sine(theta) = TB(theta)
This situation can be likened to using a long stick with a temperature sensor at the end, and waving it up and down along a vertical plane described by the MTP scan plane, as illustrated in the following figure.
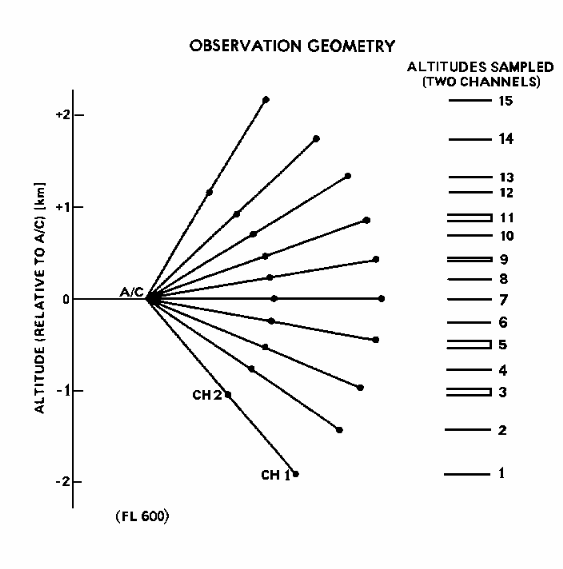
Figure 6.2. Considering MTP equivalent to a long stick with a temperature sensor at the end, an MTP scan sequence of 10 elevation angles corresponds to waving the stick through the same 10 angles. A 2-channel MTP corresponds to having two temperature sensors on the stick. Each "dot" corresponds to the Ra location for the respective elevation scan angle and channel.
The figure shows altitude sampling for the first MTP flown aboard an ER-2. It was a 2-channel MTP (57.3 and 58.8 GHz) and at 60,000 feet Ra for Channel 1 was about twice the value of Ra for Channel 2 (2.5 and 1.5 km). The altitude scale on the left corresponds to flight at ~60,000 feet for that specific MTP. The markings on the right show how some of the redundant observables were combined to form a set of 15 "quasi-independent" observables. (As will be explained in the next chapter the "information" content of the obervables used to infer temperature at nearby altitudes is not independent.)
In case you're bothered by the fact that an airplane flies horizontally though the air, and does not hover at one location - as the above figure assumes - consider the following figure as a truer representation of where the MTP is really sampling air during an observing cycle.
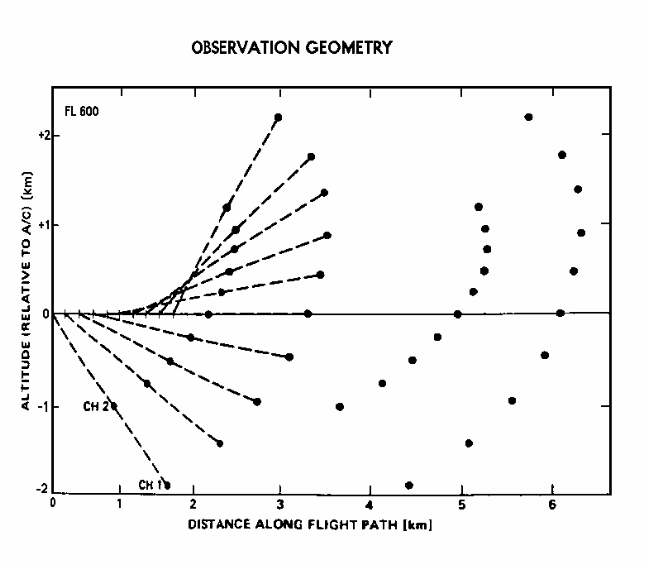
Figure 6.3. As the MTP moves with the airplane during an upward scanning observing cycle (~14 seconds per scan), the air sampled at each scan location is offset horizontally in the forward direction from the previous location. In this figure the horizontal and vertical scales are approximately the same, so the sampling locations are approximately accurate in their relationship to each other.
If the isopleths of air temperature are horizontal, then the forward motion of the airplane can be ignored. Even while flying through a mountain wave the slope of the temperature isopleths is small, almost always <1.5 degrees, which corresponds to a similarly small scan elevation error for the MTP, and errors associated with neglecting this effect are small.
I call this the "Poor Man's Retrieval Procedure" since it asks very little of the user. You don't need a computer to do it, since a hand calculator is sufficient, and poor men can afford at least a calculator. For several years I used this poor man's retrieval procedure, and it was good enough to determine many aspects of atmospheric behavior that led to real scientific results. I will give four examples to illustrate this: 1) mountain waves extended upward through the tropopause (in the antarctic), 2) their amplitude increases with altitude in agreement with a theoretical prediction of Wave Amplitude = constant / (air density), 3) there is an ever-present component of mesoscale waves (of vertical motion) and the amplitude of these waves is greater over land compared to over ocean, and 4) Richardson Number decreases while approaching a clear air turbulence patch.
As simple-minded as this procedure is for converting measured TB from a scan to T(z), it still has its uses after creating elaborate, multi-stage "statistical retrieval" procedures. The sophisticated procedures can be so complicated that small errors may creep into the analysis and not be readily noticed. When a subtle MTP misbehavior is noticed I recommend using a hand calculator to perform a "reality check" using the "poor man's retrieval procedure."
I should mention here that there are two situations where this procedure's failings are serious: 1) when transparency is present (a possibility at high altitudes and low frequencies), and 2) during flight about one kilometer above or below a sharp temperature feature, commonly found at the tropopuase.
Transparency means that Kv is so low that Ra is comparable to the atmosphere's scale height and for the highest elevation scan position, and for the lowest MTP frequency (far away from 60 GHz), some of the photons being received by the MTP are coming from outer space (the 2.7 K cosmic background). Stated another way, if the MTP were a transmitter some of the transmitted photons would excape the atmosphere. When transparency occurs the TB values can be lower than the coldest air temperature in the entire atmosphere. Such TB values contain "information," but that information can't be used by the "poor man's retrieval procedure."
The other situation corresponds to a violation of our assumption of a linear behavior of air temperature versus distance along the viewing direction. The effect of this can be illustrated by the following figure, showing what the "poor man's retrieval procedure" would show for flight at three altitudes near a "sharp" tropopause.
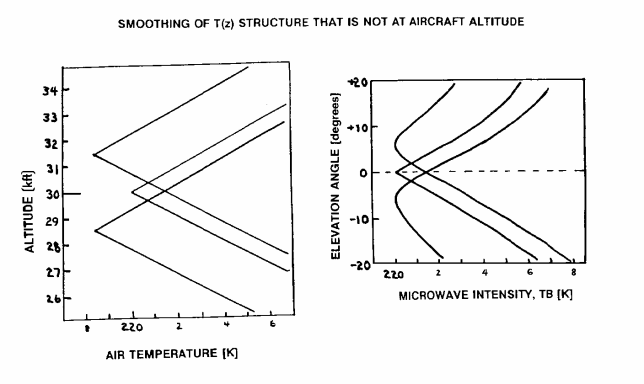
Figure 6.4. Temperature profiles like those in the left panel will produce "poor man's retrieval" results for T(z) like those in the right panel, assuming that the MTP is at 30,000 feet altitude in each case. The tropopause "sharpness" is reduced in all cases except for flight exactly at the tropopause.
In the early days I of course knew that tropopause features and other abruipt inflections would be smoothed if the MTP was not at the exact same altitude as the temperature inflection. With this in mind it was possible to glean a lot of information from a swquence of T(z) profiles, as the following figure illustrates.
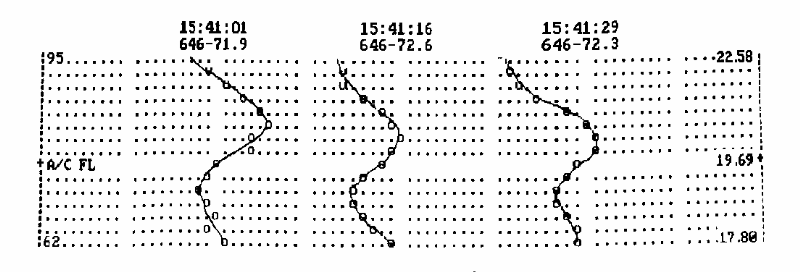
Figure 6.5. Temperature profiles based on the "poor man's retrieval procedure" during flight within an inversion layer. Each column represents 0.25 K and each row represents 1100 feet. Profiles are offset 20 columns. Labels above each profile show time, flight level [units of 100 feet] and outside air temperature [C]. The altitude scale on the left is altitude difference with respect to the aircraft, in "flight level units" (100 feet) and on the right is shown pressure altitude in kilometer units.
This figure shows three "poor man's" T(z) profiles while flying at a pressure altitude of 64,600 feet. It is clear that the ER-2 aircraft is within an inversion layer (IL) that is ~5000 feet thick (1.7 km). The lapse rate (which I define as the vertical gradient of temperature) is about +1.5 K/km at flight level, whereas above and below the IL the lapse rate has an opposite sign. The properties of the IL vary on a time scale of 14 seconds, the time required for each scan cycle. This is a considerable amount of information about the atmosphere in the vicinity of the aircraft, and it can be relied upon even though it was obtained using the "poor man's retrieval procedure."
In the early days I took into account the known limitations of this simple retrieval procedure. For example, I knew that the altitude of a T(z) inflection produced by an IL base or top was displaced closer to the aircraft than its true altitude (by ~20% ). I also knew that a temperature profile like the one in the previous figure was most likely produced by a 3-straight-line IL shape, which appears "rounded" due to altitude resolution limitations of the simple retrieval procedure. If the brain can take these things into account when interpreting "poor man's" T(z) plots, then surely there must be a way to perform adjustments mathematically. Or better yet, why not adopt a more sophisticated retrieval procedure that should produce T(z) that has less of the smoothing. That's what the next chapter deals with.
Go to Chapter #7 (next chapter)
This is Chapter 6
Go to Chapter #5 (previous chapter)
Return to Introduction
____________________________________________________________________