This web page is meant to present a photometric sequence for the
exoplanet HD 74156 star field (from observations taken 2004.12.10
UT).
This exoplanet system is located at RA = 08:42:25.1, Dec = +04:34:40.2
(equinox 2000.0). The star is very bright, with Mv = 7.6.
Links Internal to this Web Page
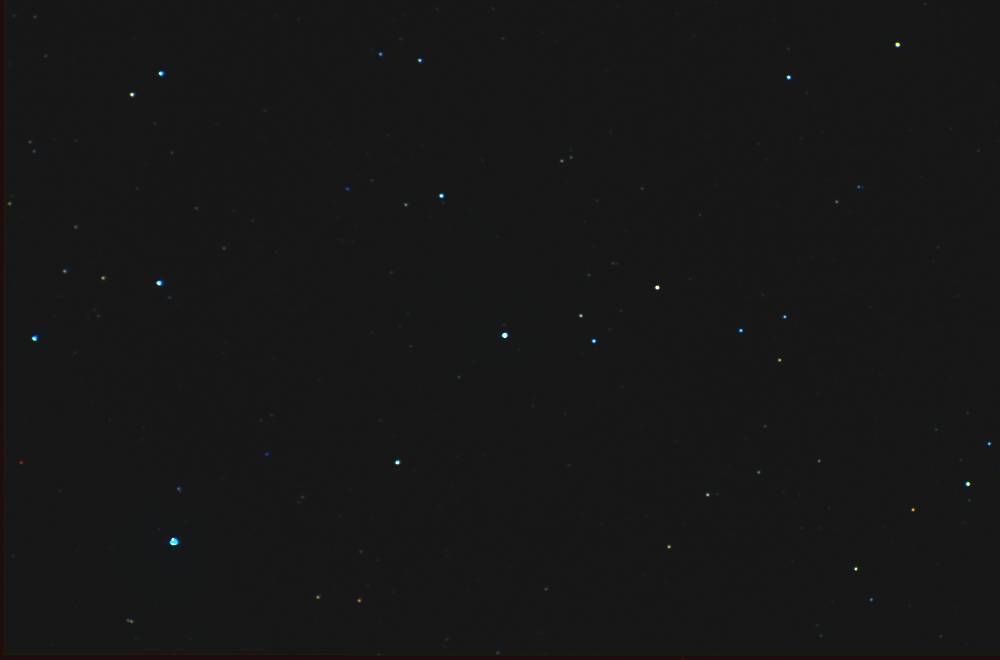
The following color image shows a large field of view (FOV) with the
exoplanet HD 74156, hereafter referred to by a name that I can
remember: E0842.
Figure 1. Color image of bright stars surrounding
E0842. FOV = 1.2 x 0.8 degrees.
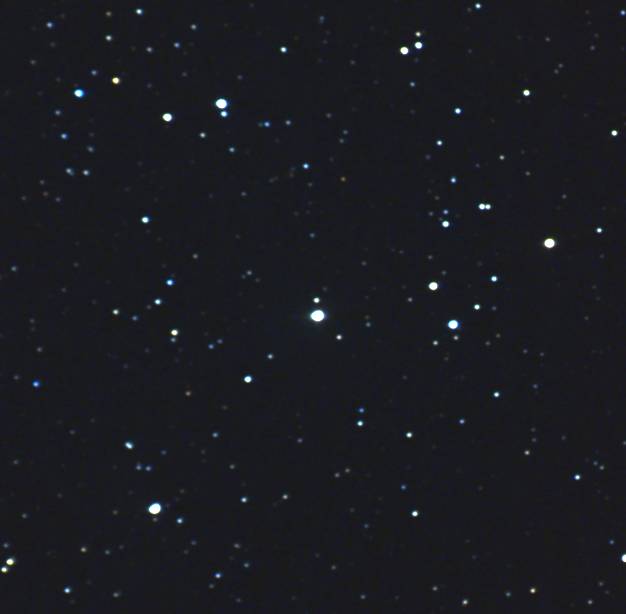
Figure 2. Crop
of previous image, showing colors of fainter stars (brighter stars are
saturated white). FOV = 29 'arc square. E0842 is the brightest star in
the center of the image.
The following figure is a large FOV image showing the star field for E0842.
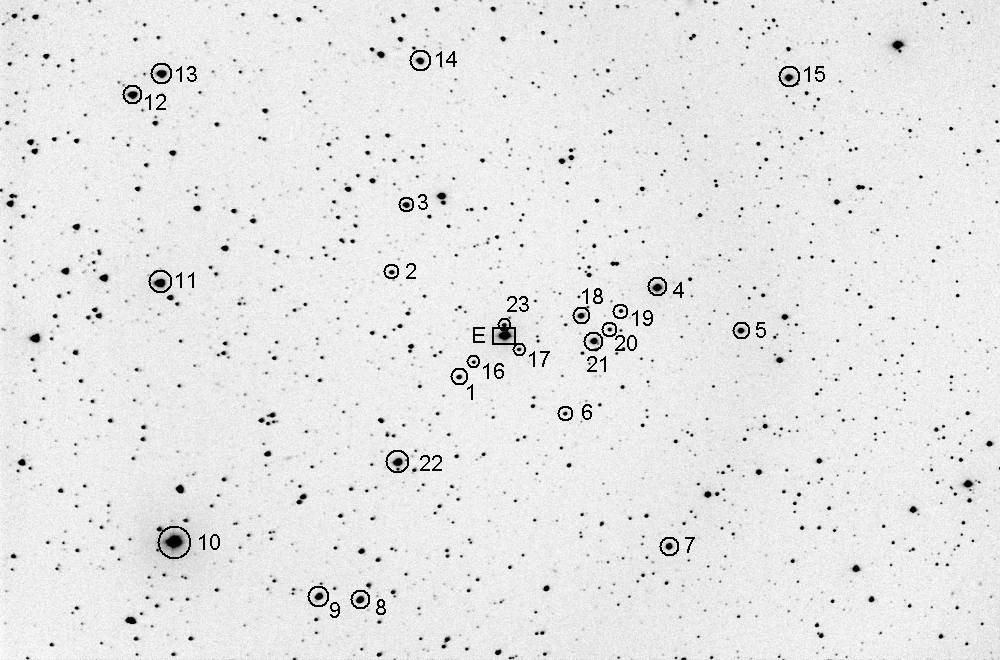
Figure 1. Star field centered on the exoplanet star
E0842 (square). FOV = 71.2 x 47.0 'arc, north up, east left. [Celestron
14-inch CGE-1400, prime focus, Starizona HyperStar, R-filter, 20 10-sec
exposures, SBIG
ST-8XE CCD; 2004.12.01, Hereford, AZ]
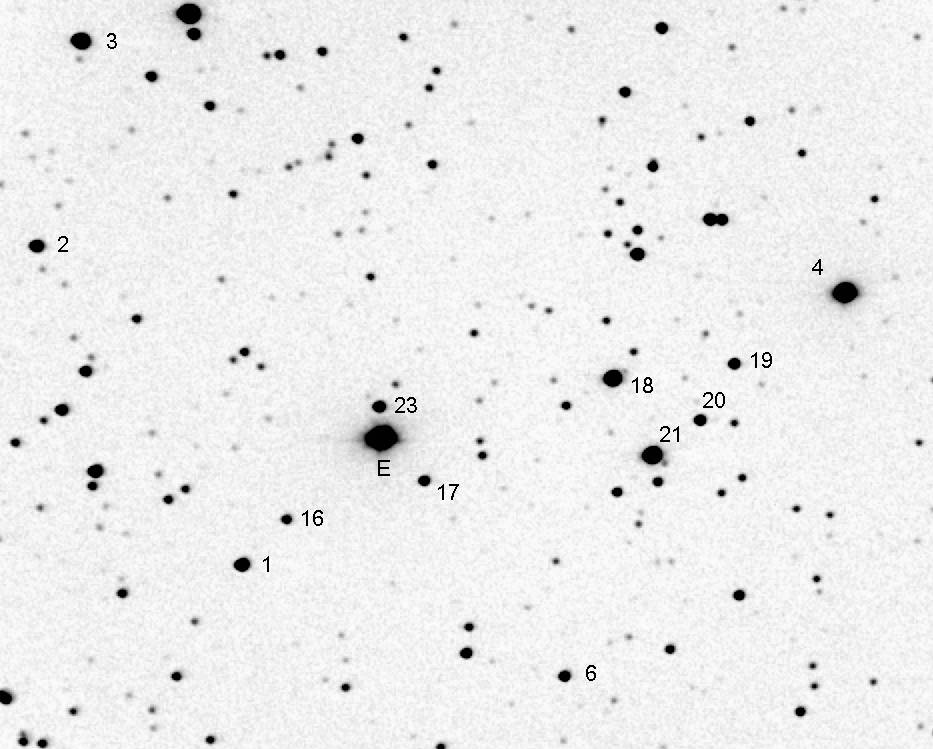
Figure 2. Crop and zoom of previous image. FOV = 21.8 x 17.5 'arc. (The limiting magnitude is 18.5, SNR = 3.)
The following table lists all-sky photometric results for the 23
stars analyzed.
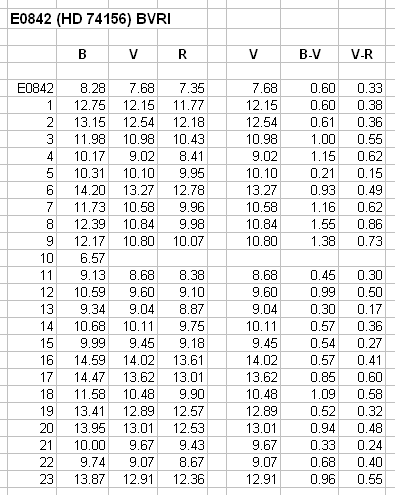
Figure 3. BVR
magnitudes (left section) and star colors (right section), based on
2004.12.10 all-sky photometry observations (version 4C15b).
There was no measured brightness change for the stars in the table
between 2004.12.01 and 2004.12.10, based on R-band images (at low air
mass). The largest change was Star #15, which differed by 0.08
magnitude between the two images. My estimate for SE uncertainty
(stochastic plus calibration) is 0.05 0.04 and 0.03 magnitude for B, V
and R (for all stars with V-mag <12.5).
Here's a chart of R-band magnitudes that I plan to use for my R_band
observations.
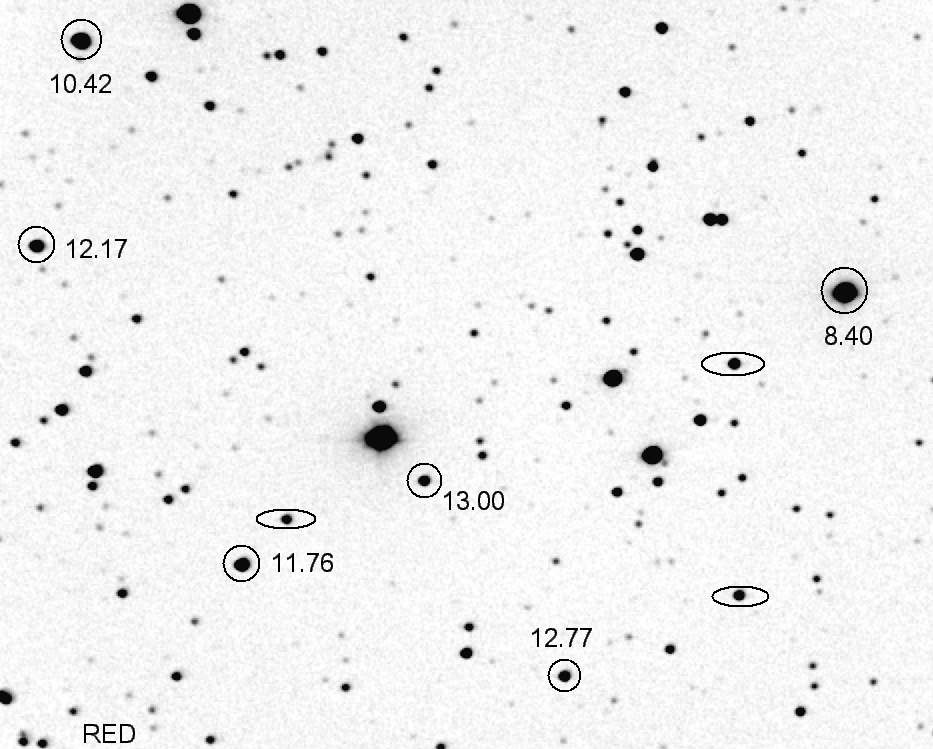
Figure 4. R-band magnitudes for stars suitable for use as reference (cicled) and possible check stars (ovals). FOV = 21.8 x 17.5 'arc. (The magntudes in this figure should be adjusted by +0.01 mag due to a last minute correction not yet aplied to the image.)
Nearby Star
Observing Consideration
Observers should note the presence of a star close to E0842 for its
potential for affecting measured E0842 brightness measurements. This
potential problem is illustrated in the following figure.
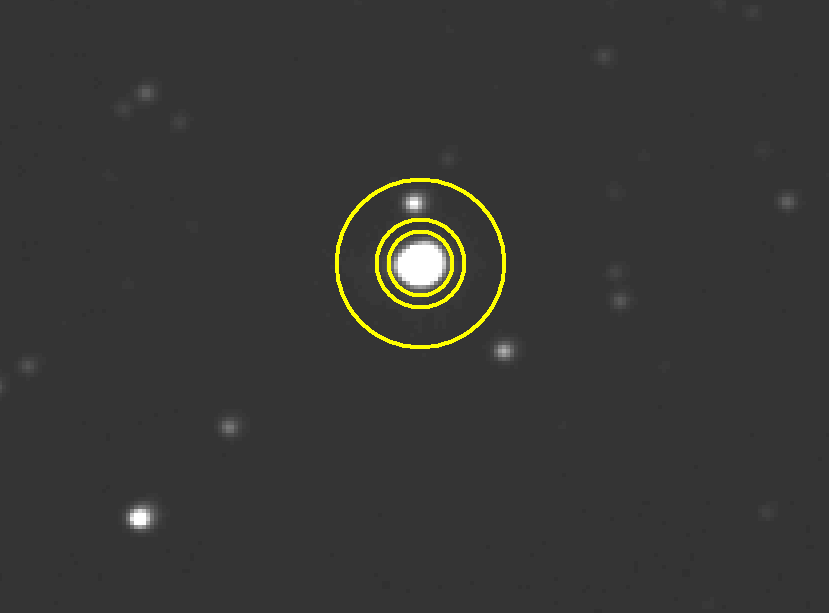
Figure 5. This is one way to deal with the 5
magnitude fainter star 44 "arc north of E0842.
Since the fainter star north of E0842 has a brightness of only 1%
that of E0842 if it is included in themiddle of the sky reference
annulus, as hown in the image above, it will decrease the "intensity"
of E0842 by a small and constant amount. For the aperture pattern
depicted above the interfering star decreases the E0842 intensity by
only 0.18 %, or 2 milli-magnitude. Provided the point-spread-function
FWHM does not change dramatically this decrease of intensity will be
constant. Since we're searching for a 7.5 milli-magnitude, this
constant offset of 2 milli-magnitude is a small nuisance compared with
alternative ways of removing its influence.
On December 26 I monitored E0842 (HD 74156) for the purpose of
evaluating use of the R-filter and 8-second exposure time. I quickly
concluded that E0842 was too bright, and would require use of an
exposure time of 2 or 3 seconds to avoid saturation, so I then
evaluated use of the I-filter. This was a better observing strategy as
the following plot of brightness versus time shows.
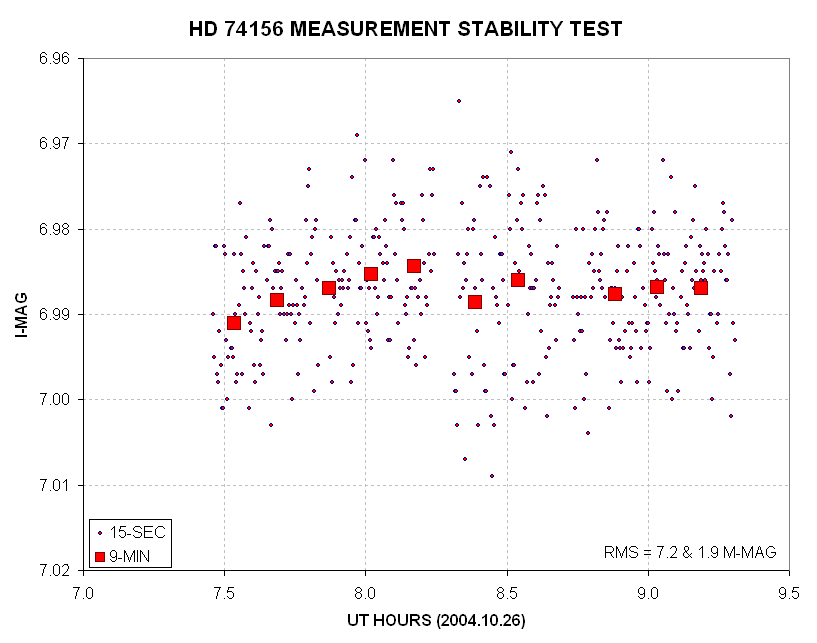
Figure 6. Brightness of E0842 versus time for a 2-hour
test interval using an I-band filter and 7-second exposures. These
measurements were made at 15-second intervals, and they exhibit a RMS
about the average of 7.2 milli-magnitude. 9-minute averages of this
data (red squares) exhibit an RMS about the average of 1.9
milli-magnitude.
Considering that the goal for this exoplanet is to measure a transit
fade of 7.5 mmag (milli-magnitude) depth lasting 7 hours it is
difficult for me to imagine that measurements such as these would be
adequate. Whereas the RMS of the 9-miute averages is 1.9 mmag there
seems to be a systematic wander of a few mmag. The observing
interval is insufficient to establish the temporal scale for these
systematic wanders, but I shall take the position that observations
like these are inadequate for the task of detecting the exected fade
for this exoplanet. I won't be observing it during the predicted Jan 1
transit, therefore.
The check stars exhibited slightly worse RMS scatter, as the
following graph shows.
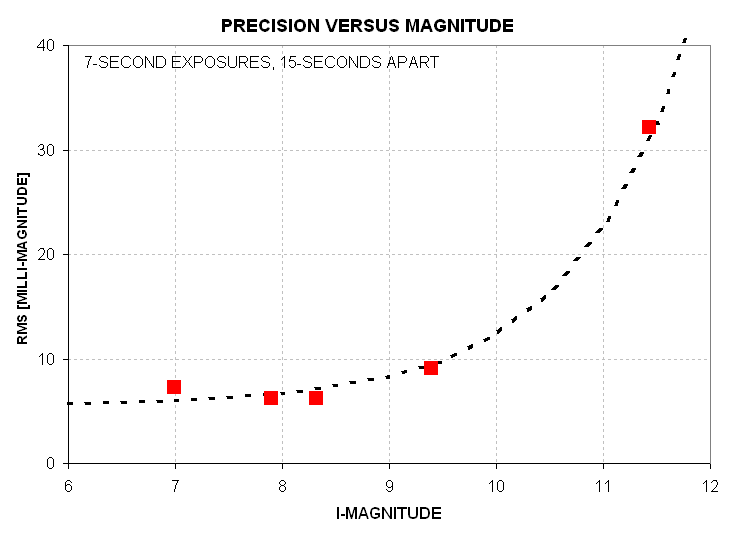
Figure 7. RMS variation about the average for the 2-hour
test observing interval versus I-magnitude. A model trace assumes a
constant component (due, presumably, to scintillation) and a component
that is related to SNR.
Details for this
photometric solution
Exoplanet
HD 37605 (E0540) photometric sequence
AAVSO
web page for December Exoplanet Campaigns (HD 37605 & HD 74156))
TransitSearch
web page
Tutorial
for Observing Exoplanets
TrES-1
Transit Observations
HD
209458 Transit Observations
Return to Bruce's
AstroPhotos
You may e-mail me at B L G A R Y @ u m i c h . e d u
____________________________________________________________________
This site opened: December 9, 2004. Last Update: March 30, 2006