GJ 2069A Photometry Observations
2012 January 14 to January 31; Archive
maintained by Bruce Gary (Hereford Arizona Observatory)
Basic Information
Aliases: CU Cnc, HIP 41824
Position: 08:31:37.6, +19:23:39
V ~ 11.81, B-V ~ +1.57, g'-r' = 1.39
Opposition Date: January 26
Ephemeris: 245208.5068 + E * 2.771468
Links:
   Observation Coverage
   Finder Image & Ref Star Mag's
   Observers
   Phase-Folded Light Curves
   Published Info
   References

   Light Curves (other page)


Observation Coverage

Bold filter entries in this table have been processed using latest procedures (2012 November). The date columns correspond to 24-hour intervals that begin at 17 UT and end on 17 UT; for example, "Jan 17/18" begins Jan 17, 17 UT and ends Jan 18, 17 UT.
Observer
|
Filters
|
Jan 13/14
|
Jan 16/17
|
Jan 17/18
|
Jan 18/19
|
Jan 19/20
|
Jan 22/23
|
Jan 23/24
|
Jan 25/26
|
Jan 26/27
|
Jan 30/31
|
| Gregorio |
V
|
|
|
21.2 - 05.0 V
|
21.2 - 27.7 V
|
20.7 - 01.1 V
|
20.5 - 28.6 V
|
|
|
|
|
Kaye
|
B
|
05.8 - 13.0 B
|
04.4 - 13.0
|
04.4 - 13.0 B
|
03.4 - 13.0
|
03.9 - 13.0
|
|
|
|
|
yes
|
Gary
|
g'r'i'z'
|
02.3 - 13.5 g'r'i'z'
|
02.8 - 13.2 g'r'i'z'
|
02.9 - 13.5 g'r'i'
|
03.0 - 13.6 g'r'i'
|
03.0 - 13.6 g'r'i'
|
|
|
04.2 - 13.4 g'r'i'
|
02.0 - 13.5 g'r'i'
|
01.7 - 12.2 g'r'i'
|
Finder Image & Magnitudes of Reference Stars
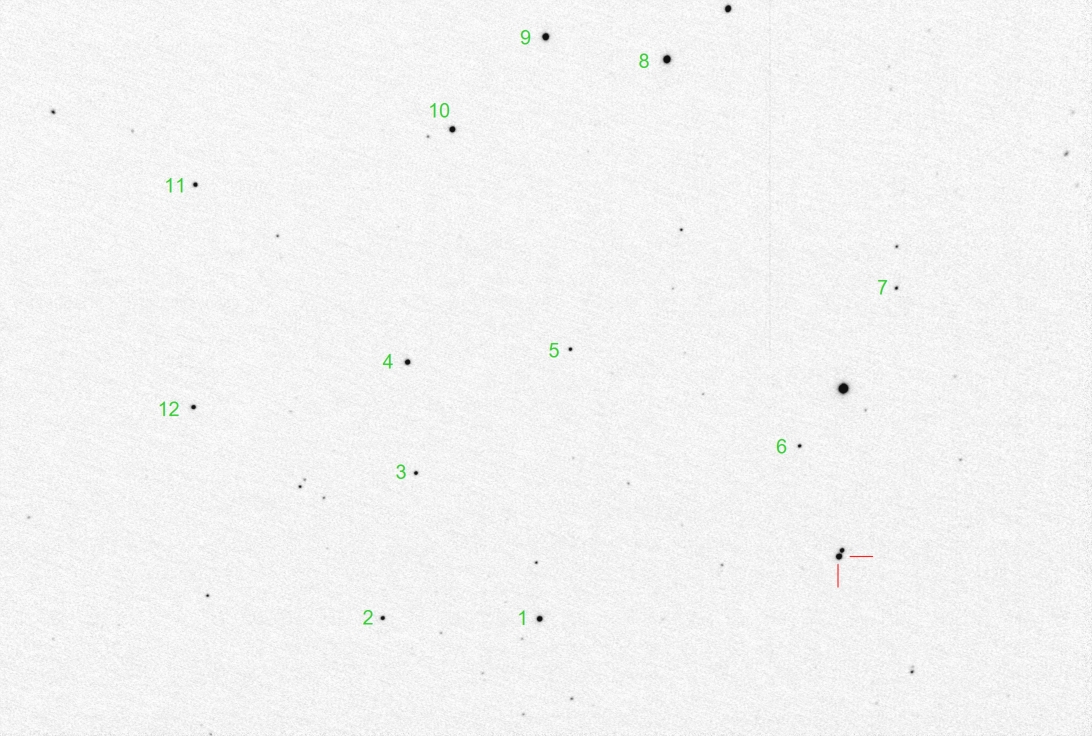
Figure 1. Finder image showing GJ2069A (red lines) and reference stars (green numbers). FOV = 27 x 18 'arc, north up, east left (14 degree CCW rotation). Each star has calibrated mag's for use in adjusting GJ2069A LC calibration.
Table I
|
B
|
V
|
g'
|
r'
|
i'
|
z'
|
Star Color, g'-r'
|
GJ2069A Simbad (ASCC-2.5 &
SDSS7)
|
12.83
|
12.05
|
14.856
|
12.793
|
13.328
|
10.381
|
+2.063
|
GJ2069A Weiss, 1991
|
|
11.89 ± 0.01
|
|
|
|
|
|
GJ2069A JK-based (BV) &
CMC14 (r')
|
11.45 ± 0.17
|
10.03 ± 0.12
|
|
11.334 ± 0.020
|
|
|
|
GJ2069A (APASS) - not reliable
due to Star B
|
13.376 ± 0.130
|
11.809 ± 0.037
|
12.573 ± 0.040
|
11.210 ± 0.037
|
9.599 ± 0.063
|
8.880
|
+1.36 ± 0.06
|
GJ2069A based on my meast's
& 12 ref stars
|
|
|
12.654 ± 0.020 |
11.264 ± 0.020
|
9.823 ± 0.015
|
8.99 ± 0.01
|
+1.390 ± 0.030
|
GJ2069A Adopt (Phase = 0.34)
|
|
|
12.65 ± 0.03 |
11.26 ± 0.03 |
9.82 ± 0.02 |
8.99 ± 0.02 |
+1.39 ± 0.03 |
|
|
|
|
|
|
|
|
| Ref Star #01 (APASS) |
11.678 ± 0.049
|
10.696 ± 0.026
|
11.145 ± 0.014
|
10.451 ± 0.051
|
10.143 ± 0.042
|
9.959 ± 0.070
|
+0.694
|
| Ref Star #02 (APASS) |
12.939 ± 0.008 |
12.050 ± 0.008 |
12.451 ± 0.008 |
11.796 ± 0.011 |
11.550 ± 0.050 |
11.427 ±
0.067
|
+0.655
|
| Ref Star #03 (APASS) |
12.511 ± 0.006
|
12.027 ± 0.011
|
12.218 ± 0.008
|
11.945 ± 0.006
|
11.841 ± 0.074
|
11.807 ± 0.098
|
+0.263
|
| Ref Star #04 (APASS) |
12.144 ± 0.011 |
10.987 ± 0.010 |
11.516 ± 0.0?? |
10.645 ± 0.007 |
10.313 ± 0.054 |
10.125 ±
0.071
|
+0.871
|
| Ref Star #05 (APASS) |
13.048 ± 0.053 |
12.415 ± 0.035
|
12.703 ± 0.011
|
12.297 ± 0.015
|
12.162 ± 0.049
|
12.116 ±
0.066
|
+0.406
|
Ref Star #06 (APASS)
|
13.308 ± 0.041
|
12.566 ± 0.028
|
12.901 ± 0.008
|
12.390 ± 0.014
|
12.210 ± 0.041
|
12.136 ±
0.055
|
+0.511
|
| Ref Star #07 (APASS) |
13.476 ± 0.040 |
12.805 ± 0.026
|
13.104 ± 0.012
|
12.662 ± 0.022
|
12.506 ± 0.047
|
12.450 ±
0.065
|
+0.442
|
| Ref Star #08 (APASS) |
10.925 ± 0.016
|
9.788 ± 0.008
|
10.206
|
9.223
|
8.825 ± 0.078
|
8.622 ± 0.0??
|
+0.983
|
| Ref Star #09 (APASS) |
10.953 ± 0.010
|
10.005 ± 0.047
|
10.385
|
9.634
|
9.271 ± 0.028
|
9.120 ± 0.0??
|
+0.751
|
| Ref Star #10 (APASS) |
10.798 ± 0.0??
|
10.237 ± 0.0??
|
10.472
|
10.089
|
9.952 ± 0.072
|
9.900 ± 0.0??
|
+0.383
|
Ref Star #11 (APASS)
|
13.070 ± 0.017
|
12.046 ± 0.014
|
12.516 ± 0.0??
|
11.728 ± 0.010
|
11.419 ± 0.023
|
11.255 ± 0.031
|
+0.788
|
Ref Star #12 (APASS)
|
11.918 ± 0.0??
|
11.468 ± 0.006
|
11.628 ± 0.012
|
11.407 ± 0.014
|
11.327 ± 0.039
|
11.303 ± 0.053
|
+0.221
|
z' mag's are based on conversion from g'r'i' or BVi'
"GJ2069A based on my meast's & 15 ref stars" is based on flux of GJ2069A in my images and using a solution for telescope photometry constants derived from the 15 reference stars.
Green colored g' & r' mag's for Ref Stars 8, 9 & 10 are from measurements of my g' and r' images using the 9 APASS magnitudes.
Since GJ2069A is so red it is difficult to obtain a quality B-V star color for this object. Consequently, I have adopted the use of g'-r' for all star colors for this target's analysis.
The AAVSO APASS archive has measurements of the GJ 2069 region (DR6, with only 3 images measured) so it is possible to obtain moderately accurate magnitudes for B, V, g', r' and i' for several nearby stars. I have used 9 to 12 stars with a typical range of colors to establish "telescope photometry constants," which I then use to establish magnitudes for GJ 2069A. This required extrapolating a plot of mag's vs. star color for the 9 reference stars (with g' and r' mag's) to an assumed star color for GJ2069A of 1.39; this felt risky but necessary. I searched the APASS database for redder stars and found 3, but they were so faint that their noise didn't constrain the fit to justify the labor of using them, so I abandoned their use. I even searched for bluer stars to improve the slope for extrapolating, but there weren't any that were bright enough for use. GJ2069A would be a difficult target for an all-sky observation due to the proximity of GJ2069B, because all-sky works best when large photometry apertures are used.
Measurement of g' and r' Magnitudes of Reference Stars 8, 9 and 10
The green entries in the above table are based on my measurements of g' and r' images using the 9 APASS stars as reference. As a "reality check" of this result I compared my measured g'-r' colors for these three stars with a color/color plot derived from a well-calibrated star field, M67. The M67 g'-r' vs. B-V relationship is shown in the next figure.
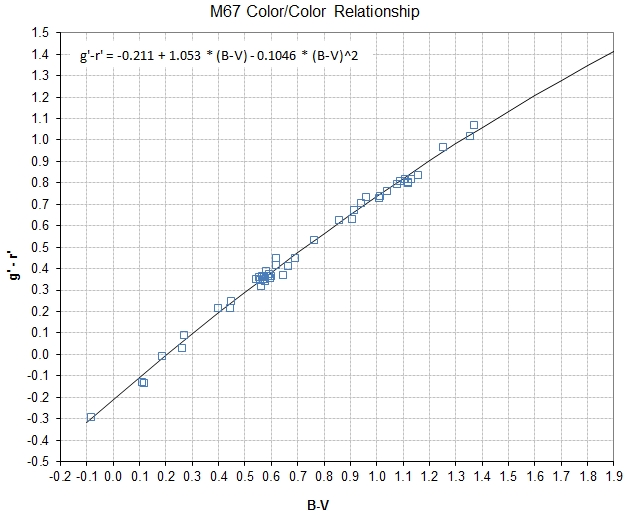
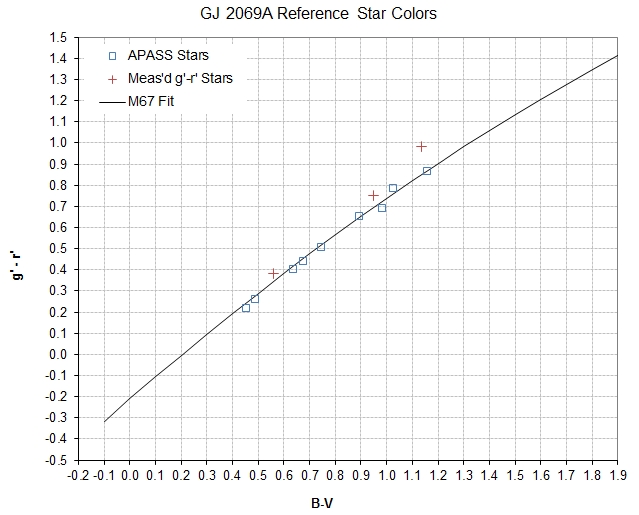
Figure 2a and b. Color/color relationship for 47 stars in the M67 open cluster (left) and the GJ 2069A field of APASS stars (right). Open green squares in right panel are the 9 APASS stars; red crosses are 3 reference stars without APASS g' and r' magnitudes that have been assigned g' and r' magnitudes based on measurements of my g' and r' images and using the 9 APASS calibrated stars for reference.
In Fig. 2b the reddest of the three stars needing g' and r' magnitudes appears to have too great a g'-r' magnitude difference. I don't know if the 0.1 magnitude discrepancy is real; until I can figure out another way to measure the g' and r' magnitudes (short of a labor-intensive all-sky observing session) I will accept this star as provisionally calibrated.
Star Color Sensitivities
My spreadsheet for creating light curves includes a model for converting "instrument magnitude" to "true magnitude" using a simple atmospheric extinction model. Extinction varies with wavelength, and my filters have a response function that extends over ~ 150 nm. The response function of my telescope system for each filter will be slightly different from that for the standard telescope system used to create the set of SDSS standard star magnitudes. Therefore, it is reasonable to expect that stars with different colors will exhibit a slightly different rate of atmospheric extinction. My spreadsheet model treats all stars as if they were the same color. Therefore, my resultant magnitudes should vary with star color in a systematic way. Usually the set of reference stars will have colors that extend from bluer than target to redder. When this occurs I adjust a magnitude offset parameter so that reference stars with the same color as the target star display zero error in a plot of magnitude discrepancy versus star color. Since GJ 2069A is much redder than any of the nearby reference stars it is necessary to extrapolate the pattern of star magnitude difference (w.r.t. hypothetical offset adjustments) versus star color to a target star color corresponding to GJ 2069A. This is illustrated by the following set of star color sensitivity plots.
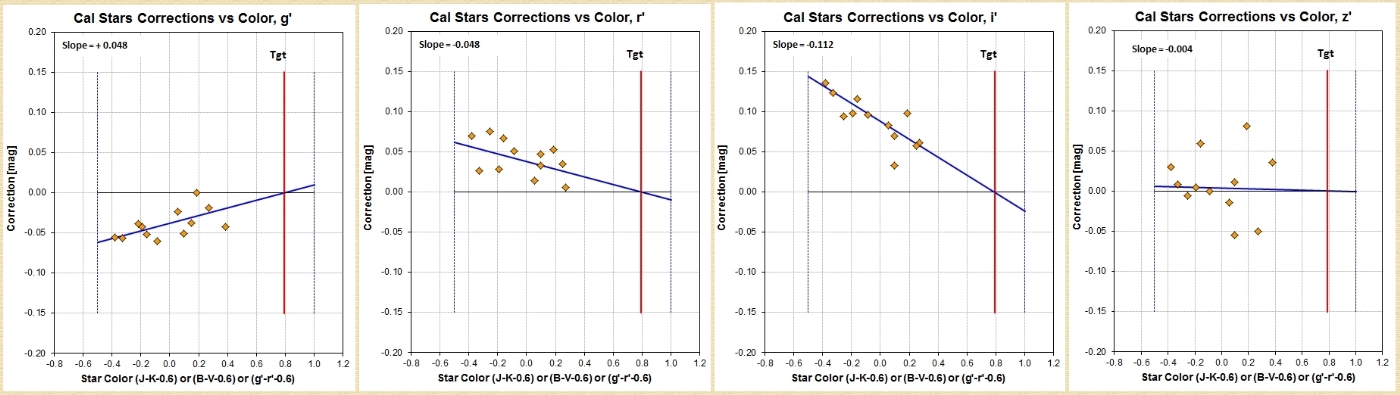
Figure 4. Star color sensitivity plots for the 12 reference stars versus their star color (defined as g'-r'-0.60). The fitted lines intercept the zero difference at GJ 2069A's star color.
Slopes in the above plots are similar to those found in May, 2012 when I produced star color sensitivities for the open cluster M67. For those observations I adopted star color defined as B-V-0.50. Because of this, and because extinction was different for the two observing dates, there should be differences in slope values. The fact that the pattern of slope values is similar, especially their signs, suggests that the slopes for the present observations of GJ 2069A are acceptably correct. This means that that if calibrated stars with GJ 2069A's color were present their magnitude differences would be close to the zero line in the above plots, thus assuring a correct calibration for the GJ 2069A magnitudes.
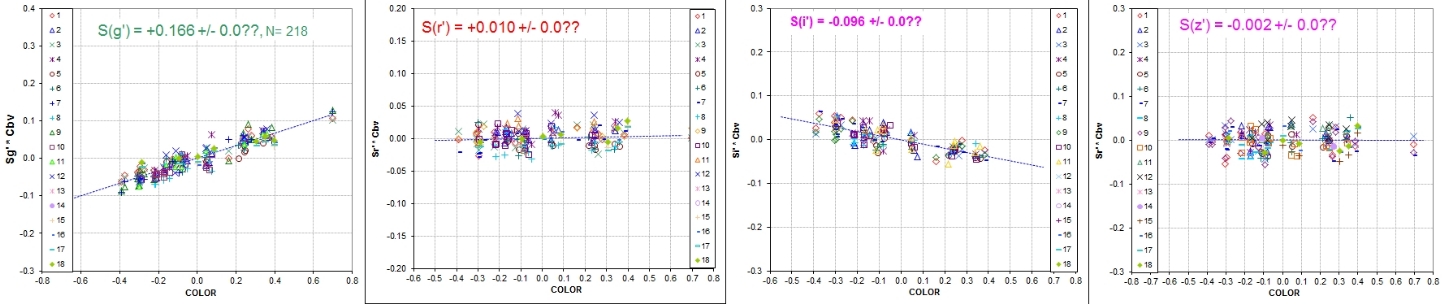
Figure 5. Star color sensitivity based on many stars in several Landolt star fields during April and May, 2012, with the same telescope system that is currently in use for GJ 2069A observations.
All GJ 2069A processing will use the same "slopes", and only magnitude shifts of the data will be made. Whatever magnitude errors exist for the 12 reference stars near GJ 2069A, provided I use the same reference stars for each observing session, and provided I adjust a magnitude shift parameter to achieve agreement with the fixed slope lines in Fig. 4, the resultant magnitudes for GJ 2069A for all observing sessions should share the same magnitude errors for each band. This will therefore permit phase-folding for the purpose of establishing a rotation light curve for GJ 2069A - which is the main objective of this observing project.
Photometry Aperture Precaution
Because GJ 2079A and B are only 12 "arc apart, it is important to employ photometry aperture circles that include only "A" (see below) or both "A" and "B" - depending on atmospheric seeing.
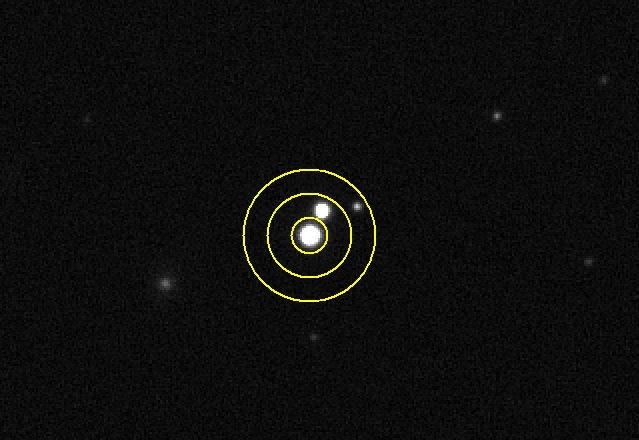
Figure 6. GJ 2069A (inside photometry signal circle) and GJ 2069B (within photometry gap annulus). Separation is 12 "arc.
The star in the sky background annulus is ~ 4.5 magnitudes fainter than GJ 2069A (r'-band). Considering its solid angle in relation to the solid angle of the sky background annulus it has the potential to alter the measured magnitude of GJ 2069A by 2 mmag. However, the MaxIm DL Photometry tool identifies stars in the sky background annulus and removes their contribution to the sky background average value calculation (using a "median-mean" algorithm), so the 2 mmag maximum effect of this star is reduced even further. Any residual effect will be small compared with even the Poisson noise for GJ 2069A (~ 5 mmag), or even scintillation (~3 mmag). It is therefore not necessary to choose a sky background annulus that avoids inclusion of this star.
Observers
Bruce Gary Hereford Arizona Observatory
Tom Kaye Junk Bond Observatory
Joao Gregorio Joao's Atalaia Portugal Facility
Phase-Folded Light Curves
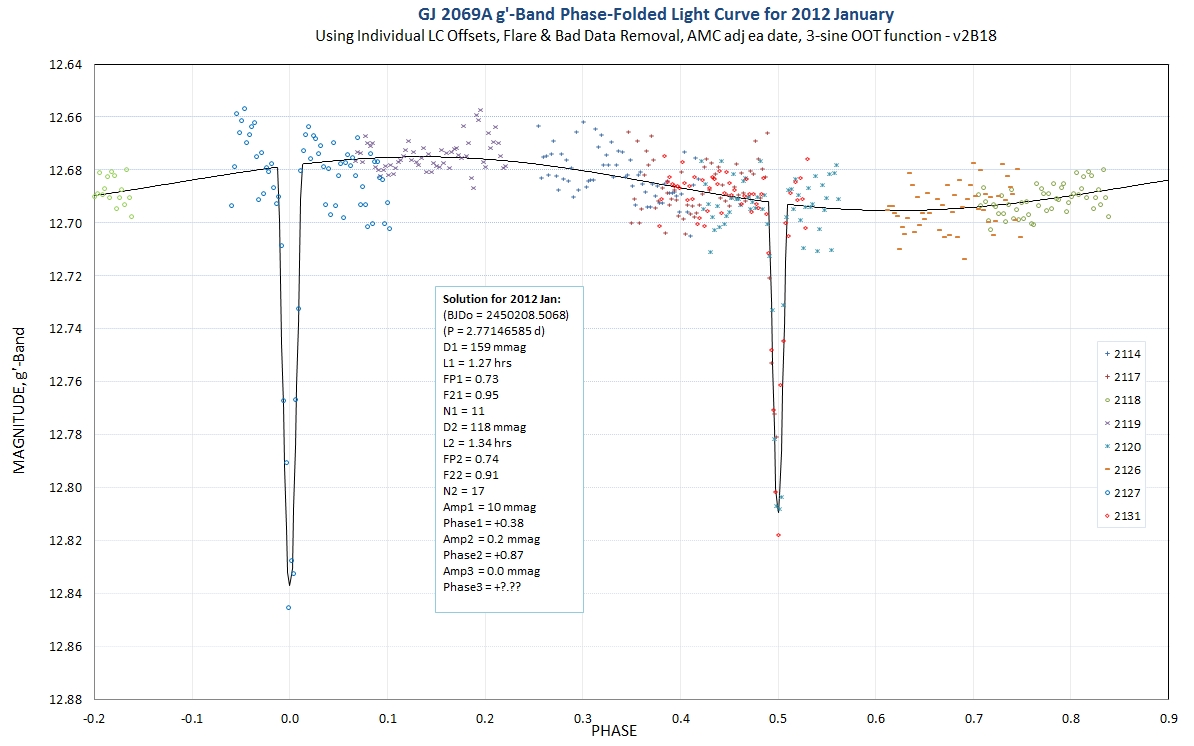
Figure 7. Phase-folded light curve for g'-band.
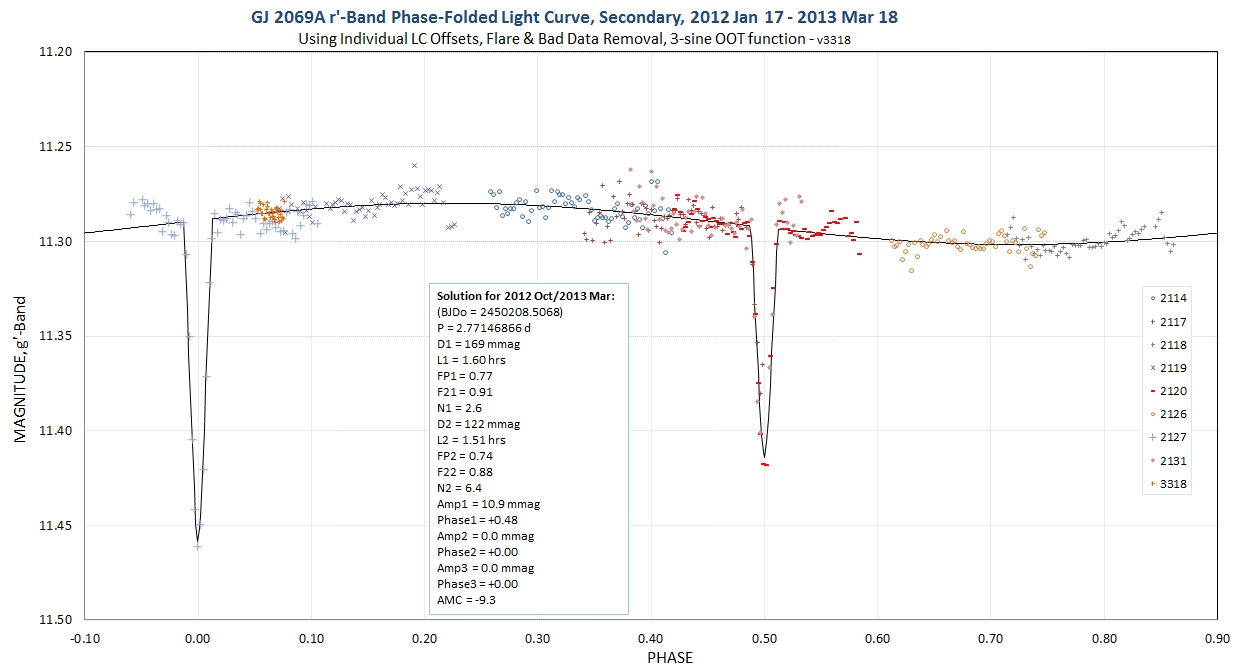
Figure 8. Phase-folded light curve for r'-band.
Notice that the minimum OOT for g' occurs at phase ~ 0.62, and at 0.75 for r'-band, whereas the Ribas (2003) phase-folded LC has a minimum OOT at phase ~ 0.00. Starspots change, of course.
Published Information
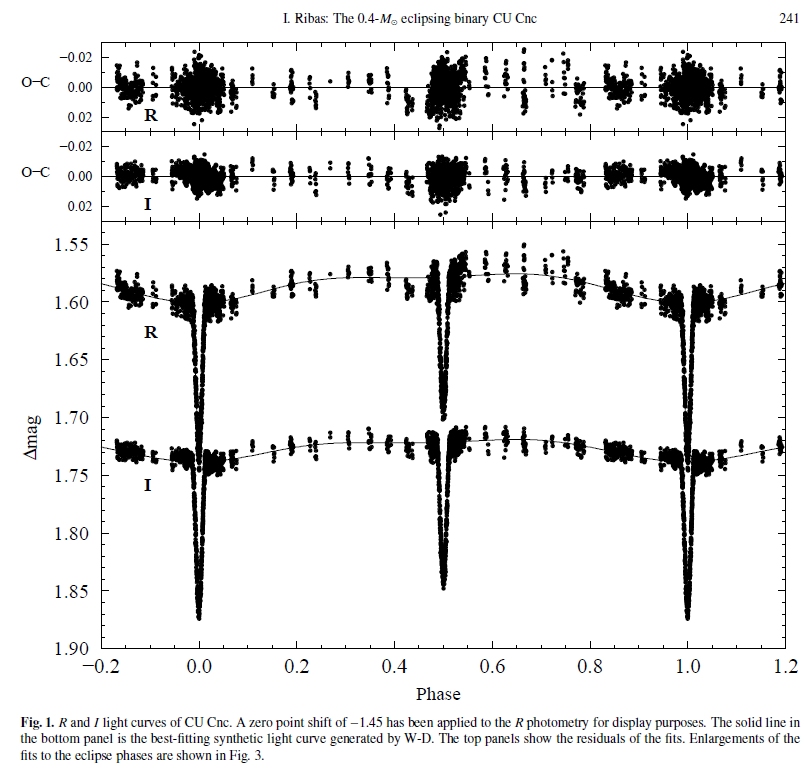
Figure 11. Ribas, 2003 light curves.
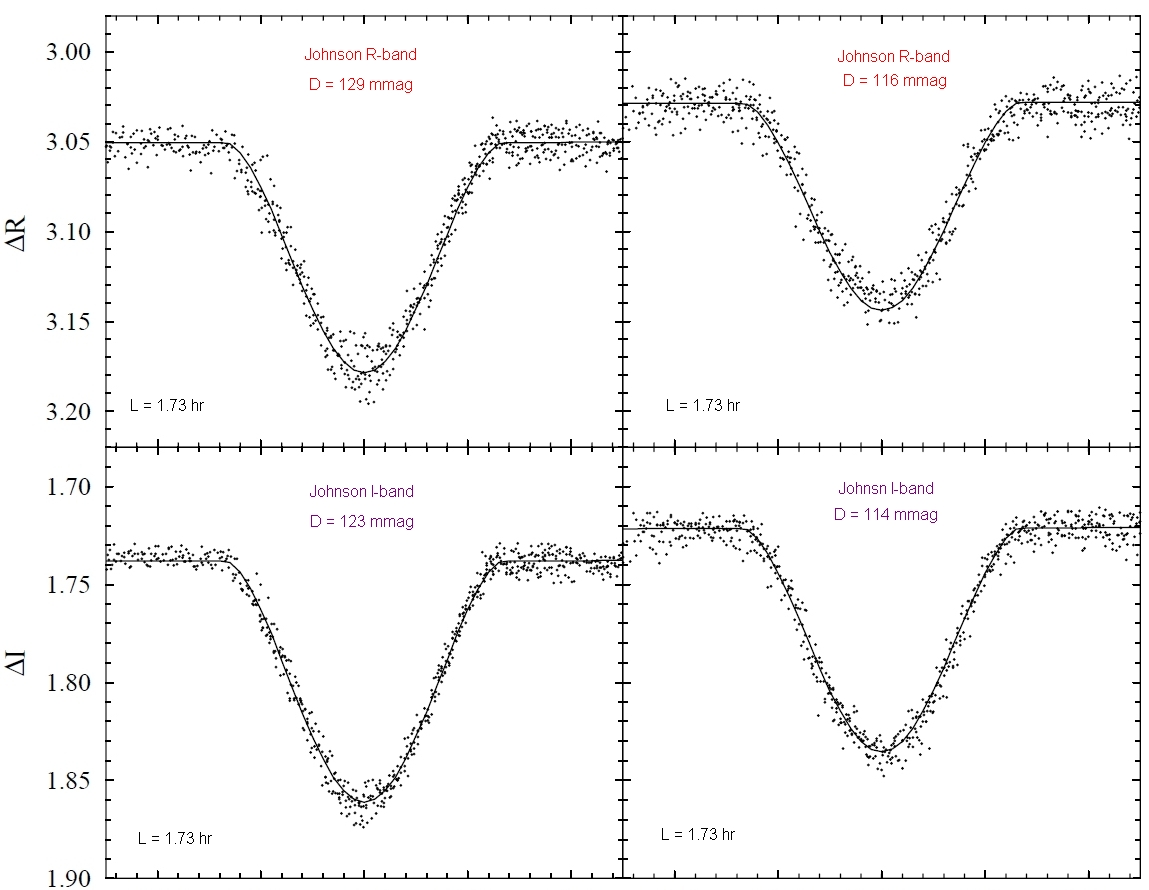
Figure 12. Ribas, 2003 light curve details of transits.
References
Ribas, I., 2003, A&A, 398, 239-251.
Weiss, E. W., 1991, AJ, 101, 1881.
Return to YY Gem home page.
WebMaster: B. Gary.
Nothing on this web page is
copyrighted. This site opened: 2012.01.15. Last Update: 2013.03.18