.png)
MTP/DC8 PERFORMANCE ASSESSMENTS
USING AASE II, TOTE/VOTE AND SONEX DATA
Abstract
The MTP/DC8 instrument exhibits an RMS accuracy, as measured by comparison with radiosondes, that is <1.2 K from 8 to 13 km for flight at typical altitudes (10 to 12.4 km). For the altitudes 6 and 17 km the RMS accuracy is 2.0 K, and reaches 4.0 K at 4 and 20 km.
Introduction
Radiosondes (RAOBs) are a critical part of the process of calibrating the Microwave Temperature Profiler instrument mounted aboard the NASA DC-8 (MTP/DC8). RAOBs are also used to assess the RMS accuracy of retrieved T(z) profiles. Another web page (MTP/DC8 First Calibration & Performance Assessment) describes in some detail most of these analyses, using data from the AASE II mission (Airborne Arctic Stratospheric Experiment II, August 1991 - March 1992). A more careful calibration was done with MTP/DC8 data from the TOTE/VOTE mission (Tropical Ozone Transport Experiment/Vortex ozone Transport Experiment, December 1995 - February 1996). Finally, a less exhaustive analysis was performed with data from the SONEX mission (Subsonic Aircraft: Contrail and Cloud Effects Special Study, April - May, 1996).
This web page combines the three sets of "RMS accuracy versus altitude" results and presents a weighted average "RMS accuracy versus altitude" profile. This final performance profile characterizes MTP/DC8 accuracy for T(z) retrievals that have undergone a specific type of calibration using RAOB data. The calibration procedure is descibed in various reports, and cannot yet be found at a single web page location (a future project). Specifically, the procedure for deriving a "window correction table" has not been described in any web page. The above cited web page describes how to determine a "bias profile" and remove it, and it also describes how to derive the RMS accuracy performance profile. Similar analyses were done with the TOTE/VOTE and SONEX data, but most of these descriptions and graphs have been lost. In this web page I present the little that survives, and combine the three RMS performance profiles to arrive at a "weighted average RMS performance profile."
Removal of Bias T(z) Profile
The SONEX data are used to illustrate the concept of deriving a "bias profile" from a set of T(z) retrievals corresponding to times of passage near RAOB sites. For each case (of an MTP/DC8 versus RAOB comparison) a plot of dT(z) is recorded, where dT(z) is defined as "MTP/DC8 T(z) - RAOB T(z)." For SONEX there were 16 such cases from various flights, as shown in the next figure.
Figure 1. Traces of dT(z) for 16 individual comparisons of MTP/DC8 retrieved T(z) with RAOB T(z). The blue trace is the average dT(z), or "bias profile."
The "bias profile" determined from the Fig. 1, the average dT(z), must be subtracted from all SONEX mission MTP/DC8 retrieved T(z) profiles. I can think of two reasons the bias profile can be non-zero: 1) the use of an inaccurate "window correction table," and 2) the use of RAOBs for calculating retrieval coefficients (RCs) that did not correspond well to the temperature fields that were encountered during the mission for which the RCs were used.
The most thorough analysis would involve a careful determination of window corrections, as well as a recalculation of RCs using RAOBs that were representative of the temperature fields encountered during the SONEX mission. Since these tasks are time-consuming it is always tempting to simply subtract the "bias profile" from all SONEX data, which I chose to do. This shortcut must result in slightly degraded performance, but sometimes the uses to which the MTP/DC8 data are put do not justify the added expense of performing a thorough calibration and re-analysis. A more careful analysis was performed with the TOTE/VOTE data.
The RMS performance of the MTP/DC8 data, after the bias profile is subtracted from all data, is estimated by calculating the RMS difference of the individual T(z) profiles from the "bias profile." This is a stratight-forward task, the result of which is contained in the next figure.
Final RMS Performance
An analysis similar to that described for SONEX was performed for TOTE/VOTE, although with greater attention to details, and is shown in the next figure.
.png)
Figure 2. Weighted average RMS performance of MTP/DC8 (red trace) based on 30 comparisons with RAOBs during TOTE/VOTE (blue trace) and 13 comparisons with RAOBs during SONEX (green trace).
Both missions exhibit a similarly shaped trace for RMS performance versus altitude. Perhaps the TOTE/VOTE data are better behaved because a greater effort was spent deriving window corrections for that data set. Another possibility is that the just before SONEX the MTP was moved from a window on the left side of the DC-8 to a window on the right side. This meant that window effects pertaining to low scan angle views during TOTE/VOTE affected the high scan angle views during SONEX.
The 1992 AASE II mission RMS performance estimate, described in another web page (MTP/DC8 First Calibration & Performance Assessment) included an RMS performance trace corresponding approximately to the same analysis as presented here for the TOTE/VOTE and SONEX missions (Fig. 8), and is therefore available for combining to form an "all missions" weighted average RMS perofrmance trace, and this is presented in the next figure.
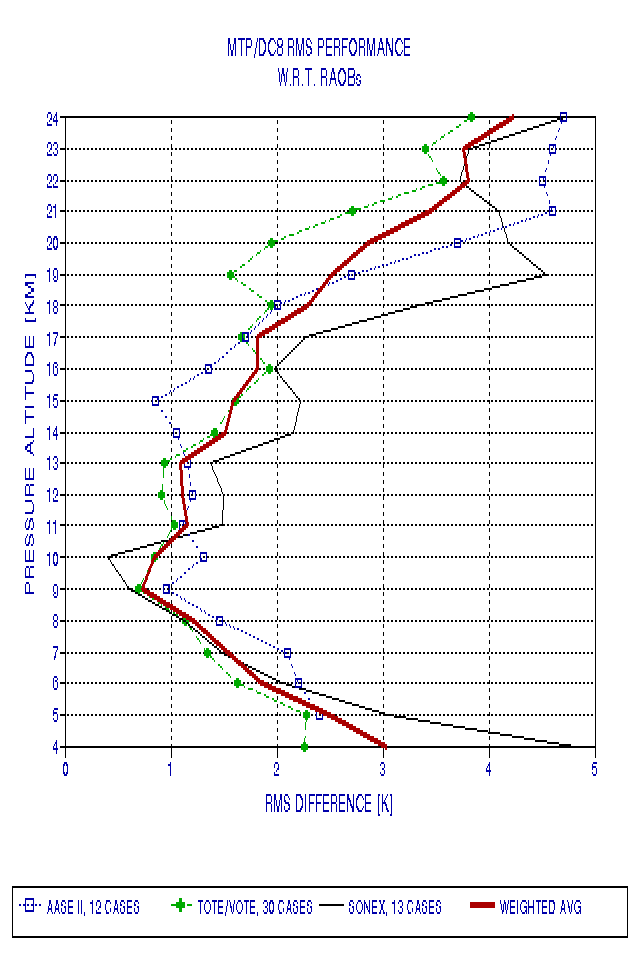
Figure 3. All RMS performance estiamtes, to date. Red trace is weighted average RMS performance for 3 missions, comprising 55 MTP/DC8 versus RAOB comparisons.
This figure shows that all 3 missions (AASE II, TOTE/VOTE and SONEX) exhibit a similarly shaped trace for MTP/DC8 RMS performance. The red trace in Fig. 3 is my best estimate of MTP/DC8 performance, to date, and it is the result of comparing MTP/DC8 retrieved T(z) with RAOB T(z) for 55 cases.
It should be mentioned that the other web page, describing the AASE II calibration and initial RMS performance (MTP/DC8 First Calibration & Performance Assessment), went further with its analysis and attempted to correct for RAOB uncertainties. If a similar correction were done for the Fig. 3 there would be a slight inprovement in the 9 to 13 km region, since the correction can be estimated by orthogonally subtracting a value such as 0.5 K from the red trace.
I anticipate that improvements in RMS performance can be achieved by adopting more sophisticated retrieval algorithms. For example, M. J. Mahoney is working on a procedure in which "observables" for a specific observing time are compared with sets of "archive average observables" for which retrieval coefficients have been calculated, and then using the RCs associated with the best matching observables for the retrieval of T(z). This assures that the RCs used to derive T(z) are for temperature fields "like" the one being observed, which should translate to greatly improved performance at altitudes several kilometers from the flight altitude. After this algorithm is perfected and implemented another RMS performance evaluation should be conducted.
Summary
The MTP/DC8 currently exhhibits an RMS accuracy of <1.2 K from 8 to 13 km for flight at typical altitudes (10 to 12.4 km). RMS accuracy is 2.0 K at 6 to 17 km, and it is 3.0 K at 4 and 20 km. These performance figures can be achieved after conducting a post-mission calibration involving a "window correction" analysis and a "bias profile" analysis, both of which are based on RAOB comparisons. The use of RAOBs remains a critical component of achieving good MTP/DC8 performance. Improvements over these performance values are expected after new retrieval procedures are implemented.
This site opened: March 1, 2000. Last Update: February 27, 2002