THE DC-8 MICROWAVE TEMPERATURE PROFILER
CALIBRATION AND FIRST ASSESSMENT OF PERFORMANCE
Bruce L. Gary
Jet Propulsion Laboratory
1993 April 2
Amended slightly 2000 February 28
Abstract
The DC-8 Microwave Temperature Profiler is a microwave radiometer that measures altitude profiles of air temperature above and below the NASA DC-8 aircraft. Comparisons with radiosondes show that the retrieved temperature profiles 1) exhibit an accuracy of better than 1.0 K for the altitude region 9 to 16 km, 2) are more accurate than profiles that can be obtained from the National Meteorological Center archive of "analyzed" RAOBs for the altitude region 7.5 to 17 km , and 3) exhibit achieved accuracies in agreement with pre-experiment predictions for the altitude region 5 to 18 km. These performance results are a first-time demonstration that a 3-frequency microwave temperature profiler, employing statistical retrieval techniques, can produce temperature profiles over an altitude region as thick as 12 km. From these data it is possible to monitor tropopause altitude, construct curtain cross-sections of isentrope altitudes, and identify mountain waves.
Introduction
The Microwave Temperature Profiler instrument aboard the DC-8, hereafter referred to as the MTP/DC8, is a microwave radiometer that measures brightness temperature versus elevation angle at 3 carefully chosen frequencies, and retrieves profiles of air temperature versus altitude using a statistical retrieval technique. Previous microwave temperature profilers aboard other aircraft have employed 1 or 2 frequencies, and produced temperature profiles by associating brightness temperatures with air temperature at "applicable altitudes."
Since 1988 the MTP/ER2, the MTP instrumnet mounted on the ER-2 aircraft, has produced profiles of air temperature that extend over a 5 km altitude region, centered approximately on flight altitude. On theoretical grounds the MTP/DC8 should yield temperature profiles that extend over an altitude region that is 2 or 3 times greater than for the MTP/ER2. This report evaluates, for the first time, the new techniques incorporated in the MTP/DC8 for enhancing microwave profiling performance. Separate papers will describe technical aspects of the MTP/DC8 instrument and scientifically relevant results.
The MTP/DC8 was constructed for the Airborne Arctic Stratospheric Expedition II, AASE II, for the study of stratospheric ozone depletion. The MTP/DC8 flew 19 times, between January 8 and March 20, 1992. The performance results reported here are based on comparisons of MTP/DC8 temperature profiles and radiosondes, RAOBs. The analysis to be described is based on the 17 occasions that the DC-8 flew close to RAOB sites during the flights of 1992 February 12, 14 and 17 (hereafter referred to as 920212, 920214, and 920217).
The balance of this paper consists of two sections. Section I describes the MTP/DC8's post-flight calibration. It also presents an evaluation of retrieved temperature profile performance, or accuracy versus altitude. Section II presents sample data products, including tropopause altitude monitoring and isentrope altitude cross-sections, or IACs. Uses for the IACs are demonstrated using two examples: locating the vortex edge by noting inflections of isentrope structures, and studies of isentrope wrinkles, such as those produced by mountain waves.
Brief Instrument Description
MTP/DC8 operates at 3 local oscillator frequencies: 55.51, 56.66 and 58.79 GHz. At these frequencies oxygen molecules are the only significant component of atmospheric absorption (at cruise flight altitudes). Sidebands on either side of the local oscillator extend from 0.25 to 0.40 GHz. A horn/reflector assembly directs the antenna reception pattern, having a 7.5 degree half-power beamwidth, through a sequence of 10 elevation angles: -80, -42, -25, -12, 0, 12, 25, 42, 55, and 80 degrees. An ambient calibration target is viewed after each sky viewing sequence, and a calibration noise diode is turned on at the ambient target position for the purpose of monitoring system gain.
The horn antenna and reflector scanning system, as well as the calibration target, are located on the outside surface of a "window" plate. A protective fairing extends 8 inches from the airframe, and contains a microwave "transparent" window mounted on the front surface to permit an unobstructed view from nadir to zenith. The forward view is offset 15 degrees in azimuth away from flight direction to reduce the reception of microwave emission from the airframe.
Most of the electronics are mounted on the inside surface of the window plate. A rack-mounted chassis contains power supplies, miscellaneous electronics, and a system controller computer that commands the viewing sequence, frequency multiplexing, and noise diode control. Raw data is sent to a real-time analysis computer, which displays retrieved profiles of air temperature on a monitor and plots isentrope altitudes on a printer. The entire sequence of 10 sky measurements at 3 frequencies, plus calibration target and noise diode measurement, and the data analysis and display, are completed every 14 seconds.
"Final Calibration" Overview
The MTP/DC8 microwave radiometer underwent laboratory calibration immediately before its November, 1991 installation in the DC-8 aircraft. Liquid nitrogen and ambient loads were used to determine gain for each observing frequency. Since these calibrations were not performed in a cold chamber they did not simulate actual flight conditions in which there are temperature gradients within parts of the instrument.
The "final calibration" consists of comparing measured antenna temperatures, TA, during flight past RAOB sites, with direct calculations of what should have been observed based on RAOBs launched before and after the DC-8's flight near the RAOB launch site.
The procedure of comparing a measured TA with a predicted brightness temperature, TB, allows for the correction of the many small effects that cause measured TA to be slightly different from the idealized TB. These effects include such things as window losses (absorption and reflection), antenna pattern sidelobe reception of emission from the area surrounding the window, errors in measuring the temperature of the ambient calibration target, frequency passband shape errors, and errors in system gain.
Another advantage of using this type of "final calibration" procedure is that it minimizes the impact of errors in the oxygen absorption model used to derive retrieval coefficients. Retrieval coefficients are determined from a simulation involving a "least squares" solution of simulated observables (TBs) for desired retrieved properties, such as air temperature at specified altitudes. Any errors in adopted absorption coefficient for the atmosphere will lead to biases in retrieved air temperature profiles. But if the same oxygen absorption model used for deriving retrieval coefficients is also used for the calculation of predicted TB in the "final calibration," then small errors in the oxygen absorption model will have negligible degrading effect on retrieved temperatures.
Many RAOB comparisons are required in order to average out the several errors that can be present when using RAOBs to calibrate an aircraft instrument. These include: 1) RAOB errors, 2) horizontal temperature gradients (since we never fly directly over RAOB sites), 3) non-linear temporal changes (since interpolations across 12-hour intervals are required), and 4) oscillations of air temperature with time produced by inertio-gravity waves (which produce occasional departures of 1 or 2 K from time-average profiles).
System gain for each channel (i.e., frequency) was adjusted so that measured TA for the horizon view was consistent with a set of 17 radiosonde-derived outside air temperatures, OAT. It was found that each channel's gain had the same value throughout each flight, and was the same for each of the 3 flights, to within 2%.
To summarize, the steps in performing a "final calibration" of MTP/DC8 are: 1) prior to any flights, use a large set of RAOBs to determine retrieval coefficients for converting TB observables to T(z), 2) after the flights, use RAOBs (from sites that the aircraft passes) to predict TB, 3) compare measured TA at the horizon with RAOB-based OAT and refine gains for each channel (and adopt a set of gain values for all flights, or derive a procedure for determining gain), 4) compare measured TA (using the final gain set) with RAOB-predicted TB to create a set of TB - TA differences, called dTA (dTA = TB - TA), for each channel at each of the 10 elevation angles, 5) use the dTA data to derive an average "TA to TB correction table" (this is referred to as "window correction table," or WCT, for reasons that will become evident), and 6) re-analyse all raw data using the dTA table and RAOB-validated gains to calculate a corrected observable set of TBs (TB = TA + dTA) for each observing cycle, and use these TBs as input to the retrieval process to derive T(z).
Oxygen Model and Retrieval Coefficient Calculation
I have adopted an oxygen absorption model provided to us February 5, 1992 by Dr. Philip Rosenkranz (Revision Date: January 22, 1992).
Stephen J. Keihm computed retrieval coefficients prior to the first flight. This involved the use of 1045 RAOBs from Northern Canada during October through March, 1978 to 1982. Each RAOB in this archive was used to calculate TBs corresponding to the 10 elevation angles, 3 channels, and 7 representative flight altitudes (6.1, 8.2, 9.5, 10.7, 11.3, 11.9, and 12.6 km). For these calculations the radio frequency response pattern was specified by a double-sideband IF (intermediate frequency) passband response at 7 IF frequencies.
Each observing cycle provides a set of 30 measurements (TB at each of 3 frequencies at 10 elevation angles). A temperature profile retrieval consists of computing separate retrievals for temperatures above and below flight level, after which the two profiles are combined. For retrieving temperatures for altitudes above flight level the following observables are used: TB for each channel at elevation angles +80, +55, +42, +25, +12, and -12 degrees. OAT is also used as an observable, and is derived by combining the horizon view TB's for all channels. For retrieving temperatures for an altitude below flight level the following observables are used: TB for each frequency at elevation angles -80, -42, -25, -12, +12 degrees, plus OAT.
For each of the pre-specified 7 aircraft flight levels, retrieval coefficients were determined for air temperature at 33 altitudes that are offset from flight altitude by specified amounts of pressure altitude units. When the aircraft is flying at an altitude that is between altitudes for which retrieval coefficients have been calculated, the retrieval of T(z) is performed as if the aircraft were at each altitude, then an interpolated T(z) profile is calculated corresponding to the actual altitude.
In deriving retrieval coefficients it was necessary to adopt uncertainties for the TB observables. These were estimated (prior to any flight) to be 0.7 K for all observables except the 55.51 GHz measurements at elevations +80 and +55 degrees, which were assigned uncertainties of 1.5 and 1.0 K, respectively. This is intended to account for the greater sensitivity of these TBs to frequency and system gain errors (which result from the partial "transparency" of the atmosphere at these high elevation angles for this particular frequency). A better estimate of TB uncertainties is possible only after comparing observations with RAOB-based predictions. Thus, calibrating a microwave radiometer can be a several-stage process.
RAOB Predicted OAT
RAOBs sites that were closer than 300 km to the DC-8's flight track were considered for use in the following analysis. If the DC-8 passed the site more than two hours from the launch time there had to be valid RAOB data for the regularly scheduled launch times (at 0 and 12 hours UT) preceding and following the site passage time.
For the flight date 1992.02.12 there are 3 RAOB sites that meet the criteria, for 1992.02.14 there are 4 sites, and for 1992.02.17 there are 9 sites. System gains for MTP/DC8's channels 1, 2 and 3 have been computed for each of the 17 occasions that RAOB-based OAT could be compared with TB at the horizon. The gains for each flight date were the same, and are 9.5, 12.8, and 13.2 [counts/K].
Comparison of MTP TB and RAOB Predicted TB
For each of the 17 encounters with RAOB sites RAOB temperature profiles were obtained for the times preceding and following the time of flight over the launch site. A temporal interpolated profile was used to calculate "predicted" TBs. This calculation requires the use of a profile of air temperature versus geometric altitude, not pressure altitude. The required conversion was made using the hydrostatic equation. In calculating TB from the standard radiative transfer equation an altitude grid with 52 fixed levels was used. These altitudes are in geometic altitude units, and they are relative to aircraft flight altitude. The levels are closely spaced near aircraft flight level (0.1 km intervals) and are more coarsely spaced at more distant altitudes, near the bottom and top of the profile. The 52 levels extend from 12 km below flight level to 35 km above.
Measured TA, or TAobsd, and RAOB-predicted TB, or TBpred, were compared for each RAOB site. The pattern of differences for all intercomparisons has been used to produce an average pattern of dTA (dTA = TBpred minus TAobsd) versus elevation angle for each channel.
Typical dTA values are less than 1 K, but for the low frequency channel at the +55 degree viewing direction there is a persistent 4 K difference. The dTA correction table seems to be a persistent feature, in that the same gross pattern was present during all the January and February flights that have been analyzed. I believe that it is principally produced by differences in the microwave "transparent" window's absorption and reflection versus location during the elevation angle scan. Also, the window aperture is "illuminated" by a horn antenna pattern that rotates during the scan (since the horn pattern is redirected by a 45-degree parabolic reflector), and the varying amounts of sidelobe illumination of the sides of the window aperture could produce a repeatable pattern of TA differences that vary with scan location. Since I believe that the dTA adjustment table is mainly caused by the fairing's high-density polyethylene window (exhibiting absorption and reflections that are typically 0.6 % and 0.8%), I refer to it as the "window correction table."
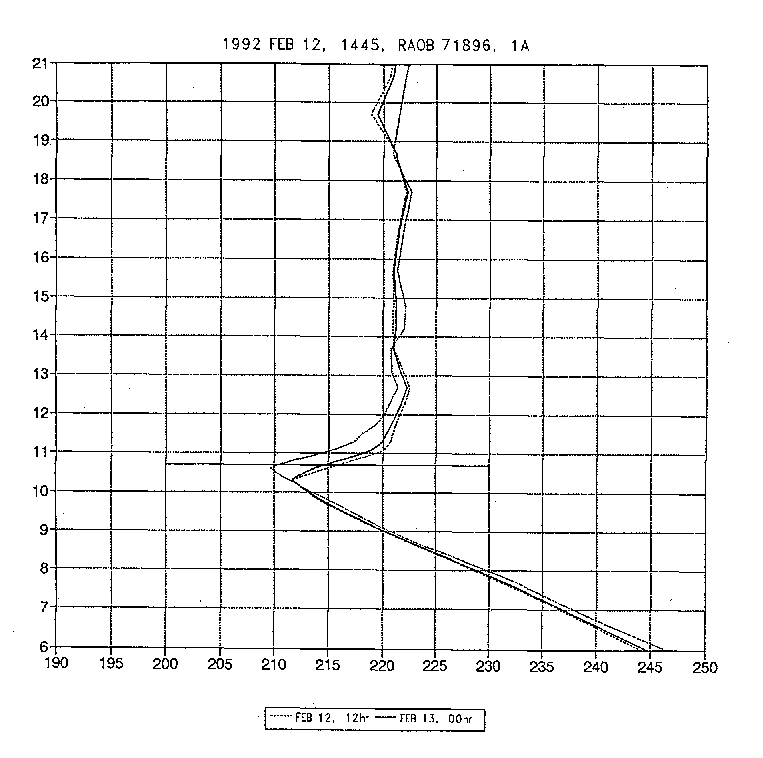
After adopting the "window correction table," the MTP/DC8 observed TBs were calculated, using TBobsd = TAobsd + dTA. Figure 1 shows the radiosonde temperature profiles for the first RAOB site intercomparison. The thick line is a temporal interpolation to the time the DC-8 flew by the RAOB site.
Figure 1. Radiosonde T(z) for before and after the time of DC-8 passage near RAOB site. The solid line is a temporal interpolation to the time the DC-8 flew by the site. Flight altitude is 10.7 km.
The scatter of "TBpred minus TBobsd" for many intercomparisons can be used to estimate measurement error for the various elevation and channel settings. Figure 2 is a plot of this RMS scatter, and I identify it as an estimate of observable errors. (Only 16 of the 17 RAOB intercomparisons could be used for this analysis because on one occasion a RAOB baloon burst at an altitude immediatley above flight level.) For comparison, in the pre-experiment retrieval coefficient calculation it was assumed that TB uncertainties would be 0.7 K for all observables except Channel 1 at 55 and 80 degrees, to which 1.0 and 1.5 K were the assigned errors. Apparently the former could have been 0.6 K and the latter should have been 1.0 and 1.9 K.
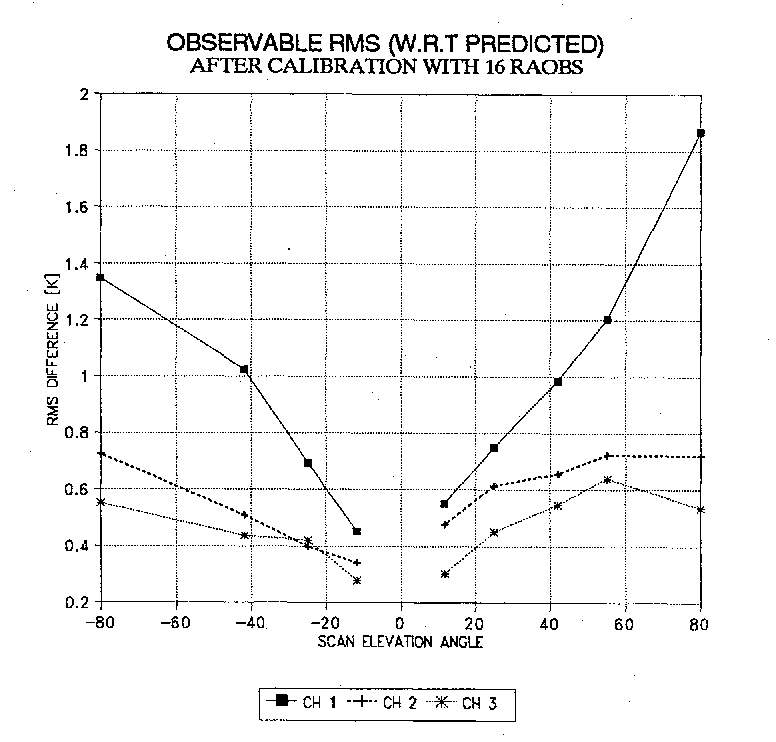
Figure 2. RMS difference between observed TA and predicted TB, versus scan angle, for each channel.
Retrieved T(z)
All raw data segments corresponding to the 16 RAOB site passes were processed to produce retrieved T(z) using the one set of gains and the improved "window correction table." (During one of these passes, the one with the lowest flight altitude, 8.9 km, horizontal gradients were excessive, being 3 K/150 sec, which degraded the retrieved profile, so this intercomparison was rejected from subsequent analysis.)
A detailed comparison of MTP retrieved T(z) and RAOB measured T(z) was undertaken. Plots of differences versus altitude showed that performance at the high altitudes were slightly worse during low altitude flight (9.1 and 9.5 km), compared with the bulk of the data at flight levels 10.7, 11.3 and 11.9 km. The 3 low altitude intercomparisons were not included in the following analysis, so as to better characterize the high altitude performance for the bulk of the data.
Figure 4 shows "retrieved T(z) minus RAOB T(z)" for the 12 passes having flight altitude > 10 km. A slight pattern of "too warm" is present at 15 to 18 km (about 1.6 K), as well as a pattern of "too cool" at 9 to 12 km (about 0.7 K). This pattern is statistically significant, and is probably due to the observations occurring near the end of the 6-month simulation period used in deriving retrieval coefficients (February/March versus October through March). Since the retrieved T(z) is inherently biased toward the archive average profile, it is to be expected that altitude biases will be present for retrievals not uniformly representing the simulation period. Instead of re-determining retrieval coefficients using only RAOBs from February and March, which is labor expensive, I decided to perform a polynomial fit to the differences data and include it as an additional "seasonal" correction to be applied to the February/March retrievals.
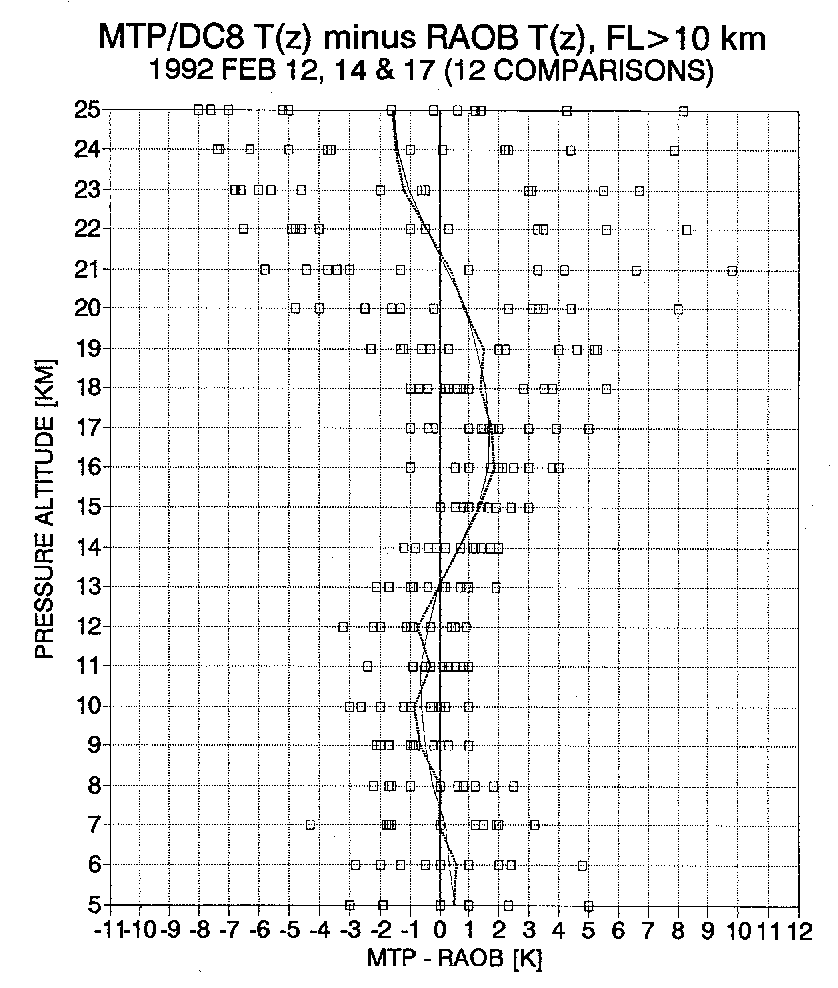
Figure 3. Differences between retrieved T(z) and RAOB T(z) for 12 flights times near RAOB sites.
Figure 4 shows the final MTP/DC8 retrieved T(z) for flight near the first RAOB site.
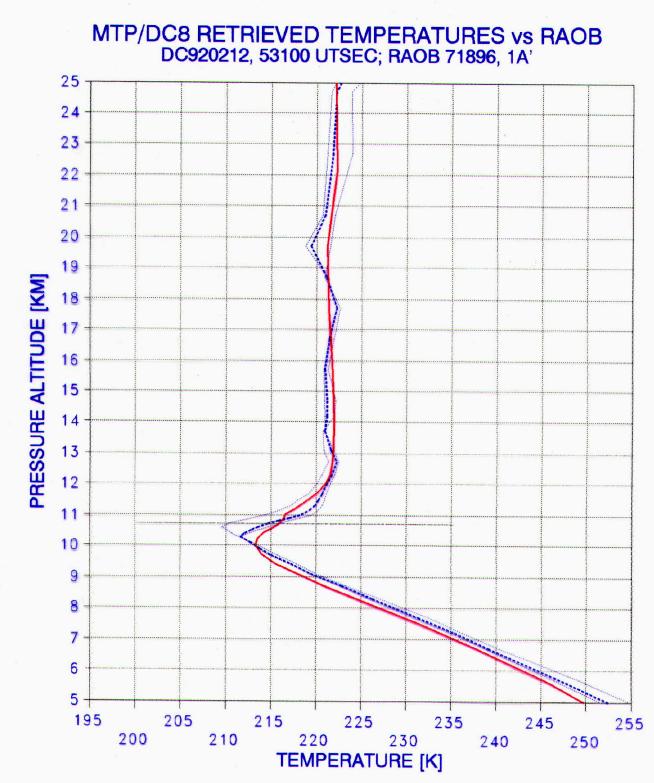
Figure 4. The first RAOB site is used to illustrate retrieved T(z) in relation to ROAB T(z). Solid red trace is MTP retrieved (2-minute average), the thick blue dotted trace is from the NMC "forecast" temperature field, and the other traces are RAOBs (before, after and interpolated).
This intercomparison, although it is the first in the series of intercomparisons, is not "representative;" it is one of the "best" intercomparisons. The following 3 figures show the remaining comparisons of MTP retrieved, RAOB, and NMC ("analyzed") T(z).
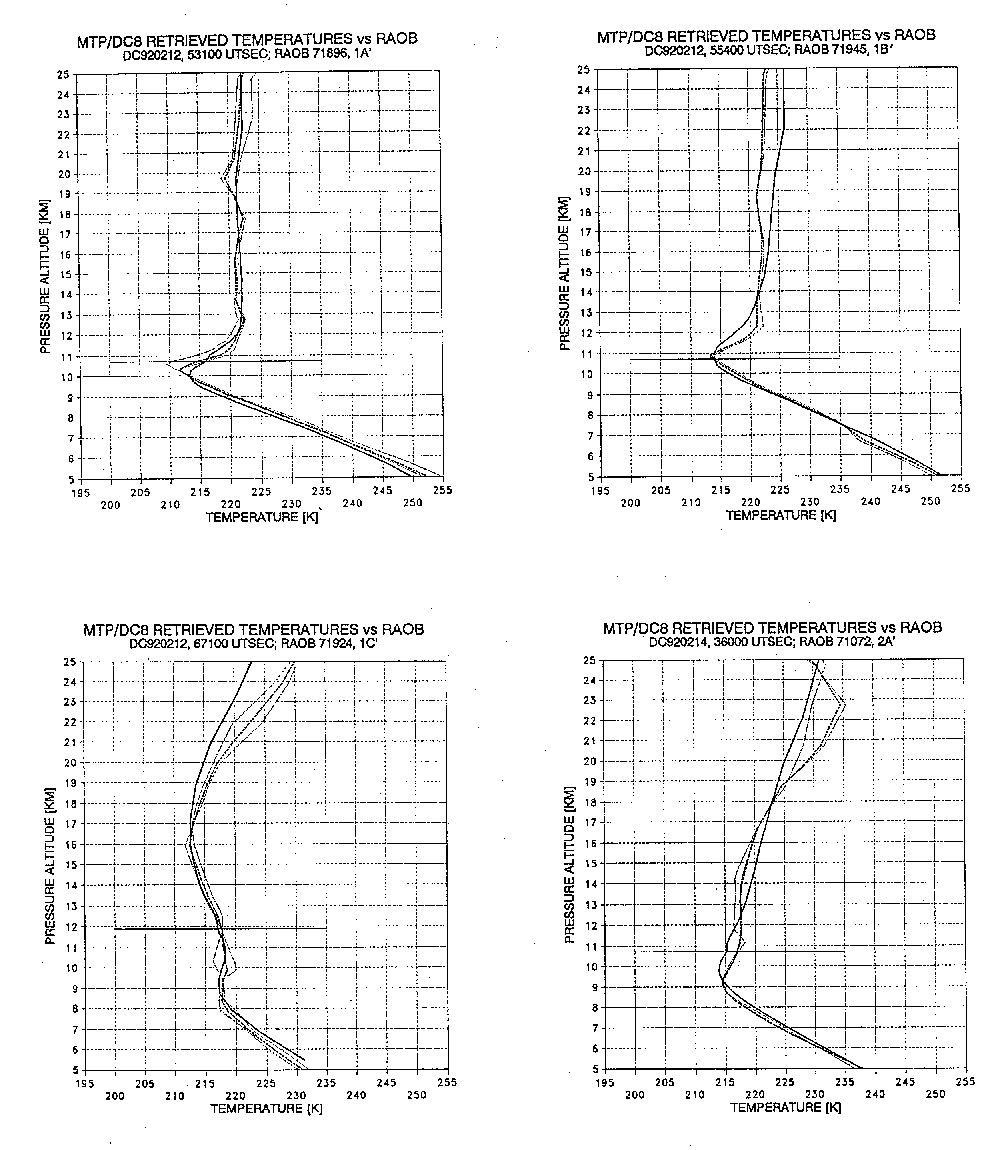
Figure 5. Retrieved T(z), RAOB T(z), and NMC "analyzed" T(z) for 4 of the 12 MTP/RAOB comparisonss under analysis.
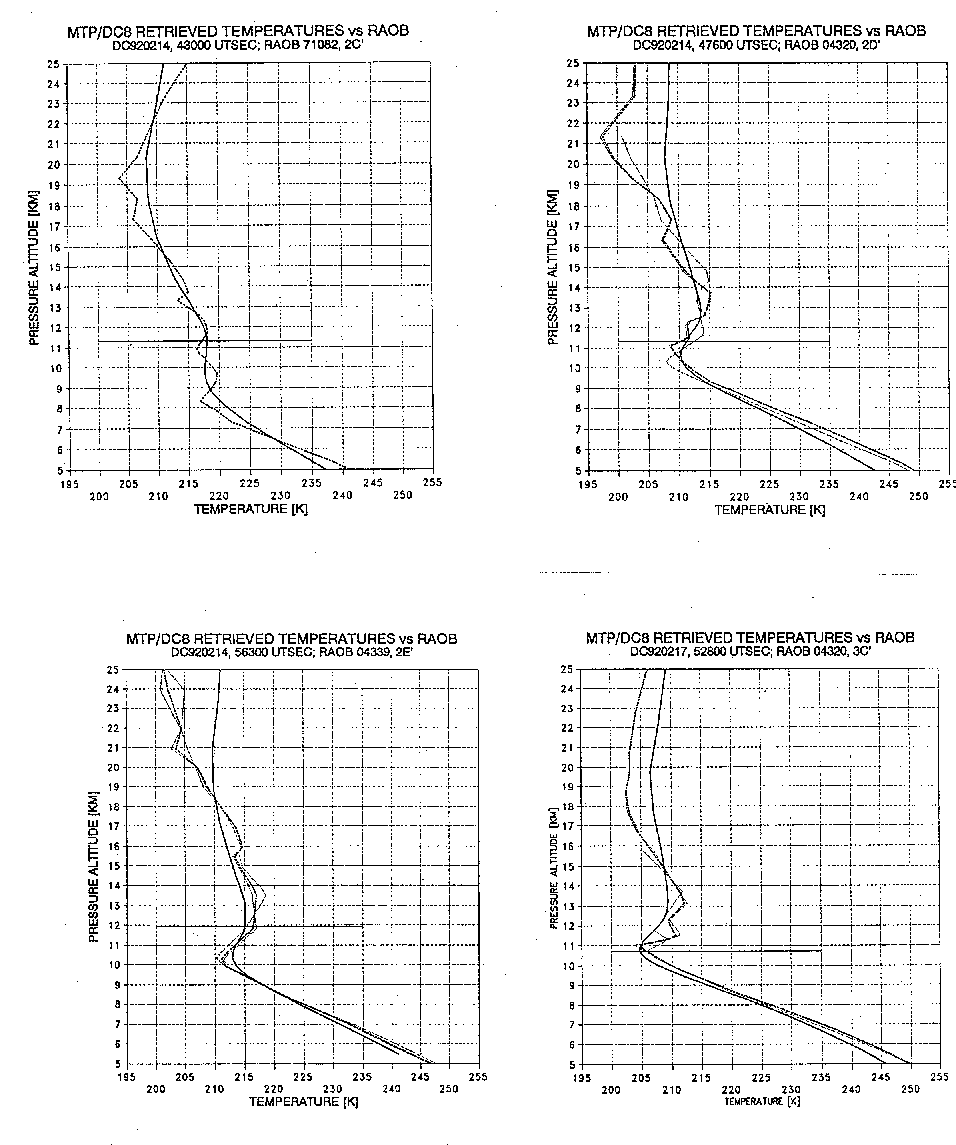
Figure 6. Retrieved T(z), RAOB T(z), and NMC "analyzed" T(z) for 4 of the 12 MTP/RAOB comparisons under analysis.
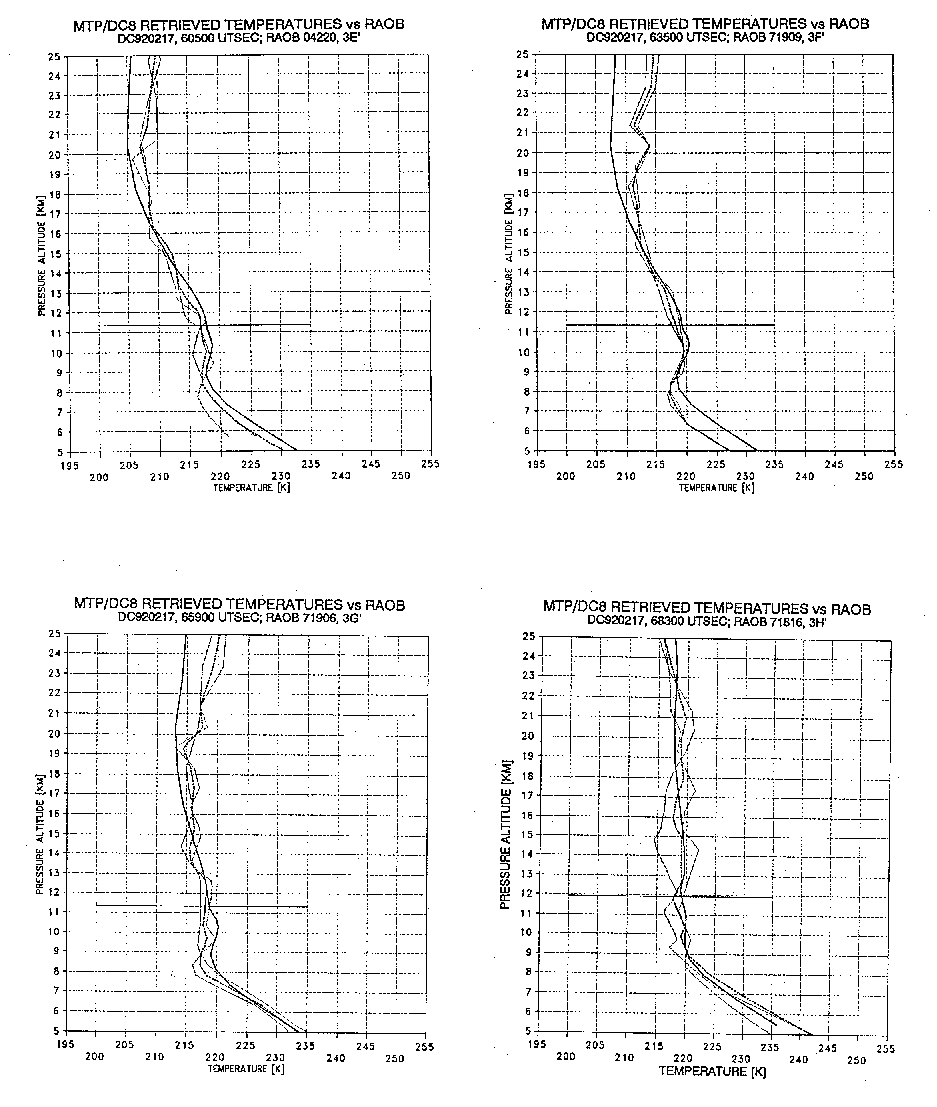
Figure 7. Retrieved T(z), RAOB T(z), and NMC "analyzed" T(z) for 4 of the 12 MTP/RAOB comparisons under analysis.
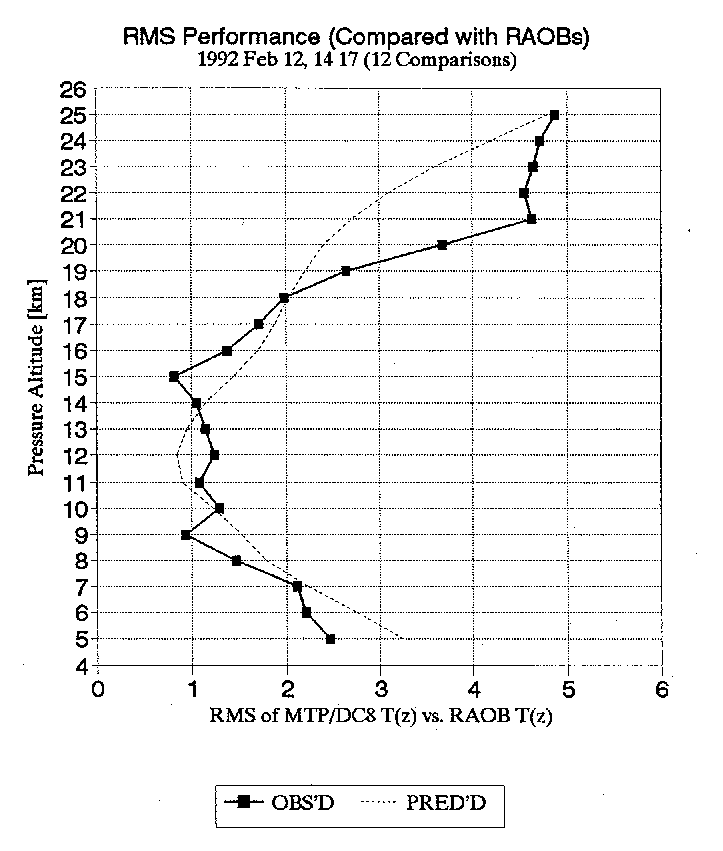
Figure 8. RMS difference between MTP retireved T(z) and RAOB interpolated T(z).
Figure 8 is a plot of the RMS difference between MTP/DC8 retrieved T(z) and RAOB T(z). The "observed" RMS trace closely matches the pre-experiment "predicted" RMS trace for all altitudes below about 19 km.
The analysis to this point assumes that RAOBs are free of errors. However, by interpolating RAOB profiles in time, and adopting RAOB sites that were as far away as 300 km from the aircraft's flight path, a component of error has been introduced into the intercomparison analysis by these assumptions. If that error can be assessed, or even assumed, it should be orthogonally subtracted from the RMS performance in Fig. 9.
3-Way Derivation of Each Profile RMS
There are 3 methods for deriving T(z): MTP/DC8, RAOBs, and National Meteorological Center, or NMC. If it can be assumed that their associated errors are independent in sign and magnitude, then there is a way to determine the magnitudes of each error source (which is not possible when only two independent methods are available). The first step is to determine RMS(z) profiles for each intercomparison possibility: 1) "MTP versus RAOB," 2) "NMC versus RAOB," and 3) "NMC versus MTP." The first of these is shown in the previous figure.
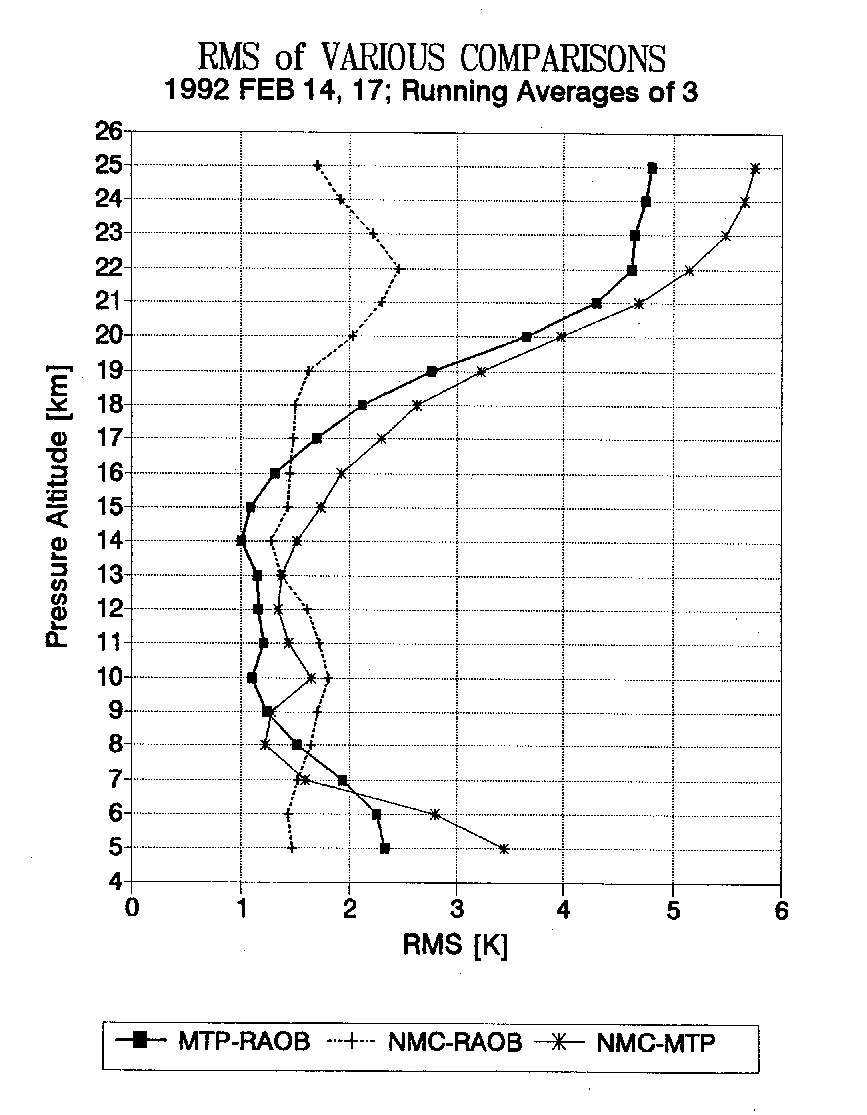
Figure 9. RMS(z) profiles for the 3 intercomparison possibilities (described in the text).
Figure 9 is a plot of the RMS scatter for the 3 comparisons, where altitude averaging has been imposed, as necessary. Note that the RMS of each comparison of the 3-way comparisons can be viewed as a situation of "3 equations with 3 unknowns." This set of equations can used to "solve for" each unknown: the RMS uncertainty of MTP, RAOB, and NMC (at each altitude). For example, if the RMS scatter between MTP and RAOB is denoted by Smr, the RMS scatter between NMC and RAOB is denoted by Snr, and the RMS scatter between MTP and NMC is denoted by Smn, then the RMS of MTP, by itself, Sm, can be calculated:
Sm = (0.5*(Smn2 + Smr2 - Snr2))1/2
Similar equations specify Sr and Sn, the inherent RMS scatter of RAOB and NMC T(z). These equations can be "solved for" at each altitude.
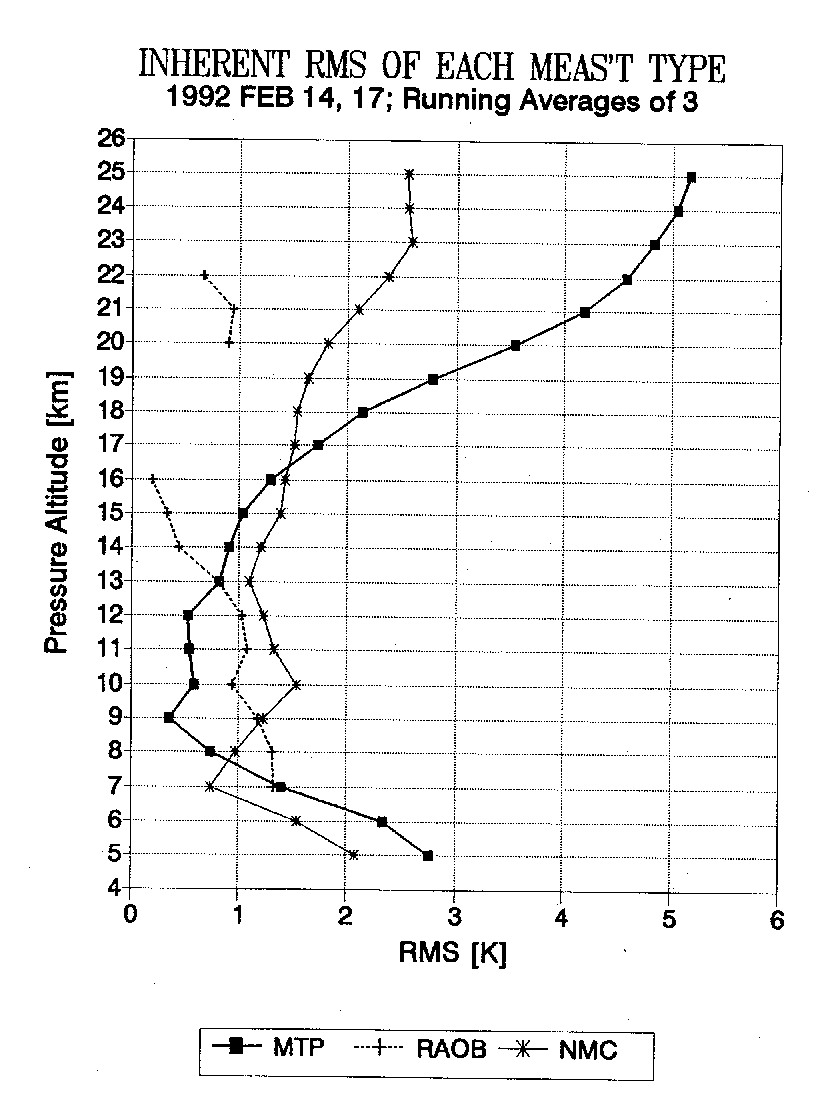
Figure 10. RMS(z) profiles for the 3 intercomparison possibilities (described in the text).
Figure 10 is the result of solving the 3 equations, at each altitude, producing the estimate of inherent RMS of each T(z) type. The gaps in the RAOB RMS(z) solution indicate that a negative RMS is called for, which means that there's an incompatibility between the 3 comparison RMS's at these altitudes. This incompatibility could be due to various factors, such as the use of slightly different subsets of data (the 920212 NMC data couldn't be included in the analysis, since it was "forecast" instead of "analysis" data), small number statistics, and violation of the assumption of correlated errors.
This exercise suggests that the MTP/DC8 T(z) inherent standard errors (S.E.) are lower than pre-experiment predictions, and as low as 0.5 K in the 9 to 12 km altitude region. This is possible, since Fig. 2 shows that the observables that determine this part of the MTP/DC8 retrieved T(z) have lower uncertainties than were adopted in the pre-experiment simulation (which predicts the RMS performance).
It is not possible, in my opinion, for the RAOB RMS to be less than 0.5 K, as is called for at some altitude regions. I also doubt that the RAOB RMS can be significantly different at slightly different altitudes. Therefore I adopt a single value for RAOB RMS for all altitudes, and adjust the MTP/DC8 RMS profile accordingly, by orthogonal subtraction.
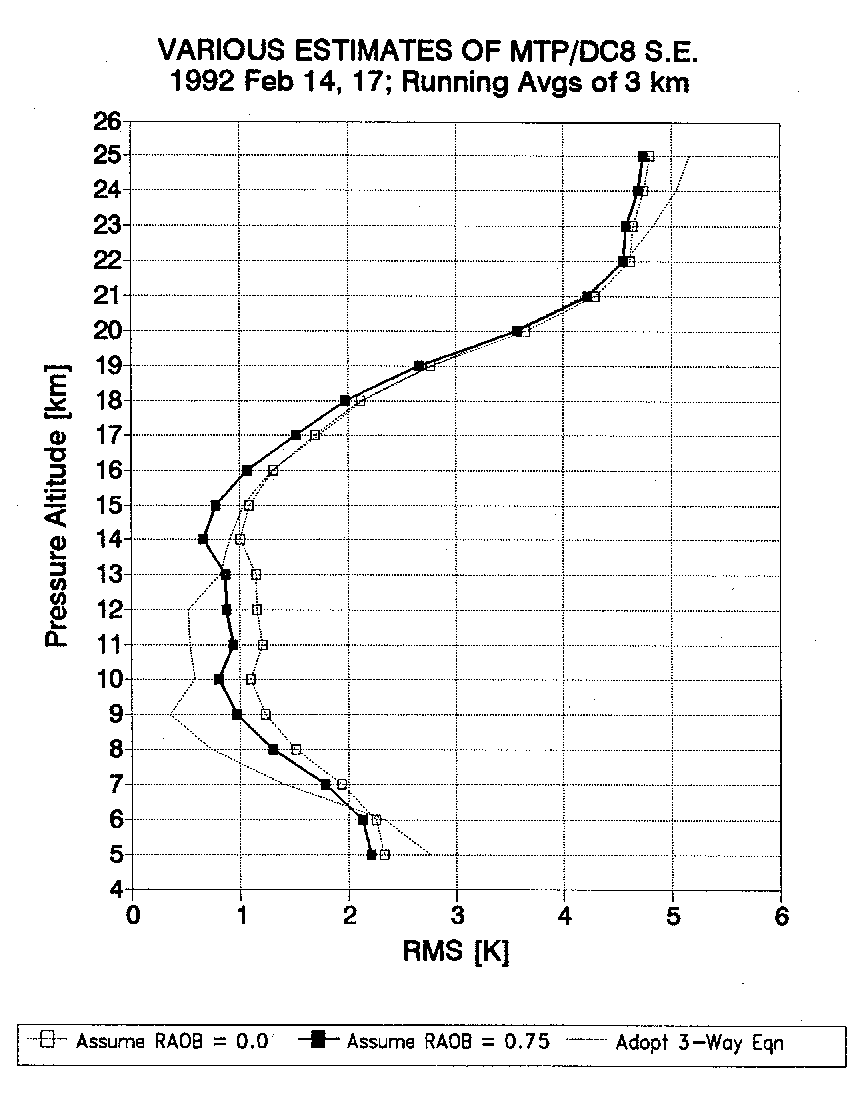
Figure 11. RMS(z) profile solutions for the MTP based on 3 assumptions (described in the text). The "Assume RAOB = 0.75" trace (thick line with filled squares) is the most likely estimate for MTP's T(z) RMS uncertainty.
Figure 11 shows the result of orthogonally subtracting a 0.75 K RAOB RMS uncertainty profile from the MTP/RAOB difference RMS profile. This is my current best estimate of MTP/DC8 performance. For comparison, the MTP/RAOB difference RMS profile is shown, labelled "Assume RAOB = 0.0" and the 3-way solution for MTP/DC8 inherent RMS is also shown.
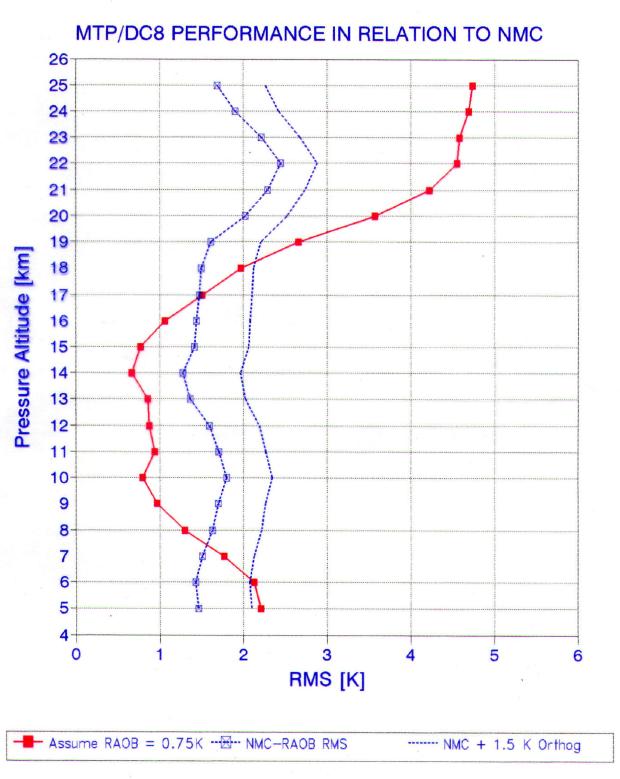
Figure 12. Comparison of MTP's RMS(z) performance profile (red) with NMC temperature field for locations where RAOBs are available (blue dotted with symbols) and locations far from RAOB sites (blue dotted).
Figure 12 repeats the "Assume RAOB = 0.75" trace of Fig. 11, and adds the NMC/RAOB RMS profile. I will argue that the NMC/RAOB RMS trace is a best estimate of inherent NMC RMS accuracy. Whereas it could be argued that RAOBs have errors, and these show up in the NMC/RAOB comparison RMS profile, it is also true that the NMC temperature field, being based mostly on the RAOBs, shares some of the RAOB errors and is therefore an under-estimate of the inherent NMC RMS profile. (Satellite-derived temperatures are also incorporated in the NMC data assimilation, especially at higher altitudes, but near RAOB sites the bulk of the influence to the NMC temperature field solution must come from RAOBs.) In adopting the NMC/RAOB RMS trace as the best estimate for the NMC inherent accuracy trace, I am assuming that the two compensating errors have approximately the same magnitude.
Note that the NMC/RAOB RMS profile should apply to regions close to RAOB sites, and for locations distant from RAOB sites the NMC errors should increase (since there are few RAOBs to serve as input to the NMC temperature field, and the satellite temperatures are inherently less accurate than RAOBs). There is no direct way of evaluating the NMC inherent RMS uncertainty at remote locations, for if RAOBs were available at these locations they would be incorporated into the NMC analysis and they would, by definition, no longer be remote locations. Consequently, to provide an estimate of NMC inherent uncertainty that might be expected at remote locations I have arbitrarily orthogally added 1.5 K to the NMC/RAOB RMS profile.
One method for estimating an NMC RMS uncertainty profile is to produce a series of MTP/NMC RMS difference profiles corresponding to different distances from the nearest RAOB site. Since the MTP RMS performance should not degrade with distance from the nearest RAOB site, but the NMC performance will, it should be possible to attribute all the increase in NMC/MTP RMS with distance to an increase in NMC RMS error, and thereby determine the dependence of NMC RMS with distance from RAOB sites. This is an activity for future work.
Performance Summary
At this point in the analysis it can be stated that the MTP/DC8 retrieved T(z) exhibits a standard error, S.E., of 1.0 K from 9 to 16 km, and 2.0 K from 6 to 18 km. In addition, the MTP/DC8 retrieved T(z) has a lower S.E. than the NMC T(z) from 7.5 to 17 km when flying close to RAOB sites, and approximately 6 to 18 km when flying at more remote locations.
Using the statistical retrieval method for deriving MTP/DC8 retrieved T(z), the NMC temperature field is always superior above approximately 18 km. Pre-experiment performance predictions have been achieved or exceeded for altitudes from 5 to 18 km, but performance between 18 and 24 km is slightly worse than predicted. This altitude region will be the challenge for future studies and instrument improvements. A Bayesian estimation procedure is currently under investigation which will incorporate the NMC temperature field as a priori information and will explore hypothetical temperature profile "space" without the limitations of "linearity" and prior years simulation archive biasing which is inherently present in statistical retrieval procedures.
This is the first demonstration of an airborne 3-frequency microwave temperature profiler employing statistical retrieval techniques. It demonstrates a performance superior to all previous microwave profilers, and thereby validates the concepts underlying its conceptual design.
MTP/DC8 RMS performance assessments were conducted for the 1995/96 TOTE/VOTE mission and the 1997 SONEX mission. A description of this analysis is presented on another web page, MTP/DC8 Late 90s RMS Performance Assessment.
This site opened: February 24, 2000. Last Update: February 27, 2002