BIGGEST MOUNTAIN WAVE
ENCOUNTERED BY AN MTP INSTRUMENT:
"SOLVE" FLIGHT DC2000.01.25
Bruce L. Gary, 2000.03.28
Flight Track
Color-Coded Temperature
Cross-Section
Isentrope Altitude
Cross-Sections
Biggest Mountain Wave
Event
IAC Zoom of Biggest
Wave
Map of Wave Intensity
In Situ Wind Setting
Radiosondes in Region
Synoptic Scale Setting
Other Links
Introduction
The SOLVE mission (SAGE II Ozone Loss and Validation Experiment) was supported by two MTP (Microwave Temperature Profiler) instruments. The MTP/ER2 flew on a NASA ER-2 aircraft, typically at 19 to 20 km altitude, and the MTP/DC8 flew on the NASA DC-8 aircraft, typically at 11 or 12 km. Prior to this flight the largest amplitude mountain wave encountered (i.e., documented) by an MTP instrument was the MTP/ER2 case of September 22, 1987 (First Mountain Wave Encounter) - which, ironically, was the first mountain wave analyzed by an MTP instrument.
This web page contains my analyses of this encounter. The first few sections describe portions of the flight that precede the "big wave" encounter. They illustrate how large an area must have been involved in the mountain wave pattern on this date. For example, it appears that the entire north-south extent of the Norway/Sweden peninsula was producing mountain waves for at least several hours. If you want to jump forward, to get a peek at the "big one," click here, but then come back and read from the beginning.
As the analysis proceeds, the web page will "grow."
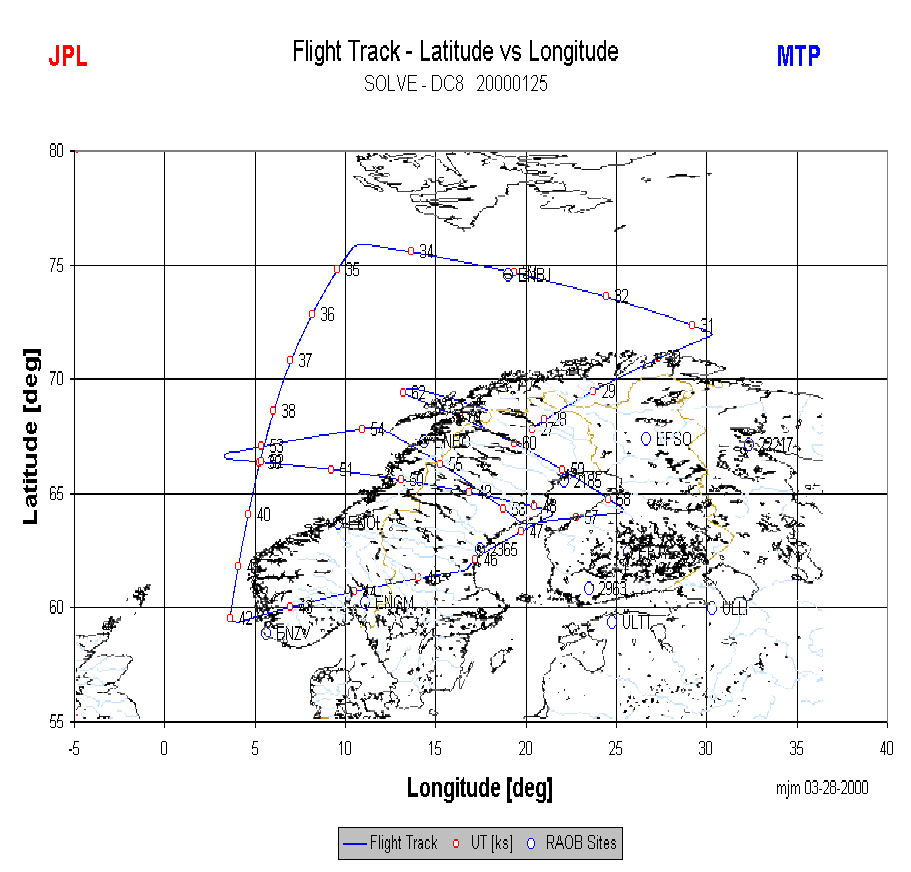
Figure 1. Flight track. The red circles with numbers along the fight track denote UT kilosecond time tags. The blue ovals are radiosonde launch sites, with their 3 or 4-letter WMO site designations. The highest mountains are generally found along the Norway/Sweden border. (The vertical scale needs to be expanded to achieve proper proportions.)
Color-Coded Temperature Cross-Section

Figure 2. Color-coded Temperature Cross-section, CTC. The horizontal axis is compressed in such a way that several MTP data cycles are averaged per horizontal pixel width, resulting in the masking of some short-period mountain wave features. The black trace is the DC-8 geometric altitude, and the white trace is MTP-derived tropopause altitude.
Isentrope Altitude Cross-Sections

Figure 3. IAC for entire flight. All isentropes are 5 K apart. The tropopause is shown with small, filled, black triangles. DC-8 flight altitude is a continuous black trace.
In this figure three mountain wave events are apparent. They are at 49.4 ks (13.7 hrs), 55.3 ks (15.4 hrs), and 60.2 ks (16.7 hrs). The last event is the "biggest mountain wave" encountered by the MTP (on any airplane), and is the subject of this report.

Figure 4. Zoom of 1st wave candidate, which turns out to not meet the criteria for a mountain wave event. It's shown here because of the interesting isentrope strucure. Flight is near the Norwegian north coast, and because of its association with underlying topography I believe it is a low amplitude mountain wave.

Figure 5. This is another non-wave feature, shown again because of its interesting isentrope structure. The tropopause rises from 10.2 km to 12 km, then jumps down. The DC-8 is flying south of Spitzbergen. It may be the down-wind portion of a Spitzbergen-generated mountain wave. It is "unrelated" to the other mountain waves of this flight.

Figure 6. This is NOT a mountain wave; it is probably a sub-polar jet feature. The interesting isentrope structure is associated with a sloped tropopause (small, black triangles). The tropopause again rises from 10.3 km to 12.2 km while a nearly adiabatic layer apepars below it. The DC-8 is flying south over the ocean, and this is consistent with tropopause behavior near the sub-polar jet. (Note: The DC-8 altitude and tropopause symbols are the same black triangles in this figure.)

Figure 7. Zoom of 1st wave event (13.7 hrs). The DC-8 is flying near tropopause altitude, with very low stability air below. One large positive displaement feature occurs in a region of synoptically higher altitude isentropes. This event occurs while flying across the Norway/Sweden mountain crest line (at a latitude of 65.3 degrees North). (Note: A smooth black line goes through the average tropopause altitude.)
In this figure the tropopause descends while flying north, and it may mark the location of the previous figure's putative sub-polar jet, encountered over the ocean at 36.4 ks (and 72 degrees North latitude).

Figure 8. Same data as in the previous figure, but showing phase lines. Most phase lines are not sloped.

Figure 9. Zoom of 2nd wave event (15.4 hrs).
This wave encounter corresponds to eastward flight over the Norway/Sweden mountains. Most of the wave structure is downwind of the crest line (which is over-flown at 55.0 ks).

Figure 10. Same data as in the previous figure, but showing phase lines. Most phase lines are not sloped.

Figure 11. Zoom of 3nd wave event (16.7 hrs). This is the largest amplitude wave ever documented by an MTP instrument. In the stratospehre wave amplitude grows with altitude, whereas in the troposphere wave amplitude is damped in the tropopause region. This is probably caused by the greater work required to vertically displace air where the static stability is greater (where the isentropes are closer together).
This wave event occurs while flying west (upwind) over 6800-foot Sarjektjakko mountain, near the Norway/Sweden border.

Figure 12. Same data as shown in the previous figure, but showing phase lines, most of which are not sloped.

Figure 13. This shows the same data of the previous two figures, but without averaging. All other figures include sliding boxcar averaging of 3 MTP data cycles.
This figure is included to show that the observed wave structure is essentially the same with and without the sliding boxcar averaging of MTP data. Averaging is done to reduce the effects of stochastic noise, and the resultant isentrope shapes are usually "real" instead of stochastic noise artifacts.
Figure 14. Zoom of big wave event, using unaveraged data. Individual MTP data cycles (15 seconds apart) are indicated with dot symbols for the set of cyan-colored isentropes. The isentrope at 10.5 km at the left border has a potential temperature of 315 K; the isentrope at 14.0 km at the left border has a potential temperature of 360 K.
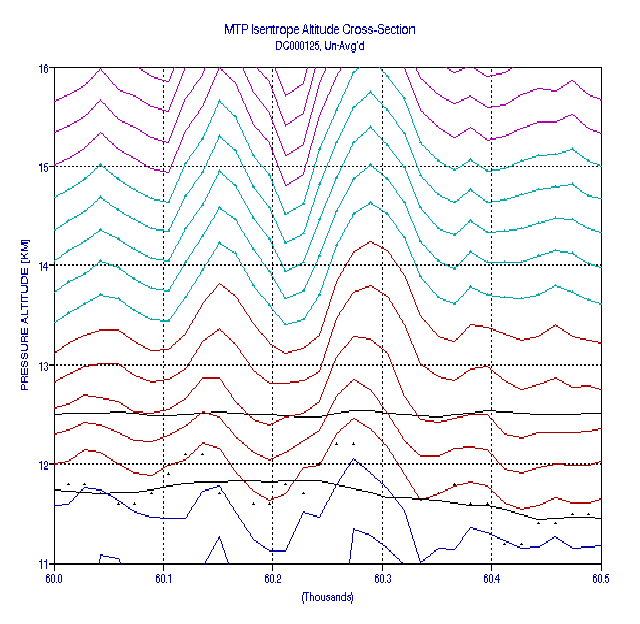
Figure 15. Greater zoom of big wave event, using unaveraged data. The DC-8 is flying at 12.4 km, and the tropopause averages about 11.7 km.
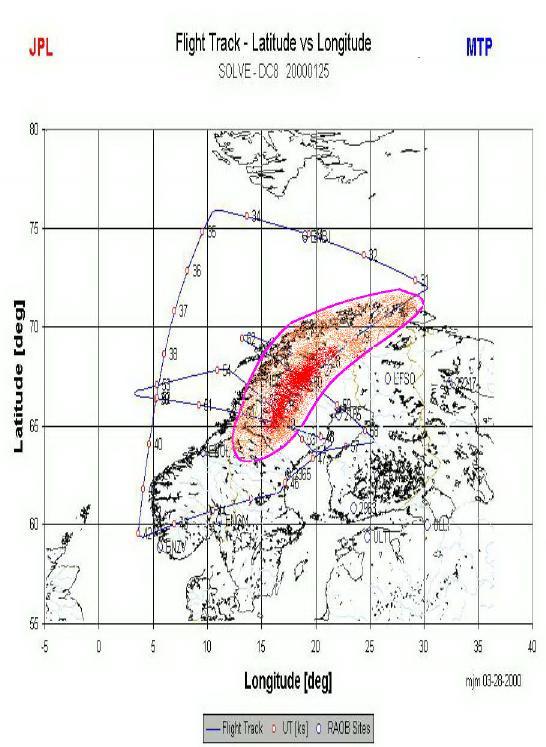
Figure 16. Map of "wave intensity," based mostly on
wave amplitude.
[Image available upon request. This data is officially not yey "in the public domain."]
Figure 17. Wind components, U and V, and roral wind
speed for the entire flight.
[Image available upon request. This data is officially not yey
"in the public domain."]
Figure 18. Wind speed and direction for the entire flight.

Figure 19. Wind direction for selected times during the flight. The thick red lines correspond to wave features; the thin red line is included to show wind direction at the southern tip of the flight.
This figure shows that at DC-8 levels, just above the tropopause, the wind direction was perpendicular to the mountain "ridge line." If this condition held at lower altitudes, then one of the preconditions for generating mountain waves was met.
Return to list of other MTP/DC8 SOLVE Flights (link internal to this web site, maintained by Bruce L. Gary)
Go to MTP/DC8 SOLVE web page at JPL (link external to this web site, maintained by M.J. Mahoney)
___________________________________________________________________
This site opened: March 28, 2000. Last Update: March 30, 2000