This web page describes some early observations I made of transiting exoplanet XO-2b, which was made public on May 1, 2007. It can serve other amateurs wishing to start their own transit observations of this interesting solar system.
Introduction
The observations reported here are not meant to represent the work
of the "extended team" (ET) of amateur observers supporting the Space
Institute for Science XO Project. It's purpose is to present in one
place some materials that will be helpful to any amateur interested in
starting their own observations of XO-2 transits. The web page is also
intended as a site where I can place additional future observations for
the purpose of "data exchange" with the community of amateur observers
also engaged in XO-2 observations.
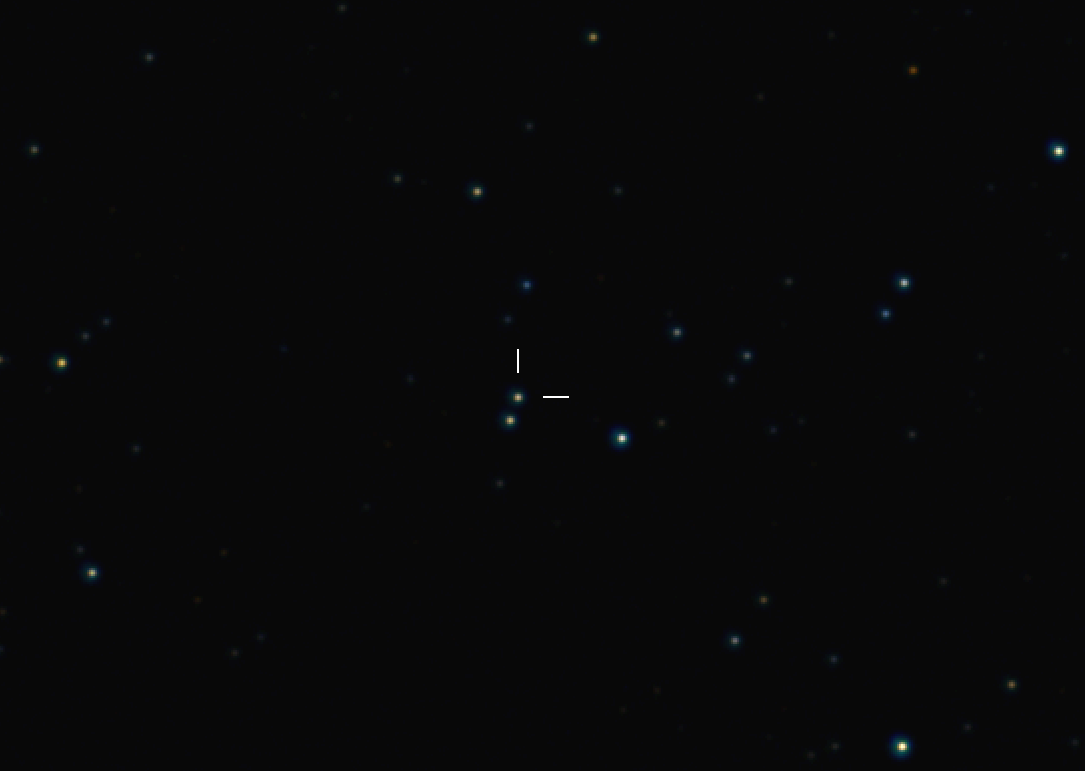
XO-2 is located at RA = 07:48:06, Decl = +50:13:33. With this RA the "observing season" for it is centered on January 20 (i.e., from October 1 to June 1). The color image below shows the XO-2 star field.
Figure 1. Color image of the XO-2 star field, FOV = 25 x
16 'arc (crop of original 68 x 45 'arc). North-east is at upper-left. 30
"arc south of XO-2 is the binary companion; the two stars are referred
to as XO-2N and XO-2S. [Meade LX200GPS, HyperStar prime focus,
f/2.0, SBIG ST-8XE CCD, 2007.01.24, RGB total exposure times = 90, 80
and 70 seconds, Hereford Arizona Observatory]
In this image it can be seen that some very blue stars are present
nearby. These should NOT be used for reference when doing differential
photometry due to differences of extinction with air mass for stars
having different colors (explained below).
The next image shows BVRcIc magnitudes for selected stars near XO-2.
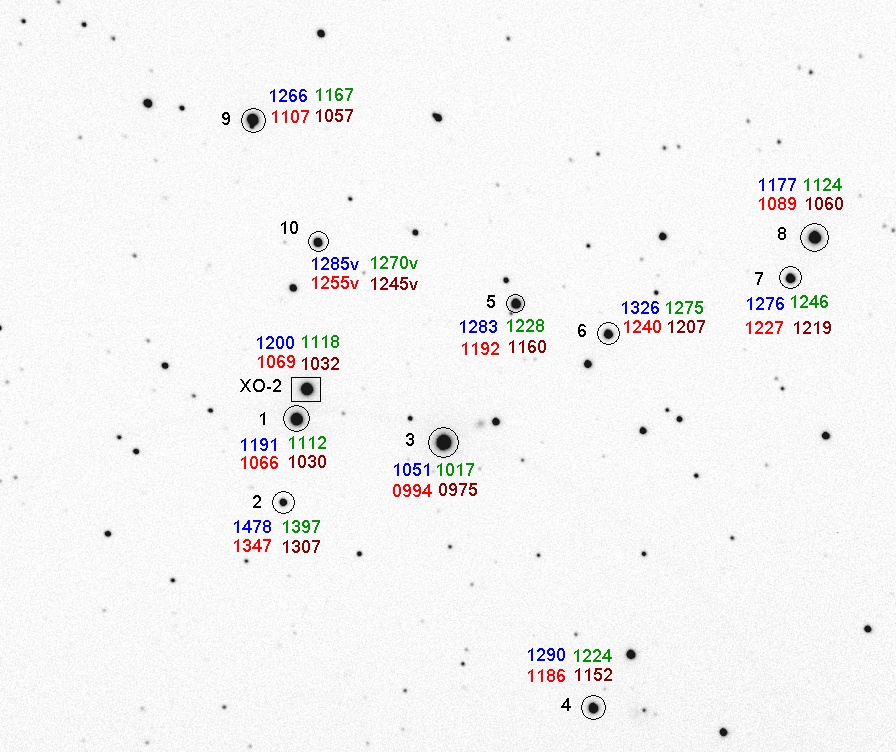
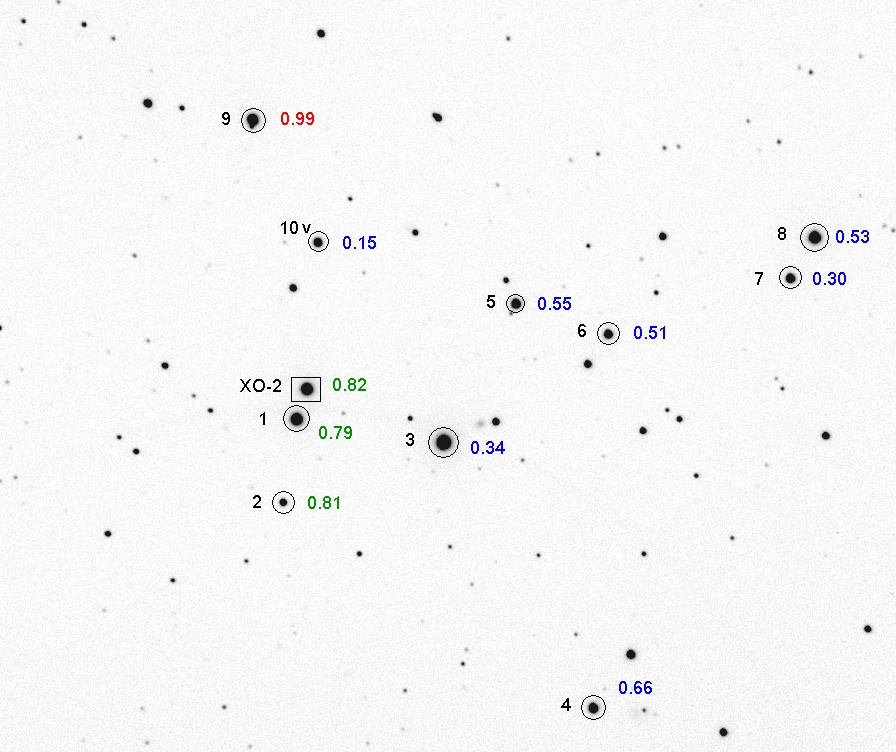
Figure 3. B-V star colors for stars in the XO-2 field.
Star #10 is indicated as a variable in the previous two figures. The next figure shows this for one observing date.
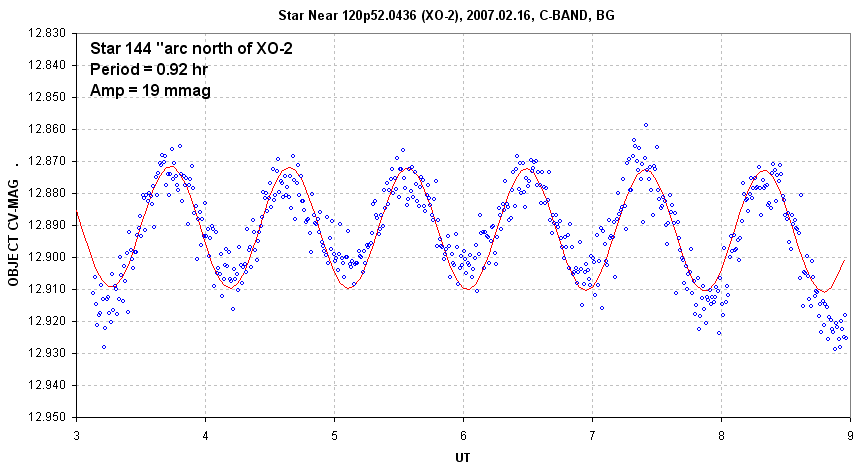
Figure 4. Variations of Star#10 with a sinusoidal fit.
This star should be avoided when choosing reference and check stars.
Below is a table of magnitudes and colors for XO-2N and XO-2S.
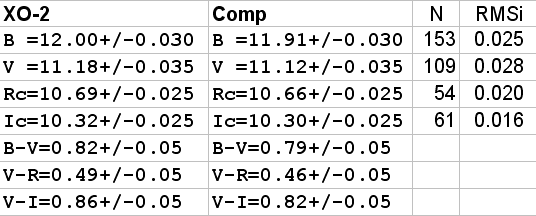
Figure 5. BVRcIc magnitudes and colors of XO-2N (left) and
XO-2S (labeled "Comp"). The next-to-last column shows the number of
Landolt stars used in solving telescope photometry constants on the
date that the XO-2 star field was calibrated. The last column is
Landolt star RMS residuals from the photometry fits.
XO-2S is slightly brighter than XO-2N.
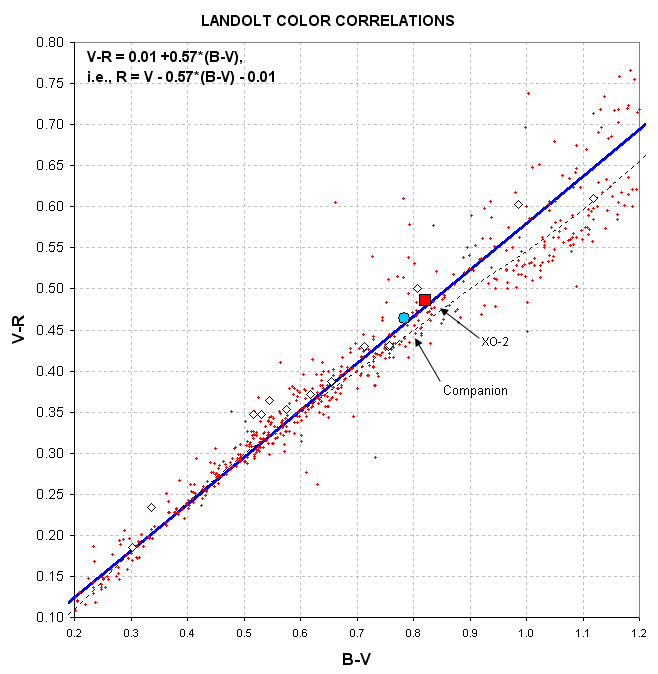
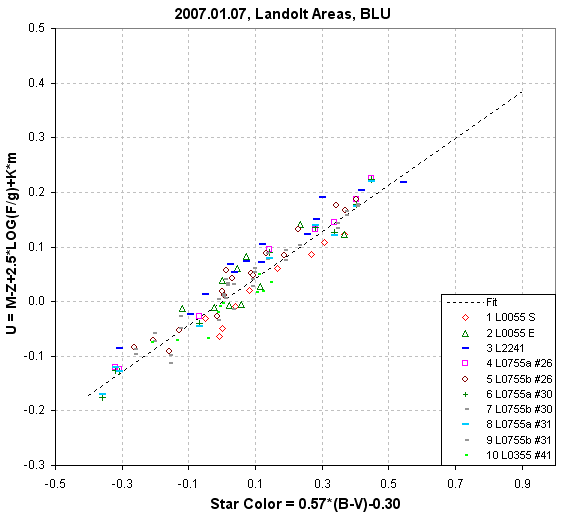
Figure 6. V-R versus B-V scatter diagram for 853 Landolt
stars (red dots), stars in the XO-2 field (diamonds), and XO-2N and
XO-2S (red and blue symbols, labeled).
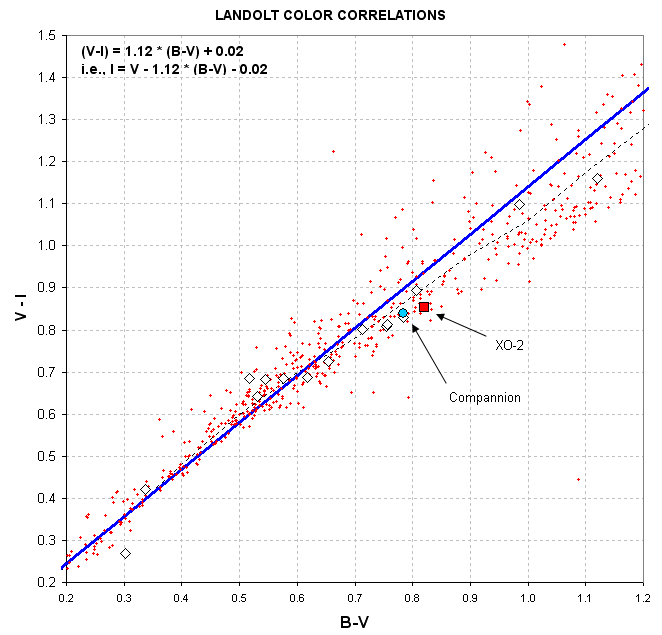
Figure 7. V-I versus B-V scatter diagram for 853 Landolt stars
(red dots), stars in the XO-2 field (diamonds), and XO-2N and XO-2S
(red and blue symbols, labeled).
This section is devoted to transit light curves taken since January, 2007.
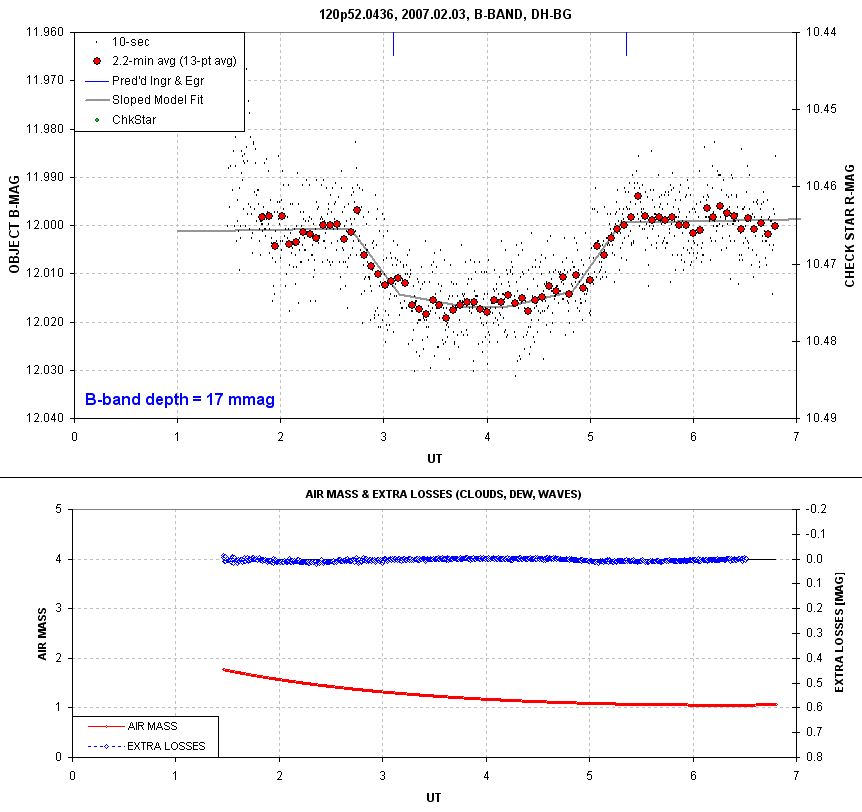
Figure 8. B-band light curve of a complete transit made
with a 32-inch telescope (the Junk Bond Observatory, a Ritchey-Chritien,
f/7.2 without focal reducer, inside a dome, owned by Dave Healy). The observations were made by
the author and JBO Director Dave Healy on February 3. The lower panel
shows air mass (red) and atmospheric losses (blue) different from those
expected for a zenith extinction of 0.25 magnitude per airmass.
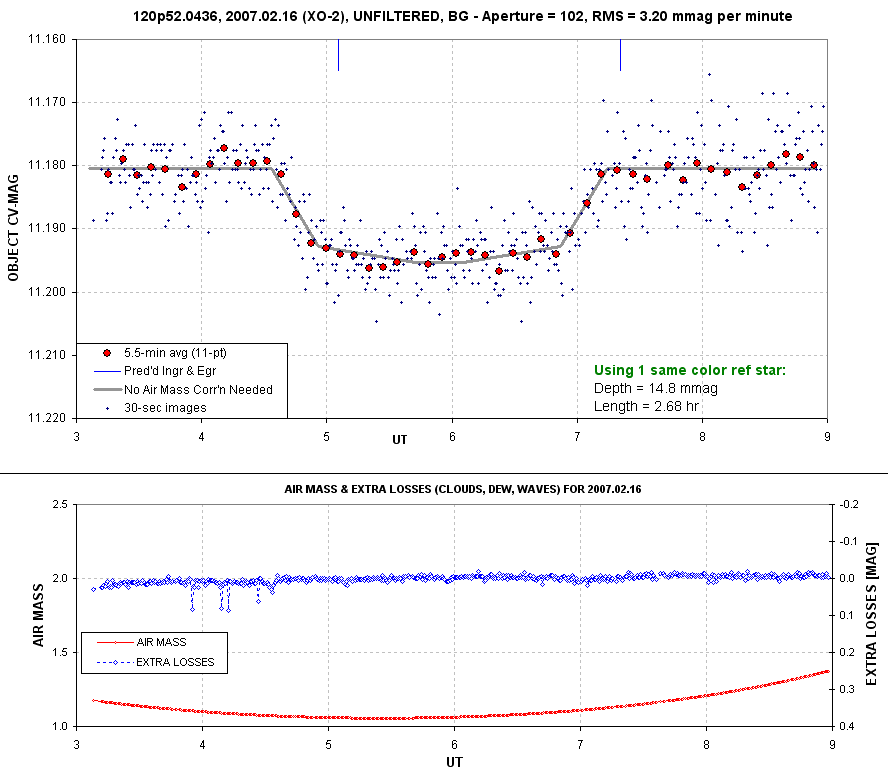
Figure 9. Unfiltered observations of a complete transit
made with a 14-inch telescope on 2007.02.16. XO-2S was used as the sole
reference star for this differential photometry analysis.
Notice that the unfiltered transit depth is smaller than the B-band
depth. This is due to limb darkening of the XO-2N star and the fact
that the transit chord has an "impact parameter" (ratio of closest
distance from star center to star radius) that is <~0.7.
![]()
Figure 9. Transit light curves showing the effect of
choosing stars of different colors for reference. The observations are
unfiltered on 2007.02.16.
This figure illustrates the importance of using only same-color stars for reference.
Transit Schedule
The exoplanet period is 2.6 days and mid-transit times can be calculated from the following:The difference between HJD and JD is less than 7 minutes so this
equation will be accurate enough for the purposes of planning
observations.
As a starter, the next mid-transit time is 2007.05.03, 02.64 UT. Ingress and egress are 1.34 hours before and after this time.
![]()
Related Links
Astrophysics Abstracts (first public disclosure of XO-2): http://arxiv.org/abs/0705.0003
XO-1 observations and observing tutorial: http://brucegary.net/XO1/x.htm
My "exoplanet transit systematics" tutorial: http://brucegary.net/TransitSystematics/transitsystematics.htm
Bruce's Astrophotos (with links to all my astronomy web pages): http://reductionism.net.seanic.net/brucelgary/AstroPhotos/x.htm
____________________________________________________________________
This site opened: May 2, 2007. Last Update: May 2, 2007