
DETAILS OF T(Z) DURING ER911014 ENCOUNTER WITH CAT
This web page shows cycle-by-cycle T(z) "altitude temperature profiles" (ATPs) for a period surrounding the ER911014 CAT encounter. Each figure shows 10 ATPs, spanning 90 seconds. Figure 1 is an overview of the CAT event, showing a 1000-second period centered on the CAT encounter. The remaining figures show ATPs for the period 69.26 to 69.75 ks.
Figure 1. Overview of dT/dZ and CAT intensity.
Figure 2 starts with a compression phase becoming established, at 69.265 ks, and ends with the last of the compression phase profiles. Keep in mind that the following ATPs have altitude/temperature scales that are compressed in temperature, which is necessary for displaying several ATps in an offset manner, and that this scale compression necessarily "distorts" the slopes of T(z) features such that inversions and sub-adiabatic lapse rates are not as pronounced as in the displays having more typical scale choices. Also, the following ATP figures are meant for viewing with a screen resolution set to 1024x768, which will accommodate the full width of the graph in one view (so that horizontal scrolling is not required).
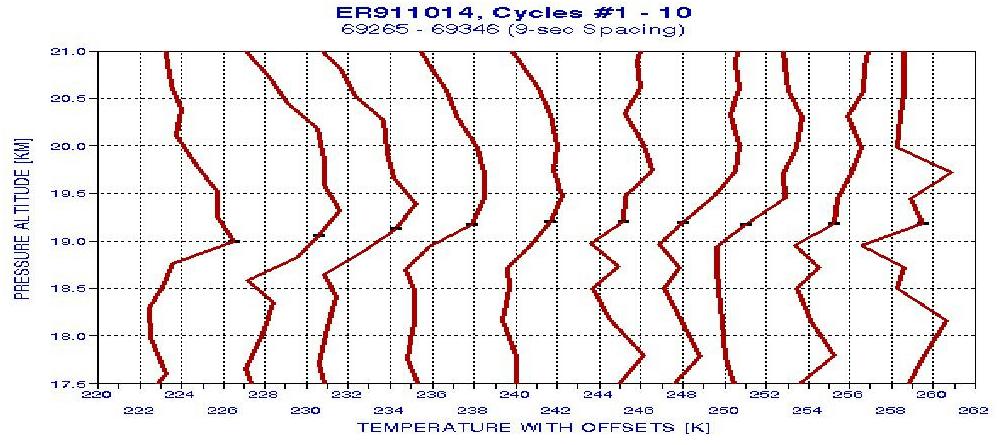
Figure 2. Altitude Temperature Profiles for the 90-second period corresponding to the compression phase prior to CAT. Each T(z) profile is offset from its predecessor by +4 K. The short horizontal ticks on each T(z) profile show ER-2 altitude.
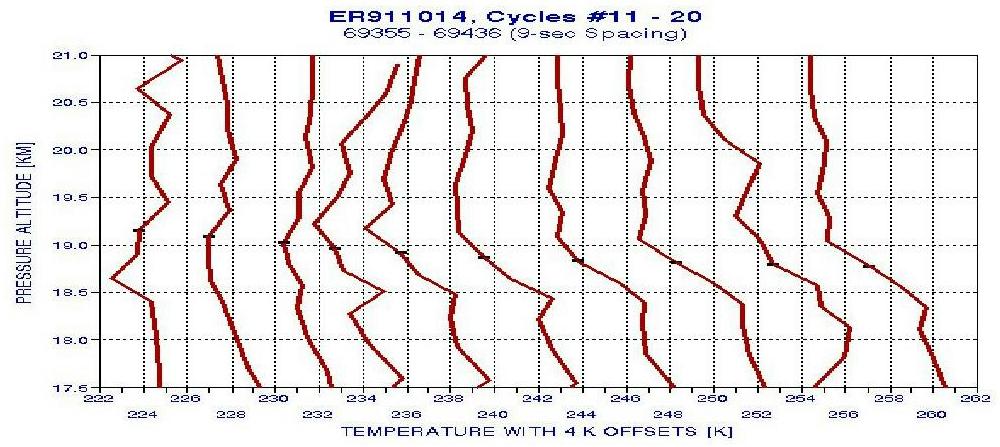
Figure 3. Altitude Temperature Profiles for the next 90-second period, corresponding to a slow transition from compression to sub-adiabatic. The first large CAT spike occurs during the last (right-most) T(z) profile.
This figure shows the transition from compression phase to sub-adiabatic dT/dZ accompanied by CAT. Cat actually begins to develope with the first ATP (on the left), and gradually rises in intensity to a peak corresponding with the last (right-most) ATP.
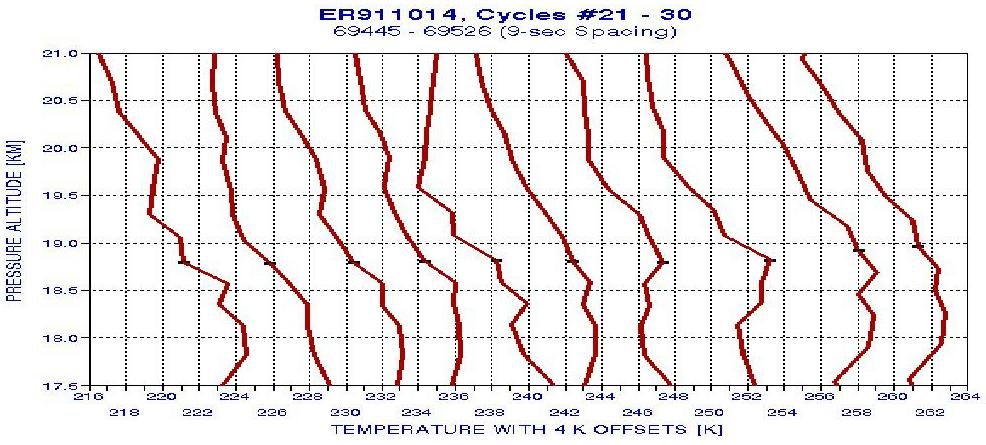
Figure 4. Altitude Temperature Profiles for the next 90-second period, corresponding to the middle portion of the CAT encounter.
This interval exhibits sub-adiabatic lapse rates for all but one ATP, and that one occurs at 69.50 ks, when CAT had subsided momentarily (refer to Fig. 1).
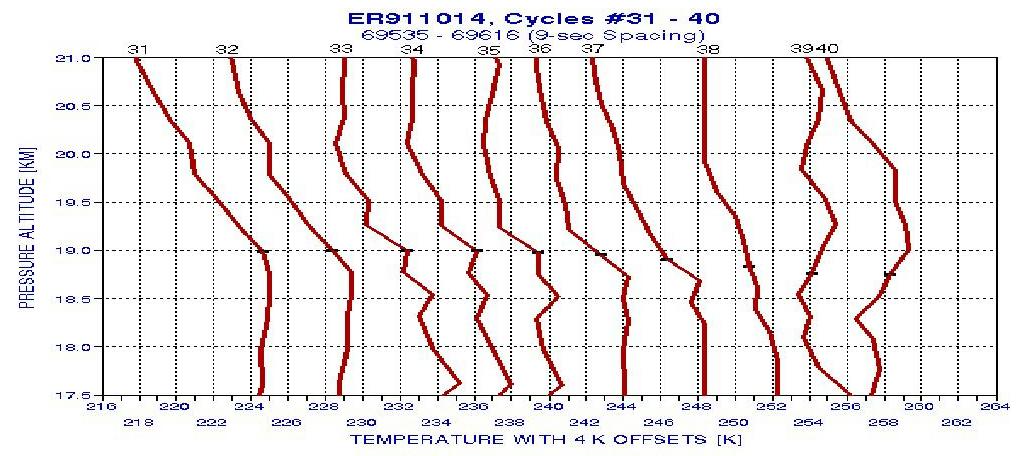
Figure 5. Altitude Temperature Profiles for the next 90-second period, corresponding to the end of the CAT encounter, and recovery of lapse rate to the pre-CAT "compressed" state (far right). Notice the profile number labels at the top of the figure.
In this sequence we see the "recovery" of lapse rate from its CAT associated sub-adiabatic values to the pre-CAT (and post-CAT) "compressed" values. The abrupt change from profile 38 to 39 corresponds to the time when CAT intensity subsides, as shown in the next figure.

Figure 6. A zoomed version of dT/dZ and ACC for the period encompassing the end of the CAT encounter, with individual data cycle lapse rate determinations labeled by their counterpart profile number.
The "pre-CAT compressed state" for profiles 39 and 40 is clearly shown to correlate perfectly with the susidence of turbulence in this figure.
This concludes the detailed display of T(z) profiles for the ER911014 encounter. The data files from which these profiles were plotted are available from the web master upon request.
Return to calling page
____________________________________________________________________
This site opened: September 23, 2000. Last Update: September 24, 2000