During a brief clearing, when EL = 25 deg, these 3 FOV measurements were made of r'-mag.
Results of an Observing
Campaign of 2004 BL86
Bruce L. Gary, Last Updated
2015.02.28, 02 UT
This web page
reports results of an amateur observing campaign of NEA
2004 BL86 during its close pass in late January, 2015. The
observations were requested by Dr. Vishnu Reddy, of the
Planetary Science Institute in Tucson, and coordinated by
B. Gary.
Links on this web page
Overview
of results
Observers
Overview of
observational situation
Day#1 observations (Jan 26)
Day#2 observations (Jan 27)
Day#3 observations (Jan 28)
Day#4 observations (Jan 29)
Day#8 observations (Feb 02)
Observing campaign
status (another web page)
| Day# & UT Date |
Observer, Telescope, Filter |
UT range |
Phase Angle |
Mag |
| Day #1, Jan 26 |
B. Gary, 14", dome, g'r'i' |
06.8 - 07.3 |
53.5 - 52.8 |
10.7 - 10.6 |
| " |
Y. Ogmen, 14", dome, V |
18.2 - 22.8 |
25.5 - 12.7 |
10.0 - 9.7 |
| " |
J. Gregorio, 12", SRO, V |
23.0 - 24.8 |
12.7 - 08.0 |
9.7 - 9.6 |
| Day #2, Jan 27 | B. Gary, 14", dome, g'(r'i') |
05.2 - 10.0 |
02.0 - 09.6 |
9.1 - 9.7 |
| " |
B. Gary, 14", dome, SA-100 |
07.0 - 08.4 |
04.7 - 06.9 |
9.3 - 9.5 |
| " |
T. Kaye, 5", dome, Cb | 05.9 - 10.2 |
03.0 - 09.8 |
9.2 - 9.7 |
| " |
J. Garlitz, 12", dome, G |
04.2 - 07.5 |
01.5 - 05.5 |
9.0 - 9.4 |
| Day #3, Jan 28 |
B. Gary, 14", dome, SA-100 |
04.0 - 06.2 |
28.8 - 30.3 |
11.2 - 11.4 |
| " |
T. Kaye, 5", dome, Cb |
04.5 - 06.0 |
28.9 - 30.2 |
11.2 - 11.4 |
| Day #4, Jan 28 |
P. Benni, 11", open, R |
00.4 - 11.1 |
38.2 - 41.3 |
12.3 - 12.7 |
| Day #9, Feb 02 |
B. Gary, 14", dome, C |
03.8 - 09.3 |
49.5 - 49.6 |
14.7 - 14.9 |
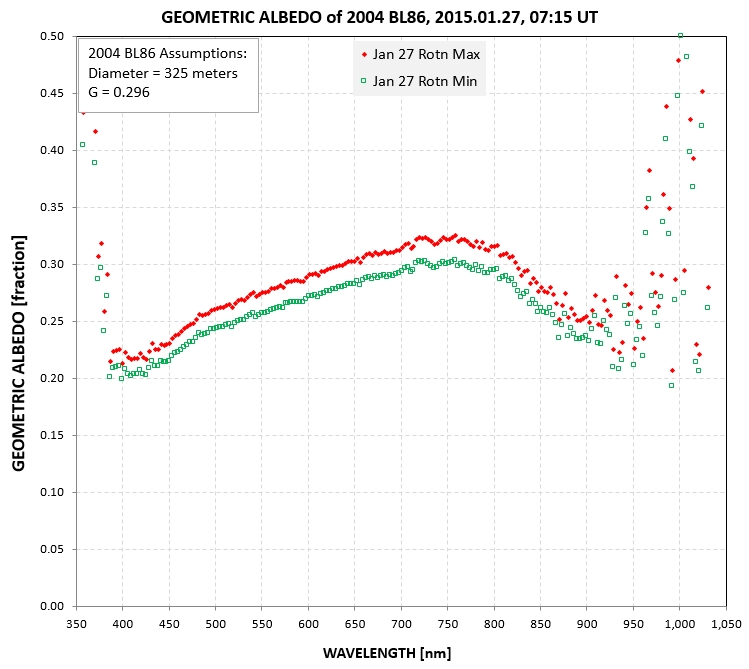
A [%] = 100 × (Fa /
Fs) × [(r [au] × d [km])/(Ra [km])]2
where Fa = flux of the asteroid scaled to 1 a.u., Fs = flux of the
sun at 1 a.u., r = distance of the asteroid from the sun in a.u.,
d = distance of the asteroid in km, and Ra is radius of the
asteroid in km. Since flux appears as a ratio in this equation it
doesn't matter which units are used (W/m2/micron or
watts/m2), provided they're the same. Albedo was then
converted to geometric albedo, the albedo that would be measured
if viewing geometry permitted a measurement at zero phase angle,
using G = 0.296 ± 0.001. The resulting geometric albedo spectrum
is shown by the green open squares in the next graph.
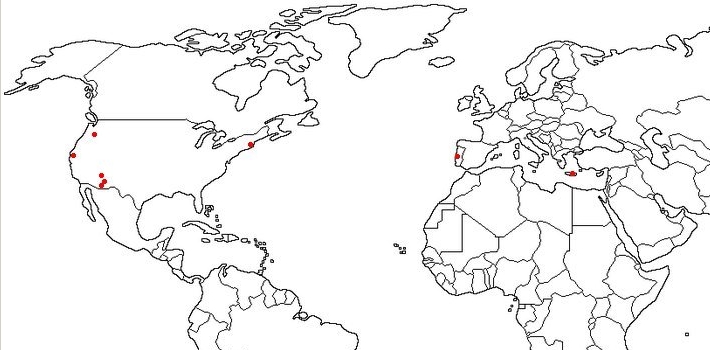
The following observers contributed to this observing campaign.
All are amateurs except for Dr. Vishnu Reddy and Dr. Karsten
Schindler.
Yenal Ogmen, Cyprus, 14"(V)
Joao Gregorio, Portugal, 12"(V)
Paul Benni, Massachussets, 11"(R) & telephoto
Tom Kaye, Arizona, 5"(Cb) & 32"(SA-100)
Bruce Gary, Arizona, 14"(g'r'i', C, SA-100)
Vishnu Reddy, Arizona, 2-meter IRTF (Mauna Kea)
Joe Garlitz, Oregon, 12"(G)
Karsten Schindler, California, telephoto lens with FLI CCD
Overview of Observational
Situation
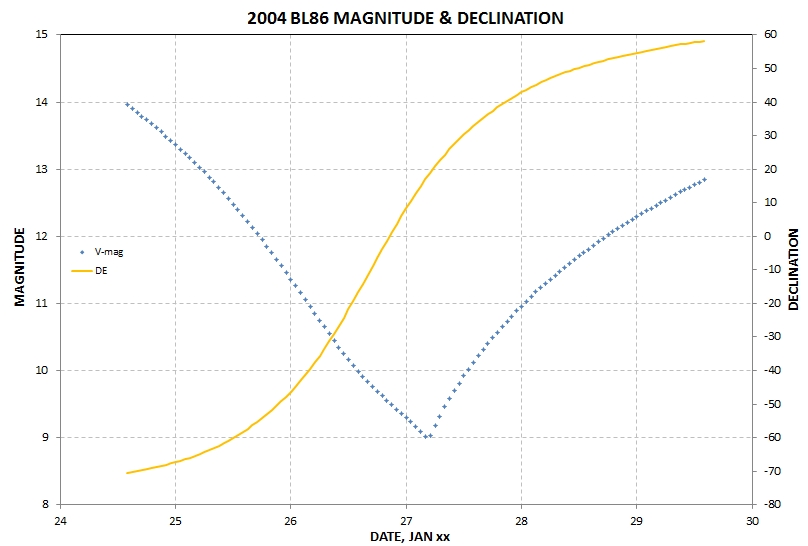
BL86, as I will refer to it,
is fast-moving and bright. It was observed by amateurs for
over a week, but there were ~ 4 days where phase angle changes
made observing most important. These are UT dates Jan 26 to
Jan 29. I will refer to observing dates as Day#1 = Jan 25/26,
etc. Here's an overview graph of predicted magnitude and
declination (DE):
Observations were obtained by T, Kaye (0.5 hr, 5",
Cb filter), B. Gary (0.5 hr, 14", g'r'i' filters), J. Garlitz (0.5
hr, 12", G filter), Y. Ogmen (4.5 hrs, 14", V filter) and J.
Gregorio (1.9 hrs, 12", V filter). Opposition (smallest phase
angle) and brightness maximum occurred at 4.5 UT on the following
date (Jan 27).
The T. Kaye observations with a 5" telescope have
not been processed, partly because the SNR is expected to be much
lower than the simultaneous observations by B. Gary with a 14"
telescope. Both observatories (located a few miles from each
other) were under cirrus overcast except for a brief 1/2 hour
clearing.
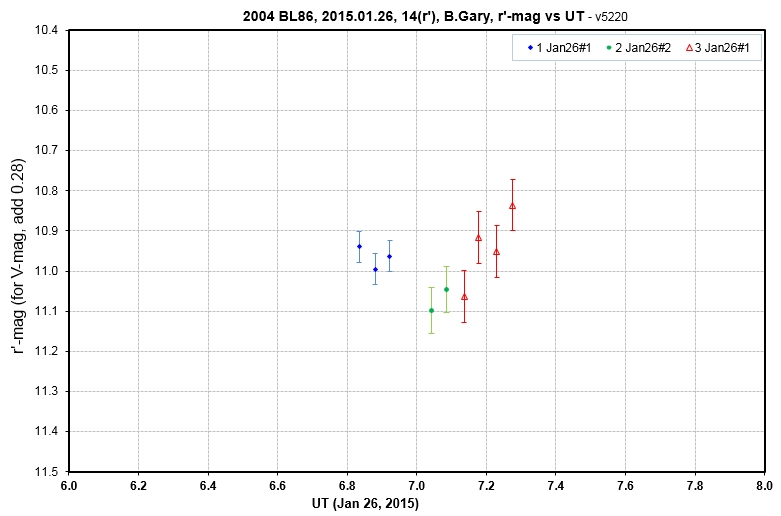
B. Gary obtained the following brief LC:
During a brief clearing, when EL = 25 deg, these 3 FOV
measurements were made of r'-mag.
The above measurements may be the first obtained by
a northern hemisphere observer. They are part of a 3 filter
observation (g', r' and i') of 3 FOV positions. The average g'-r'
color was measured to be 0.83 ± 0.10 at an air mass of 2.35 (on JD
20457048.8). The rotation phase for 07.0 UT is (using the rotation
phase equation: phase = 24 * (JD4 - 7050.5292) / 2.620, adopted
for the observations reported on
_______________________________________________________________________________________________________
The J. Garlitz G-band observations were made under poor sky conditions, with very poor atmospheric seeing, and they are not shown here. _______________________________________________________________________________________________________
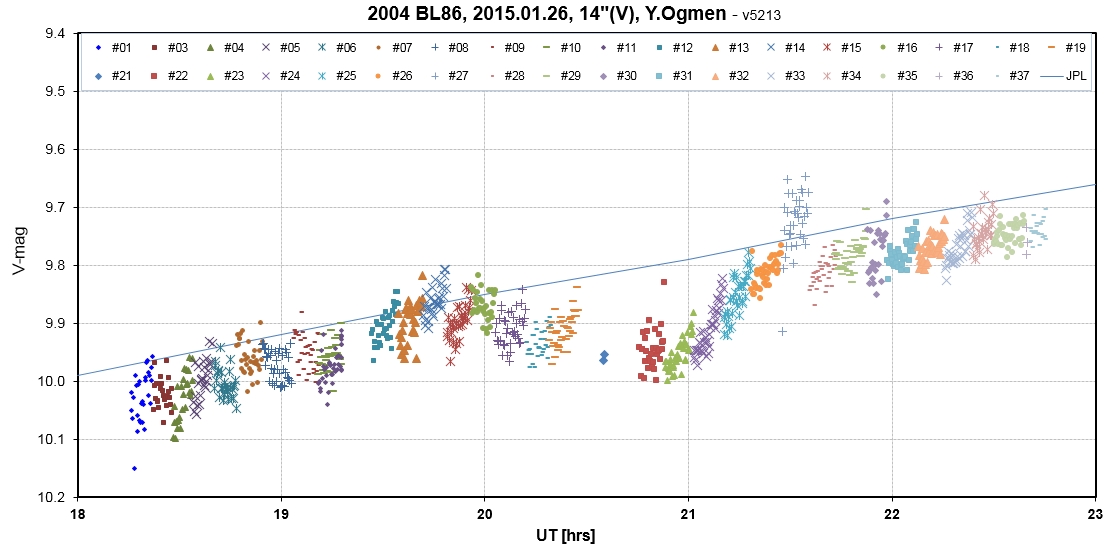
Y. Ogmen observed 37 FOVs with a V filter. APASS
V-mags for 3 or 4 background stars in each FOV were used to
calibrate each FOV. Internal consistency between reference stars
was used to identify outliers, and the remaining stars were then
used to re-calibrate the FOV. The LC below is probably the first
by a northern hemisphere observer.
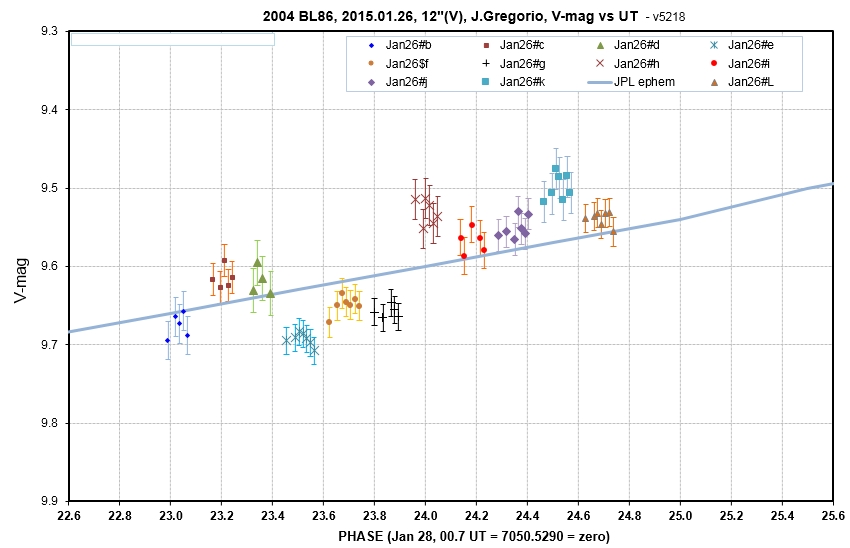
J. Gregorio obtained 11 FOVs with a 12" using a V
filter, from 22.99 to 24.74 UT, when BL86 was approaching
opposition (at 4.5 UT, Jan 27), and was therefore experiencing
almost a full amount of "opposition effect." A total of 166
background stars were used for reference (avg of 15 per FOV), with
APASS Vg'r' magnitude readings (using C2A) to establish a "star
color sensitivity" relationship for this telescope system. A BL86
g'-r' star color of +0.607 was adopted for mag offset adjustment.
In spite of these precautions there is an unexplained "scatter" of
FOV-average V-mag that implies the presence of a FOV systematic SE
of typically 20 mmag. Image processing is mostly done; below are
plots of V-mag vs UT and a provisional plot of V-mag adjusted to a
standard UT vs rotation phase (with an adopted model for G=0.15).
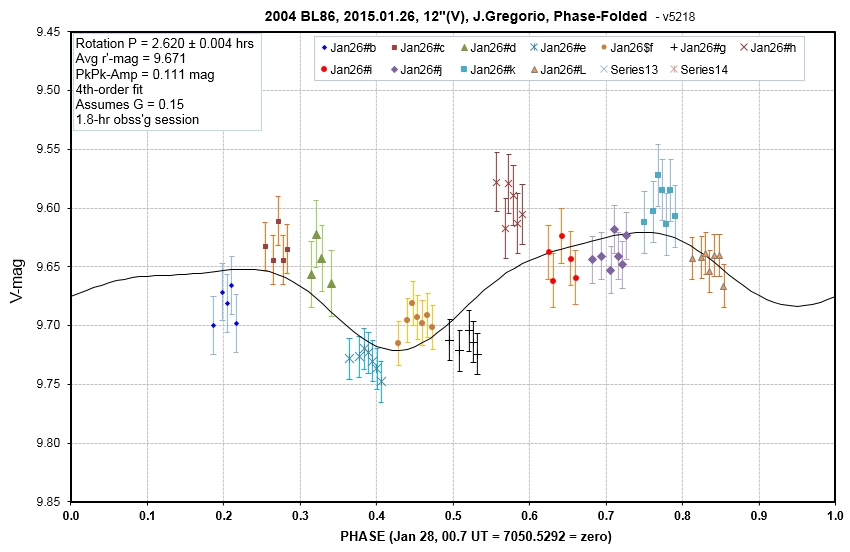
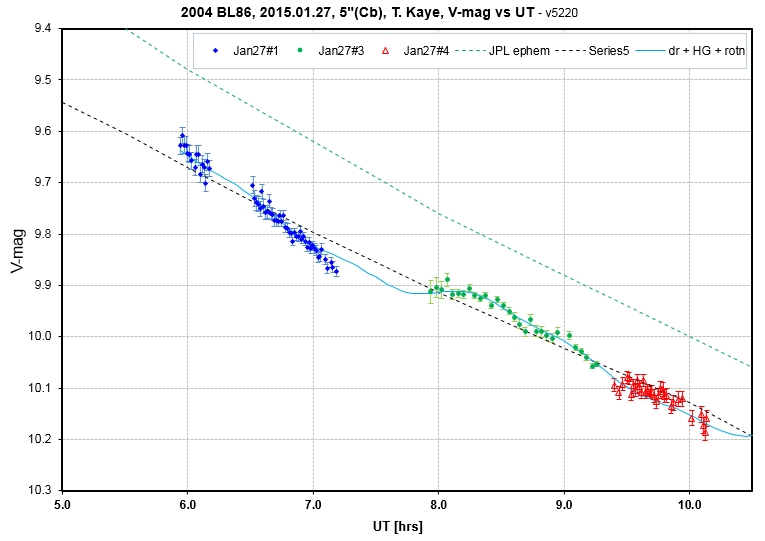
The above graph doesn't represent changes in phase function during the UT range for the observations. The only way to properly solve for V-mag measurements is to plot V-mag vs UT is to include all 3 components of variation in the model used for fitting: changing distance, changing phase effect and variation due to rotation. The following graph illustrates this:
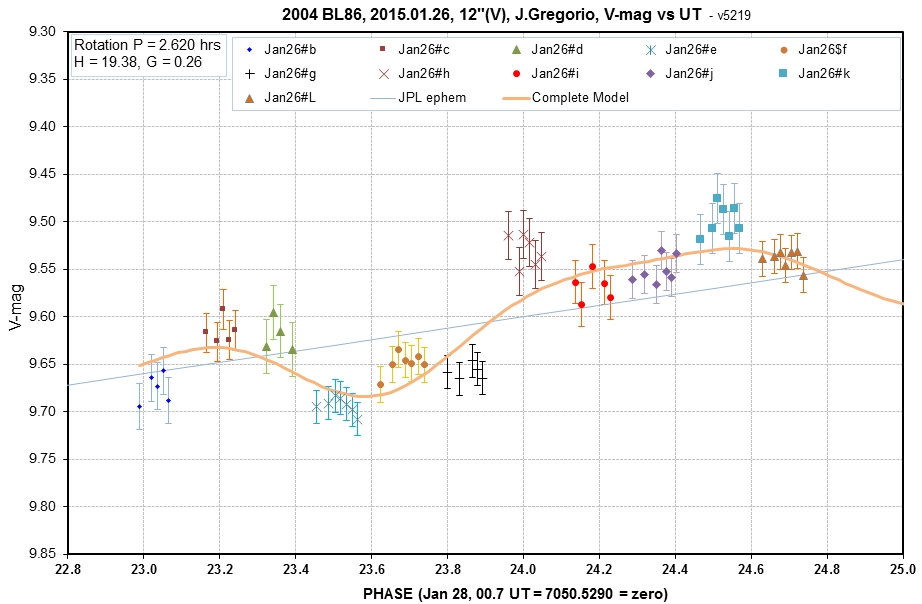
V-mag vs UT with a model fit that includes all 3 components of
variation (distance, phase effect and rotation).
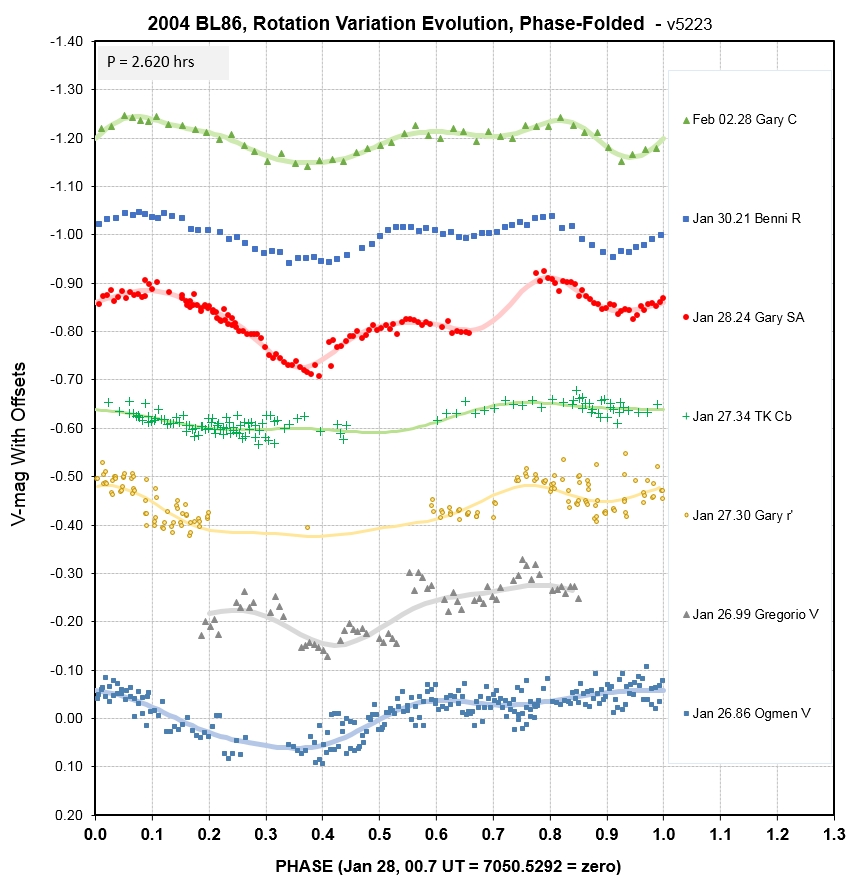
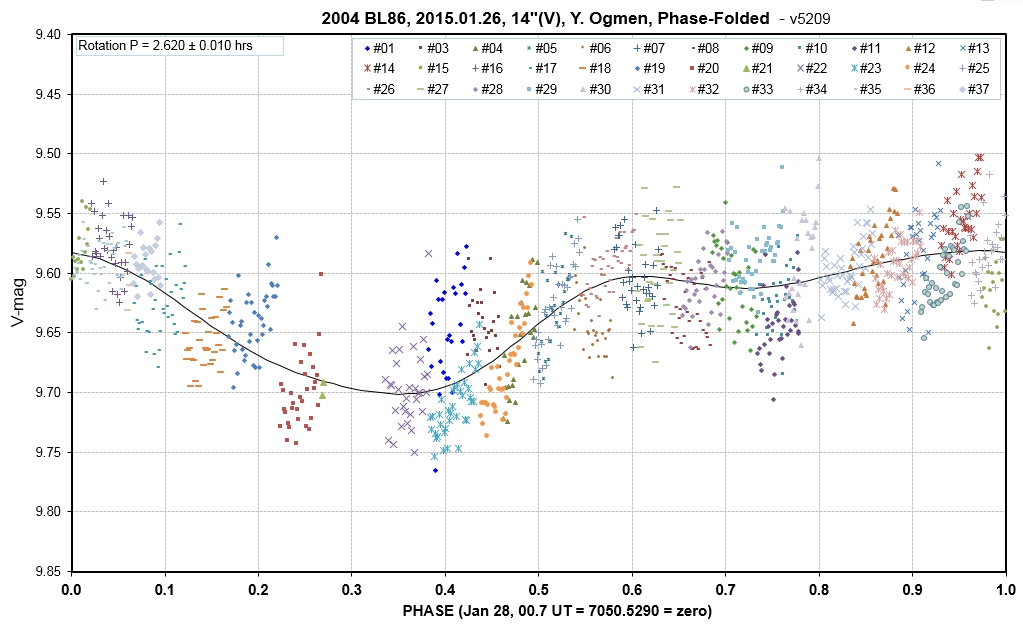
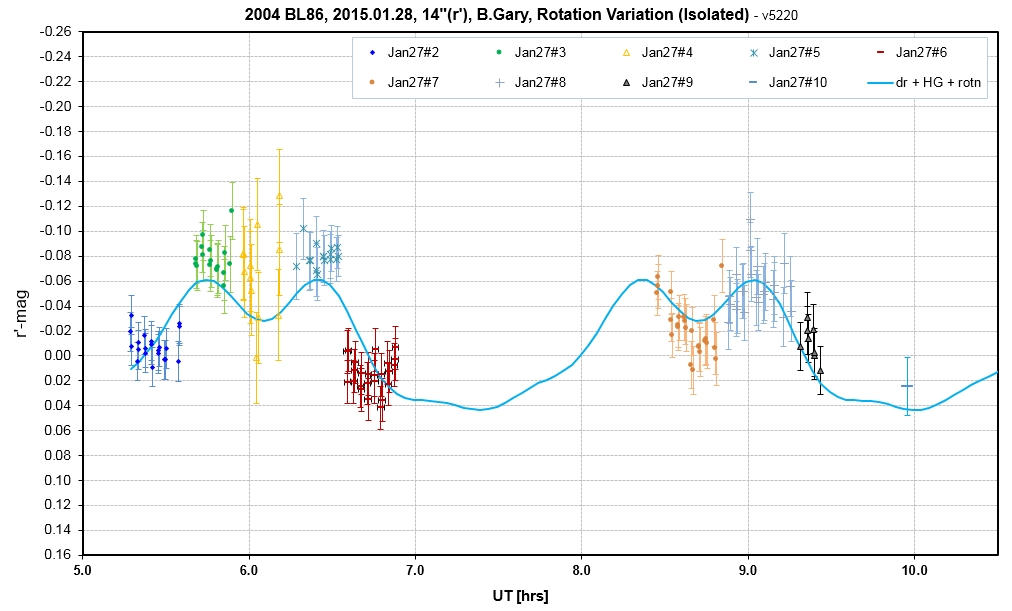
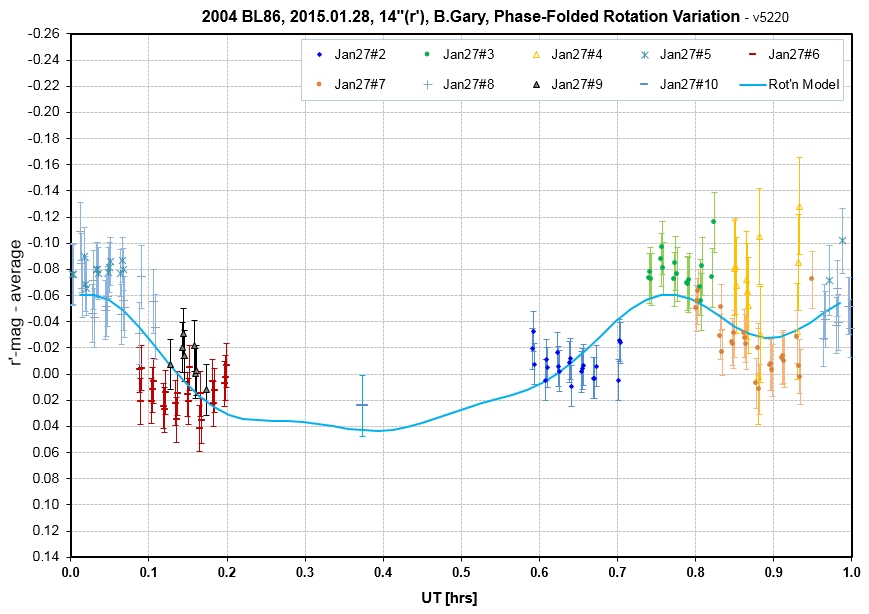
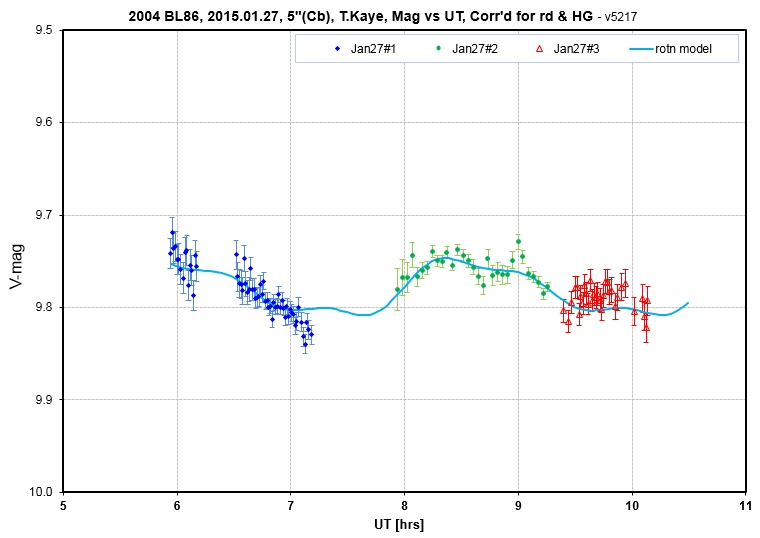
When this is done then the component due only to
rotation can be plotted vs. phase, as illustrated in the following
graph:
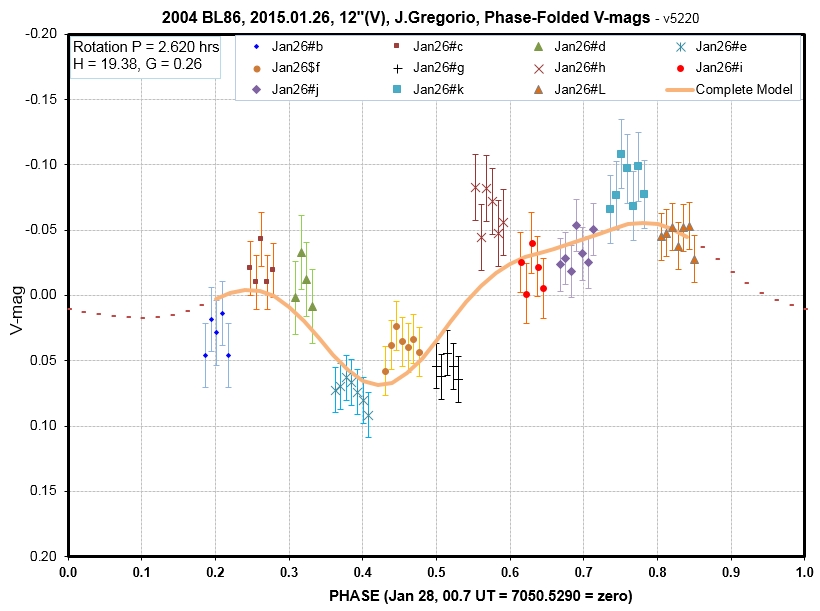
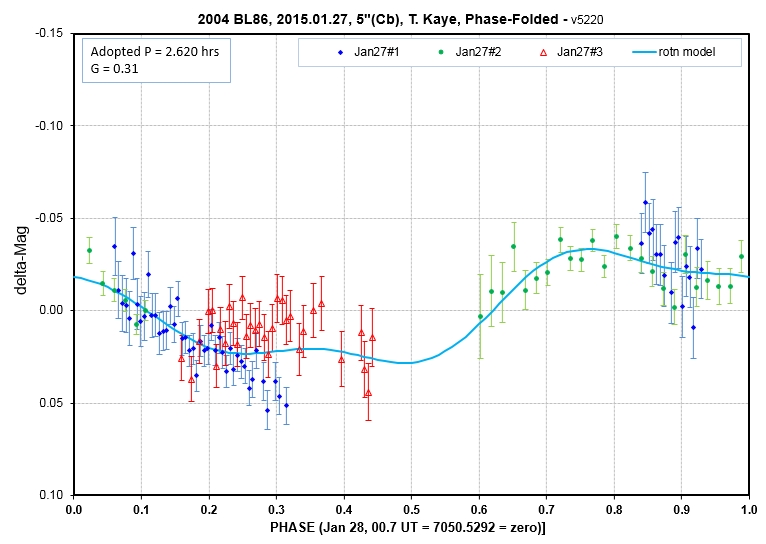
The above graph lacks measurements near zero phase,
so unfortunately none of this data can be used for the phase
effect analysis.
Observations by J. Gregorio that began on Jan 26, 23
UT, extended to Jan 27, 01 UT (described above). T, Kaye (4.5 hrs,
Cb filter), B. Gary (2.0 hr, g'r'i' filters plus 3.0 hrs, SA-100
transmission grating) and J. Garlitz (3.3 hr, G filter). This is
the date of closest approach, smallest phase angle and maximum
brightness (4.5 UT); it is a time when Earth-asteroid distance, d
[a.u.], and phase angle, were changing fast. Therefore brightness
was changing rapidly due to 1) changing Earth/asteroid distance,
2) changes due to phase effect (as modeled by HG), and 3) rotation
variation. Because of these simultaneous changes the usual method
of phase-folding to obtain a rotation LC was unreliable; instead,
it was necessary to create a model for brightness vs. UT and model
fit measurements with this model, allowing all model parameters to
be solved for simultaneously. This was a new processing challenge
for me, which required some floundering before I realized such an
approach was necessary.
______________________________________________________________________________________
The J. Gregorio observations that extended ~ 1 hour into this date are described in the previous section. ______________________________________________________________________________________
B. Gary began g'r'i' observations with a 14" telescope with a HyperStar prime focus lens at 02 UT, when EL = 12.5 deg; but these data were of poor quality due to high air mass and intermittent cirrus. A clearng began at 05.2 UT, and g'r'i' observations resumed. At ~ 07 UT SA-100 observations began, alternating between BL86 and 3 sun-like calibration stars. At 08.3 UT observations returned to the g'r'i' mode. The return of clouds ended observing at 09.5 UT. All r' and some of the g' & i' have been processed. Some of the SA-100 observations have been processed. The next set of graphs illustrate the complicated nature of analysis of the Day#2 measurements.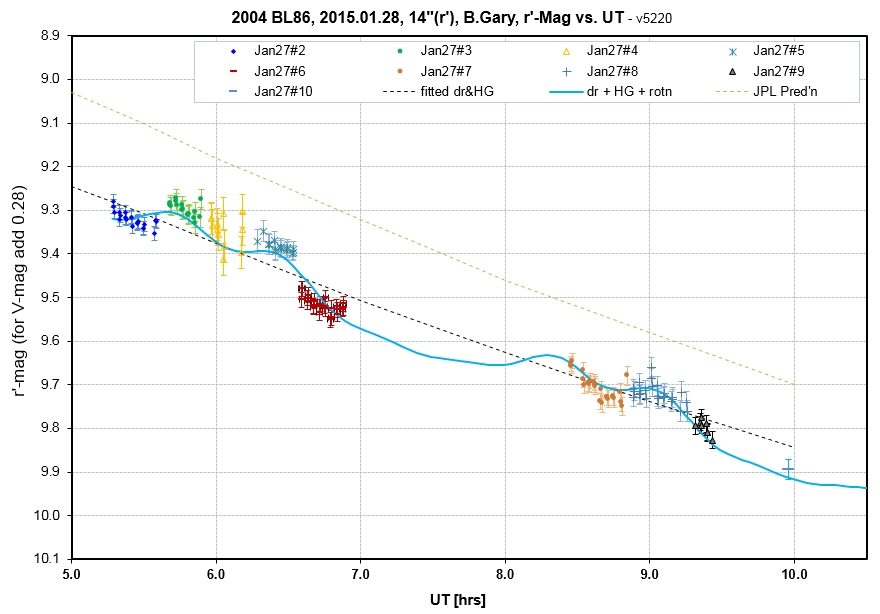
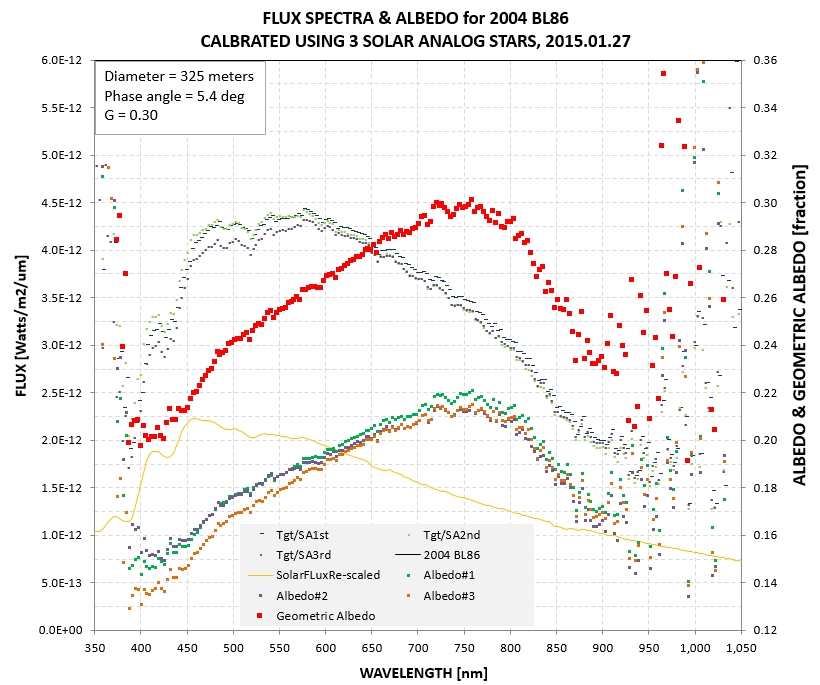
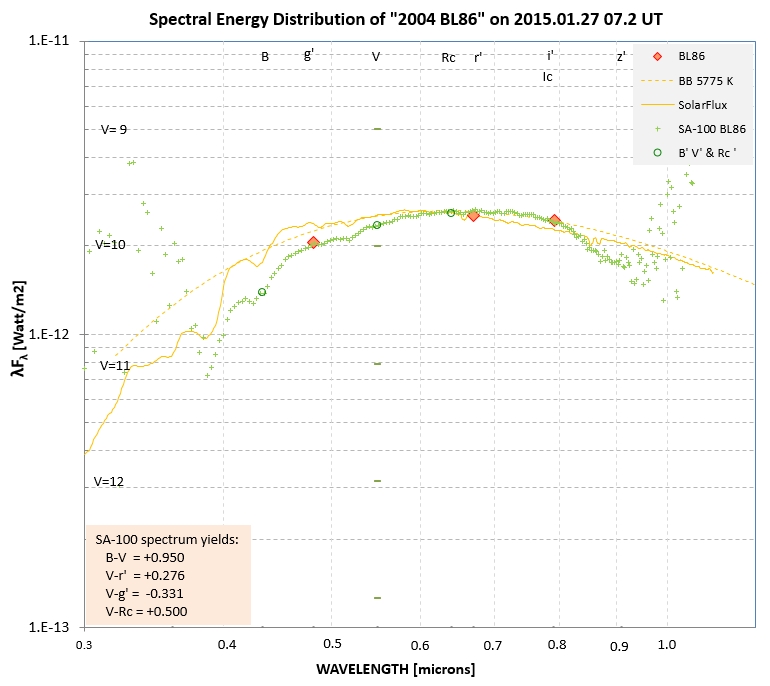
The SA-100 measurements were calibrated using the
solar analog stars at 08:47:07 +28:9:43 (G2IV, V = 6.61),
08:51:01 +15:21:02 (G1V, V = 6.39) and 09:48:35 +46:01:15 (G0.5Va,
V = 5.12). The observing sequence was the usual one for minimizing
atmospheric extinction trends: star1, BL86, star2, BL86, star3.
The air mass values were all < 1.05. The average BL86
measurement was when phase angle = 5.4 degrees. An adjustment to
zero p hase angle using G = 0.30 was made. Based on the internal
consistency of the 3 calibration stars it is estimated that the
relative uncertainty was <3% between 450 nm and 900 nm. This
uncertainty is much greater than the uncertainty associated with
G, so when a geometric albedo is given as 30.0% it is uncertain by
~ 1%. For example, at 750 nm geometric albedo Ag = 30 ± 1 %. A
diameter of 325 meters, based on preliminary radar results
(Benner, 2015), was adopted; this may actually be a larger source
of uncertainty for Ag than those associated with the SA-100
observations.
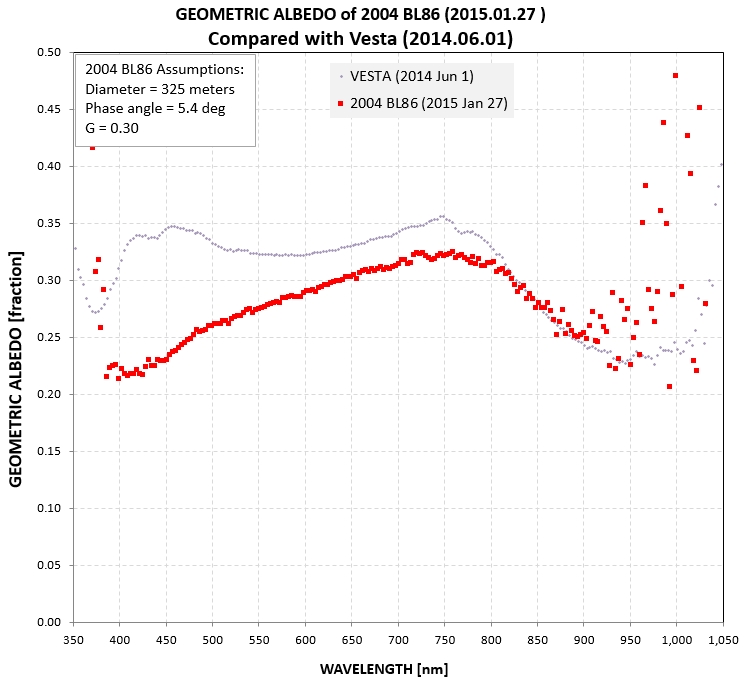
BL86 and Vesta are both high albedo asteroids, and
they both exhibit the Band I absorption feature at ~ 920 nm. BL86
is redder than Vesta.
J. Garlitz observations were made with a 12"
telescope with a G filter from 04 to 07.5 UT. Processing
continues. So far, we have V-mag = 9.46 ± 0.02 at 04.25 UT, plus
some lower quality V-mag's afterwards. Below is a plot of
G-band and C-band data, calibrated with stars APASS V-band.
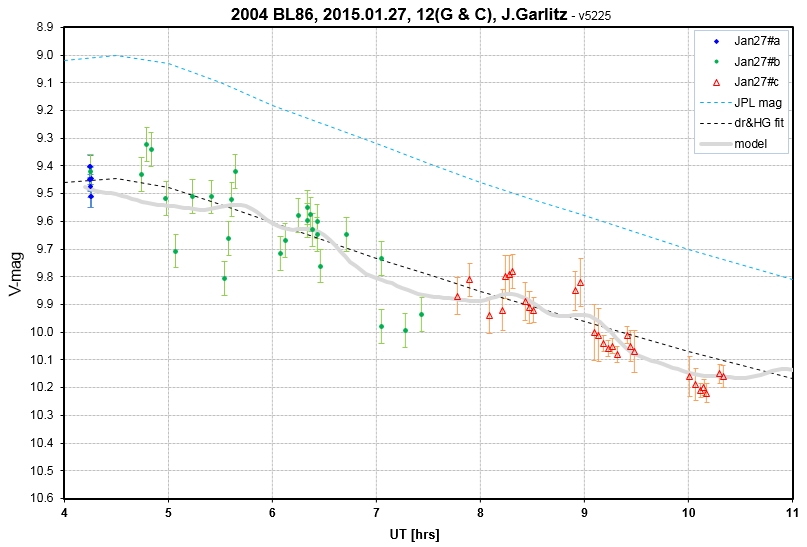
J. Garlitz light curve for 6.2-hours of observations, beginning
with G filter (up to 7.5 UT) and continuing with clear filter.
The wavy gray trace is the same model determined from B.
Gary r'-band observations made at the same time.
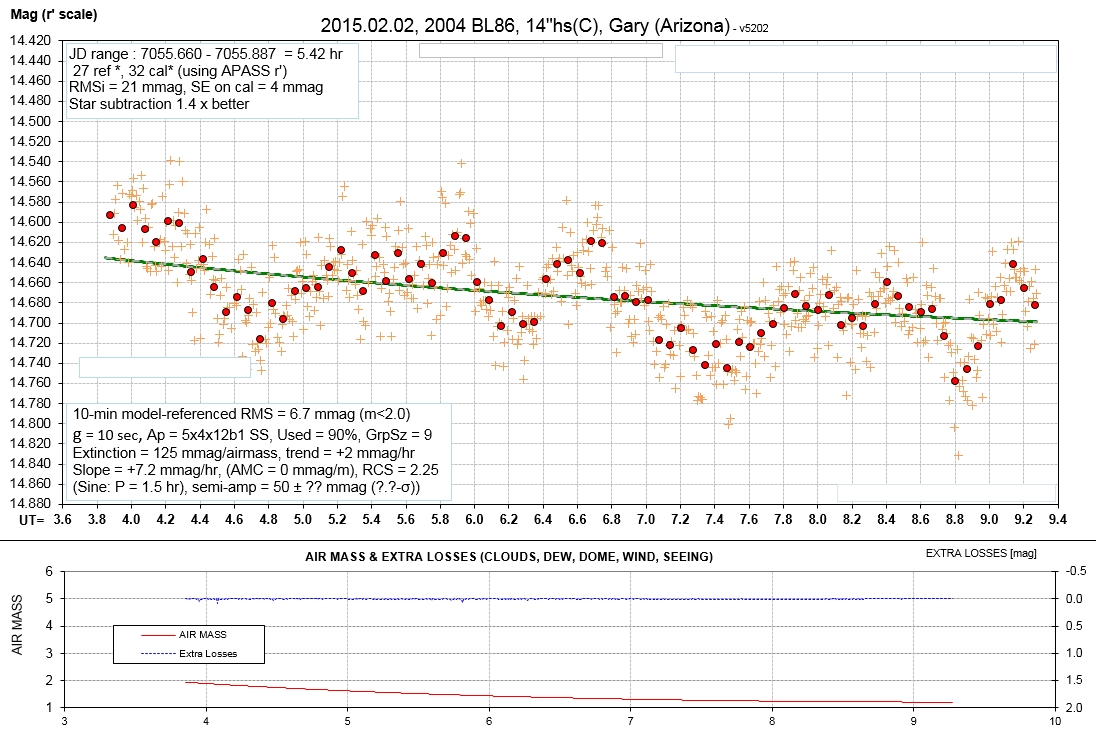
B. Gary observed with the SA-100 for 3.5
hours on this date. The zero-order images of BL86 were
processed as if they were unfiltered, and this risky procedure
led to the following phase-folded LC.
![]()
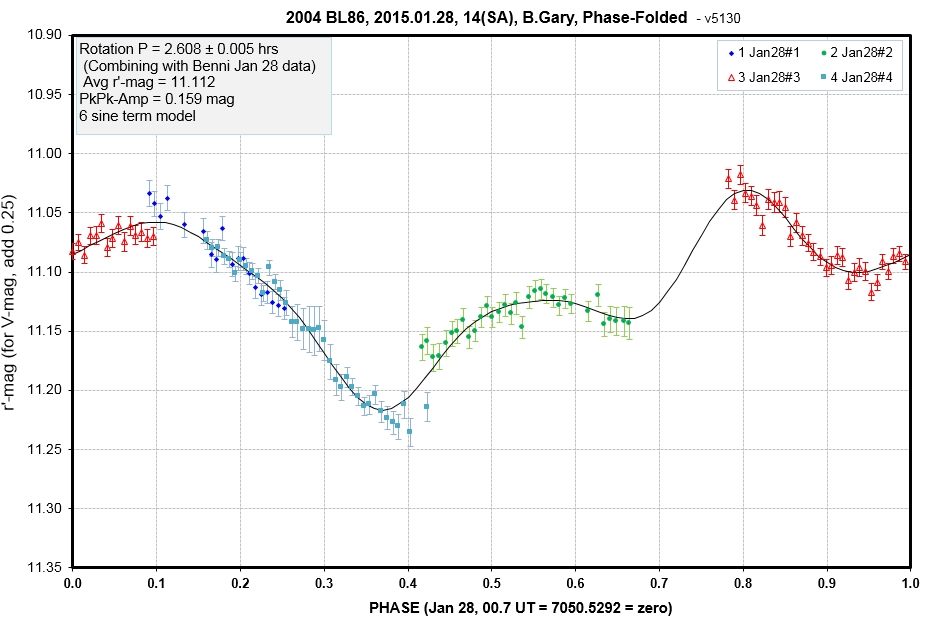
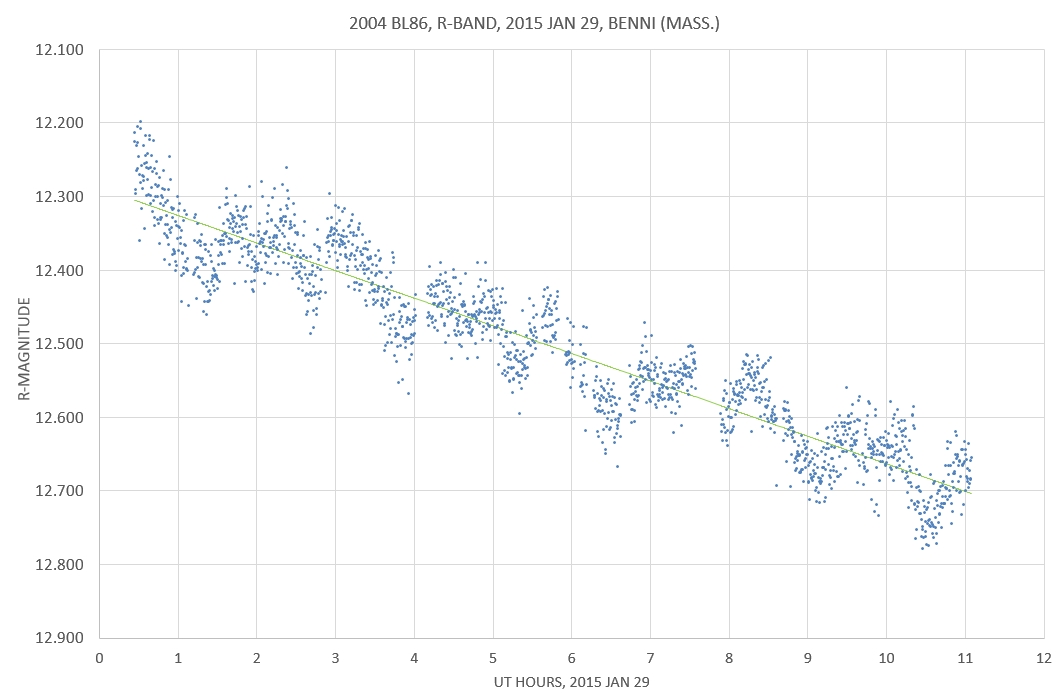
P. Benni "dug out" from a snowstorm to
observe for ~ 11 hours with a 11" Celestron and R filter.
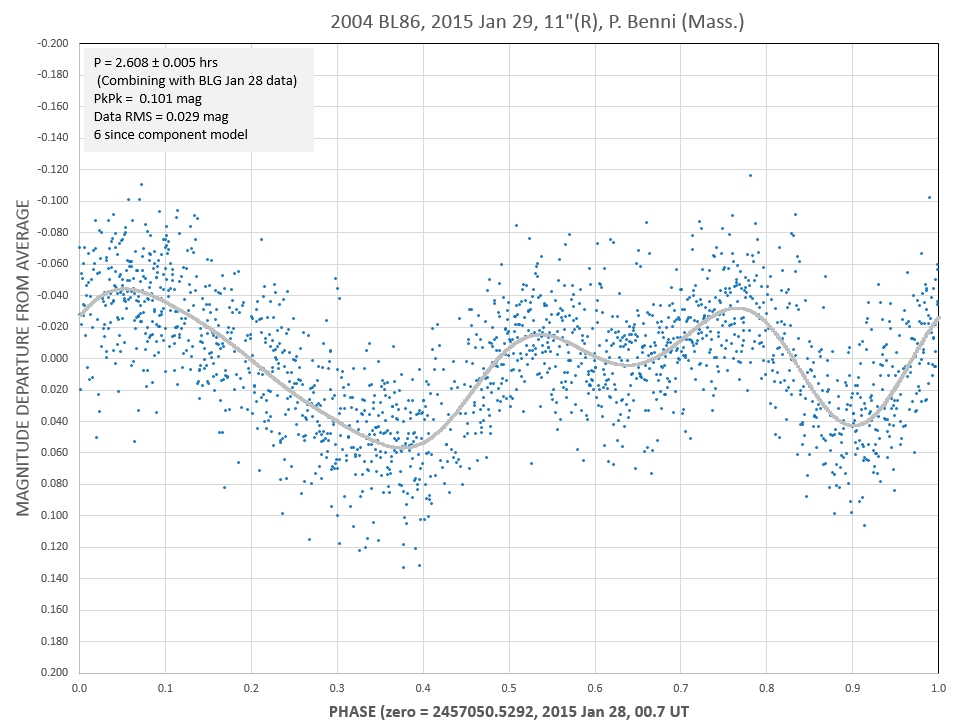
Same data after removing effect of changing Earth/asteroid
distance and phase-folding.
P.
Benni's Jan 29 data has residuals off the 2.608-hr
rotation model that exhibit a 3.08-hr variation, with
semisamplitude 5.5 mmag, as shown by the graph
below. THis might be due to the rotation of the
smaller of the binary components. So far we haven't seen
any "mutual events" (transits, eclipses or shadow
fadings), so apparently the binary orbit spin axis
wasn't oriented in a favorable way for such events to be
seen from Earth at our observing times.
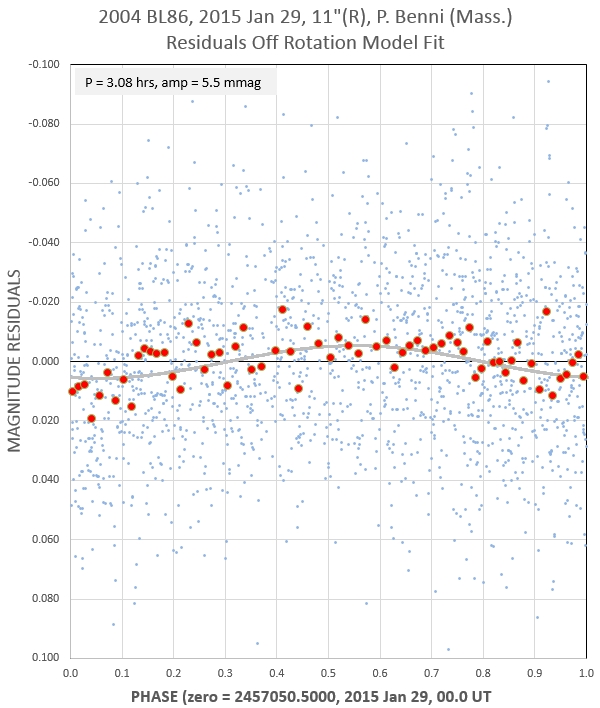
Residuals off the previous fit can be used to search
for an additional variation caused by rotation of the
secondary.
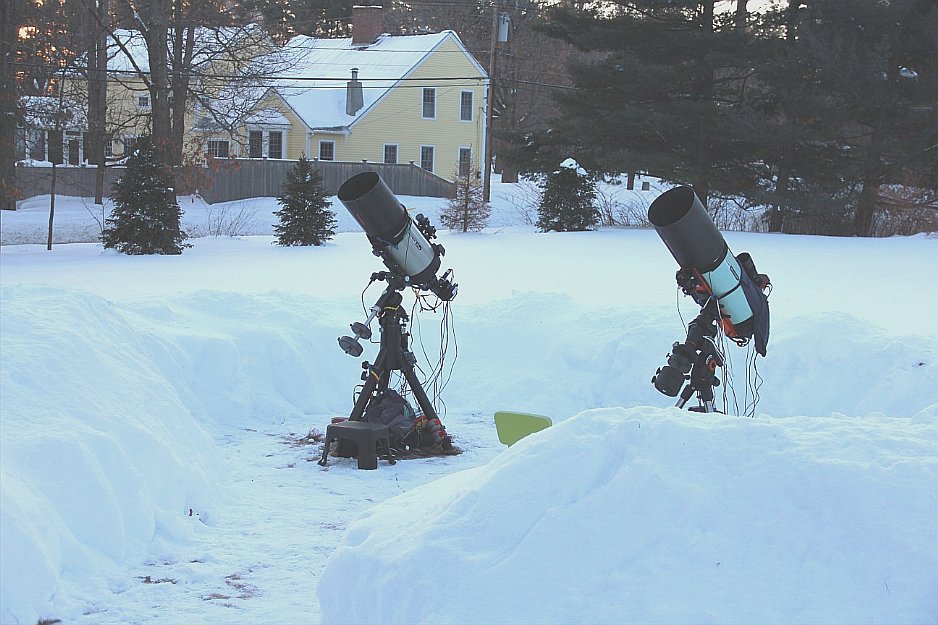
P. Benni's set-up during the Jan 29 observations, after digging
out from a 30-inch snowstorm. On left is a Celestron
RASA 11" f/2.2, with an SBIG ST-8300M CDD, providing a 1.67x1.26
deg FOV with 1.8 "arc/pixel resolution. This is the telescope
used for the BL86 observations.
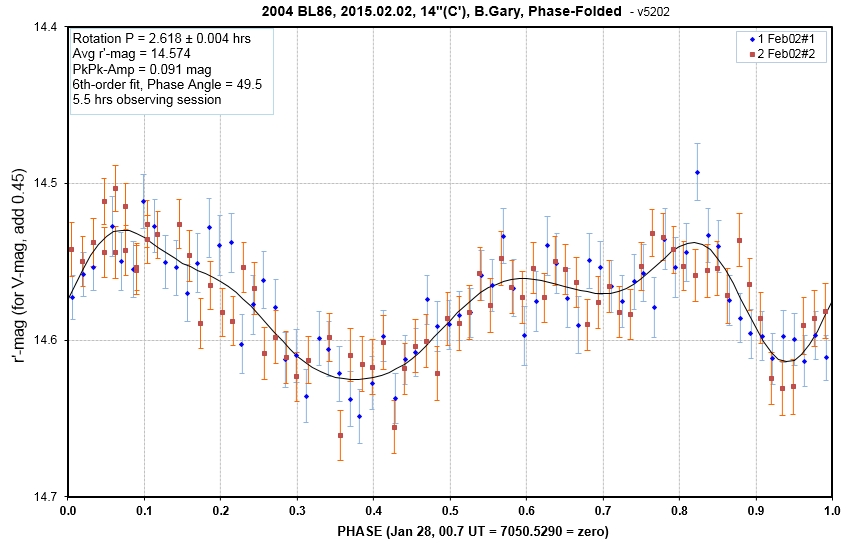
B.Gary
observed for 5.5 hrs (2 rotations), and obtained a
phase-folded LC that matches the other ones. This means
that BL86 is not a "tumbler."
This site was opened 2015.02.13. Nothing on this
web page is copyrighted. BGary web sites