XO-1
AXA Light Curves & Finder Charts &
All-Sky Photometry Results
Links internal to this web page:
Comments
Basic data
LC only
(not included in plots)
TTV
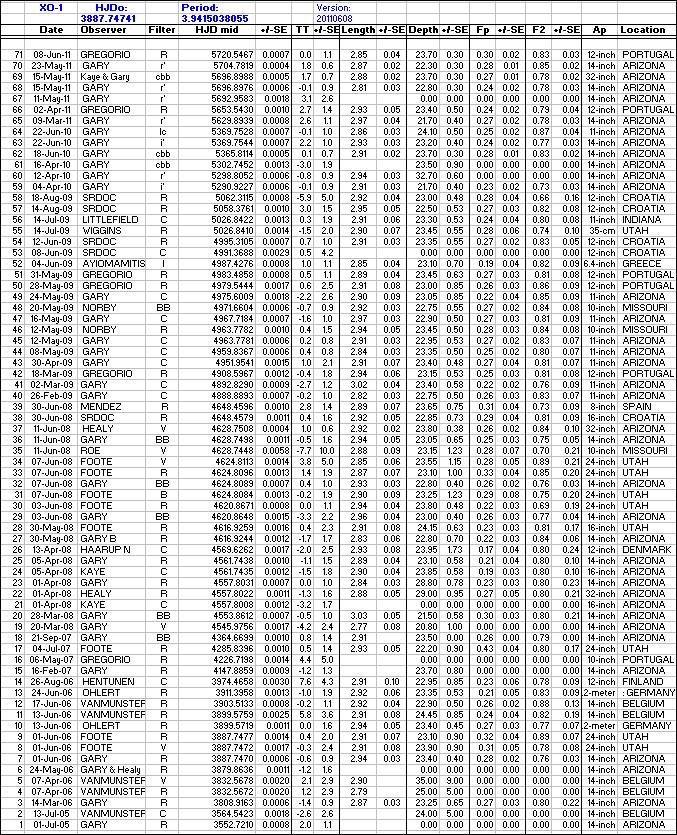
Transit Table & Parameter Plots
Transit LCs - Amateur
Transit LCs - Professional
OOT LCs
All-sky photometry
Finder images
Refrences
Comments
Mid-transit times exhibit a sinusoidal variation with a
peak-to-peak amplitude of 1.5 +/- 0.7 minutes. If this is real it would
imply the presence of another exoplanet in the system, XO-1c. Since the
period of these variations is close to a year (350 days) no one will
believe this "signal" until it is confirmed by an independent analysis.
One-year "signals" in astronomy are notorious for being wrong! I can't
see how my JD to HJD for this object could be wrong when no other exoplanet
shows a one-year sinusoidal variation. I currently don't believe there's
evidence in this data set for supporting the presence of a real TTV.
Professional astronomer Burke et al (2010) have a preprint
(http://fr.arxiv.org/abs/1004.4252)
that doesn't find convincing evidence for a sinusoidal variation.
Basic data - Updated 2009.08.16
RA = 16:02:11.6, Decl = +28:10:11
Season = May 26
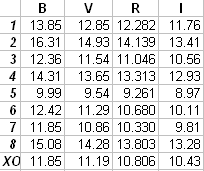
B = 11.85 ±
0.025, V = 11.19 ± 0.035, Rc = 10.81 ± 0.030, Ic = 10.43
± 0.040, B-V = 0.66 ±
0.05 (B. Gary, all-sky)
HJDo = 3808.9170 & P = 3.941534 day (discovery paper)
HJDo = 3887.74679 & P = 3.941534 (27) day (Schneider listing in Extrasolar Planets Encyclopaedia,
based on Wilson et al, 2006)
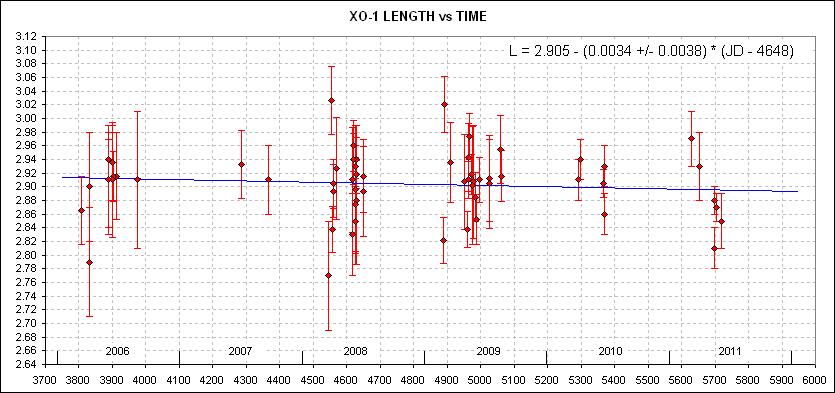
HJDo = 3887.7474 & P = 3.9415038
(72) day (AXA sinusoidal data fit, below, v20110312)
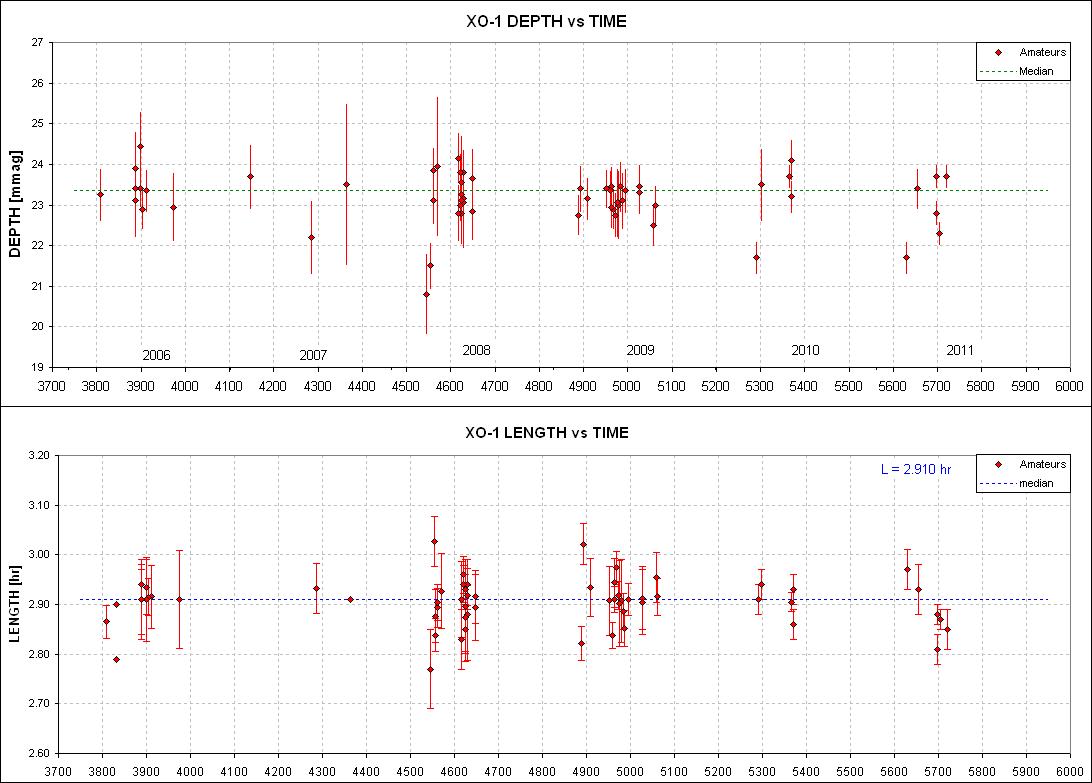
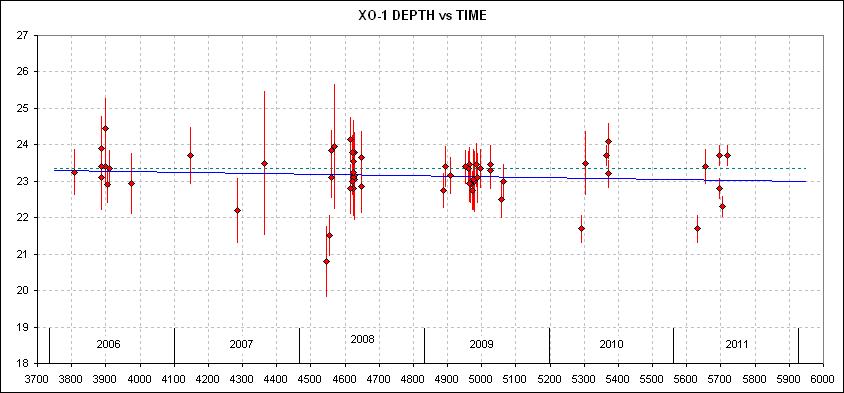
Depth = 23.21 ± 0.15 mmag (mostly BVRIC-band)
Length = 2.910 ±
0.015 hr (mostly BVRIC-band)
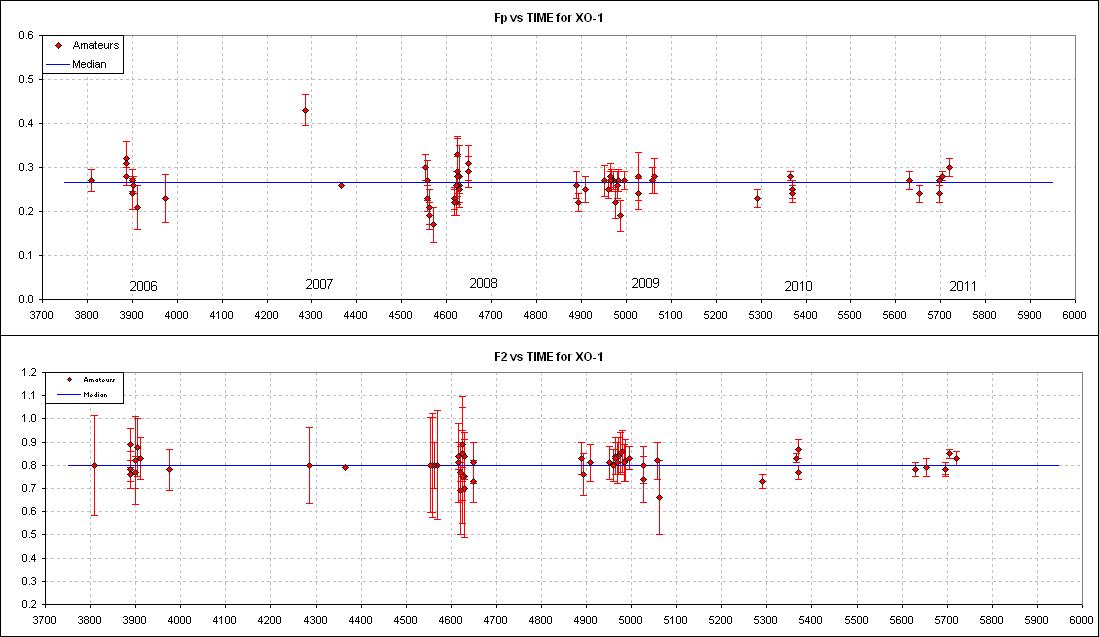
Fp (fraction of time in partial transit) = 0.26 ±
0.01
F2 (relative depth at contact #2) = 0.80 ±
0.02
TTV - Updated 2009.08.16
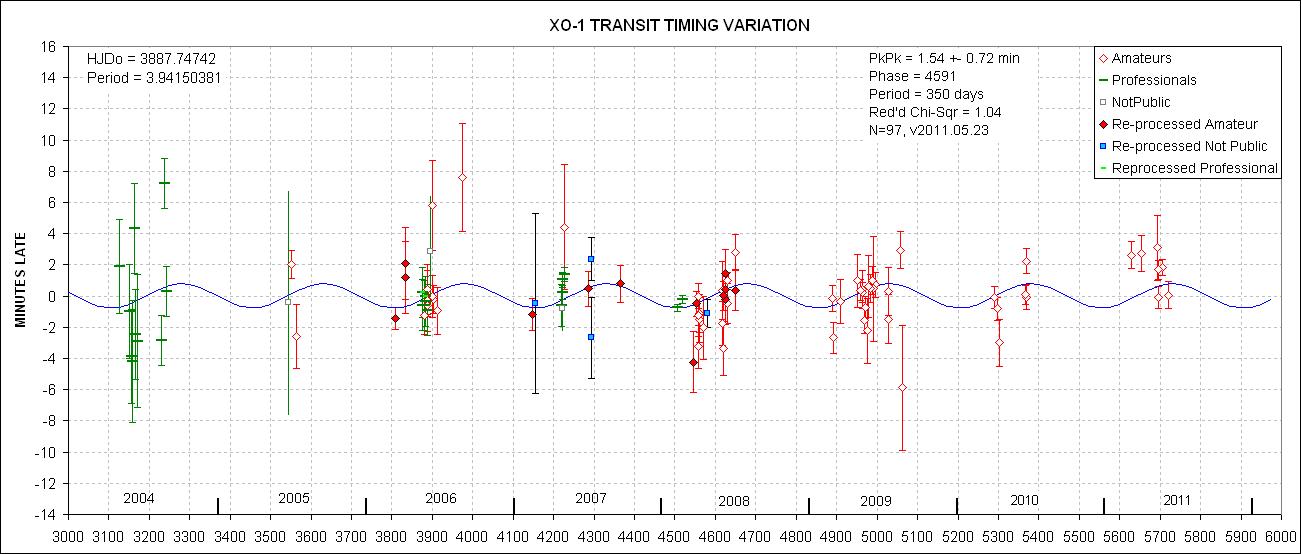
Plot of all mid-transit measurements,
amateur and professional, versus expected HJD using the
ephemeris given in the upper-left had corner. The sinusoidal
model has been fit to the data using chi-squared minimization. The
peak-to-peak amplitude is 1.54 +/- 0.72 minutes (based on
chi-square procedures). This is a 2.1-sigma "detection" -
meaning that it probably is not significant.
This TTV plot is suggestive of a second planet in a resonant orbit that
perturbs XO-1b's orbital motion. I am reluctant
to interpret this data as constituting a "second planet"
detection because my "eyeball" doesn't believe it. The amplitude
is 3.6 times its formal SE. This illustrates what a
search for another exoplanet would involve. In fact, the main message
of this plot is that amateur data must be in groups of 6 to10 at
the approximate same date in order for the median value of the
group to be "useful." Every group has outliers, and the outliers
have undue influence when they are not accompanied by other measurements
at about the same date to reveal that they are outliers. It's too bad
that observations in 2007 weren't coordinated with this in mind. If
only groups of data are considered there are just 3 TTV values in this
plot (one in 2006 and two in 2008) that can be relied upon for a TTV anomaly
search. Another "problem" with the sinusoid solution in this plot is
that the preiodicity is very close to one year. I'm confident that the
JD to HJD conversion was done correctly, nevertheless, it is always
prudent to be wary of any anomaly with a one year periodicity. In 2009
the sinusoidal model will be put to a definitive test I hope. (Symbol
descriptions are available from the webmaster.)
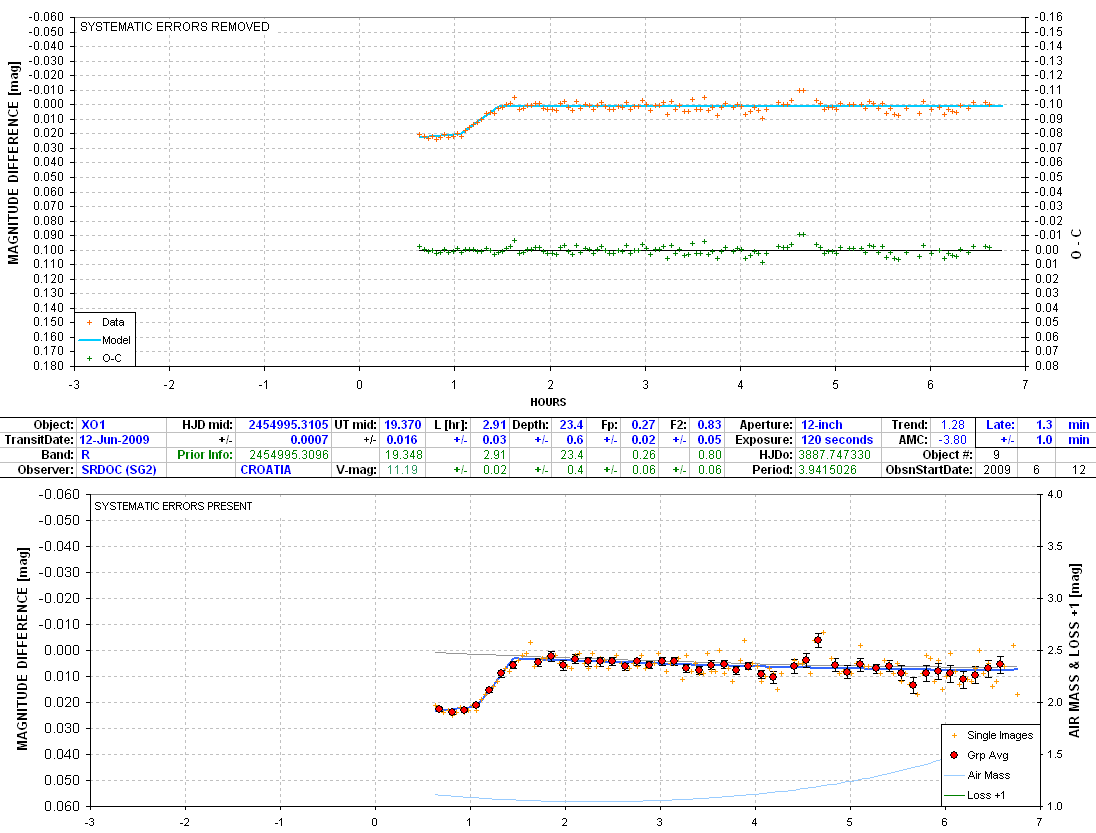
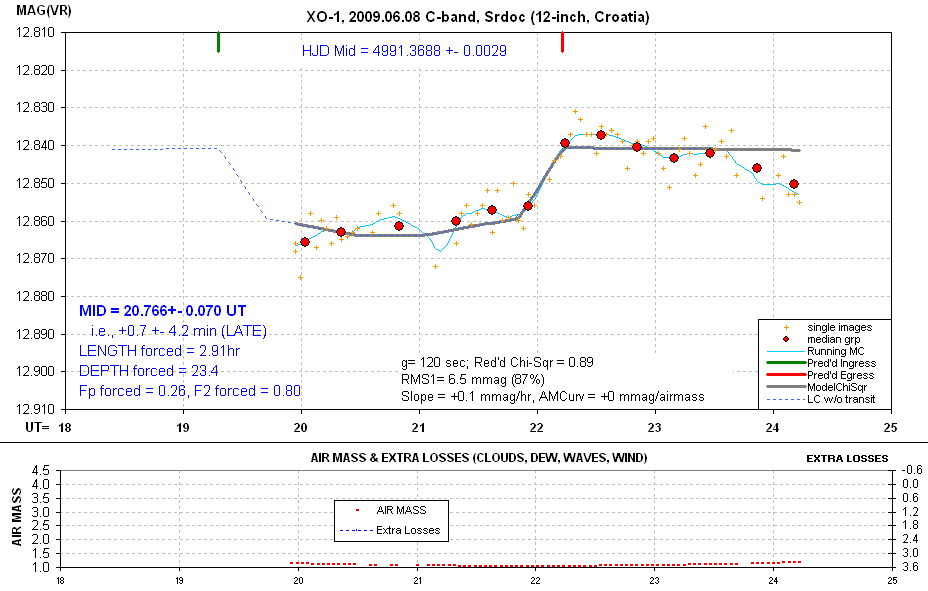
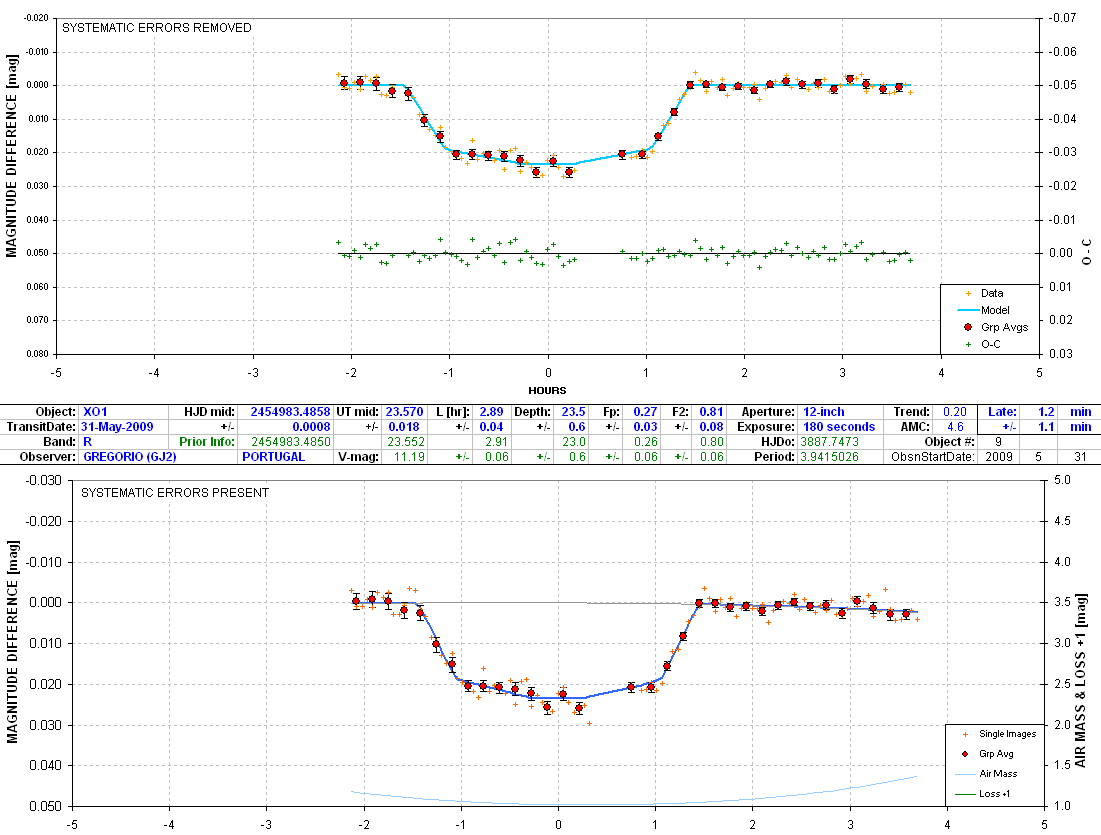
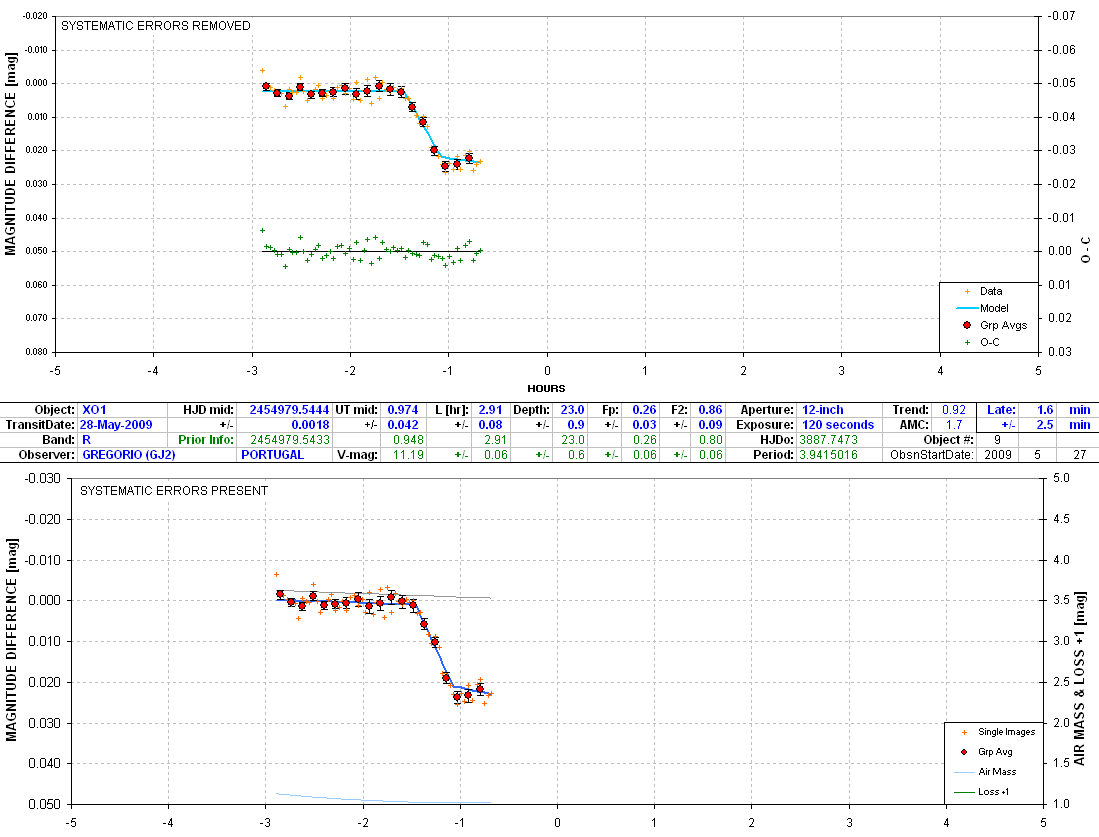
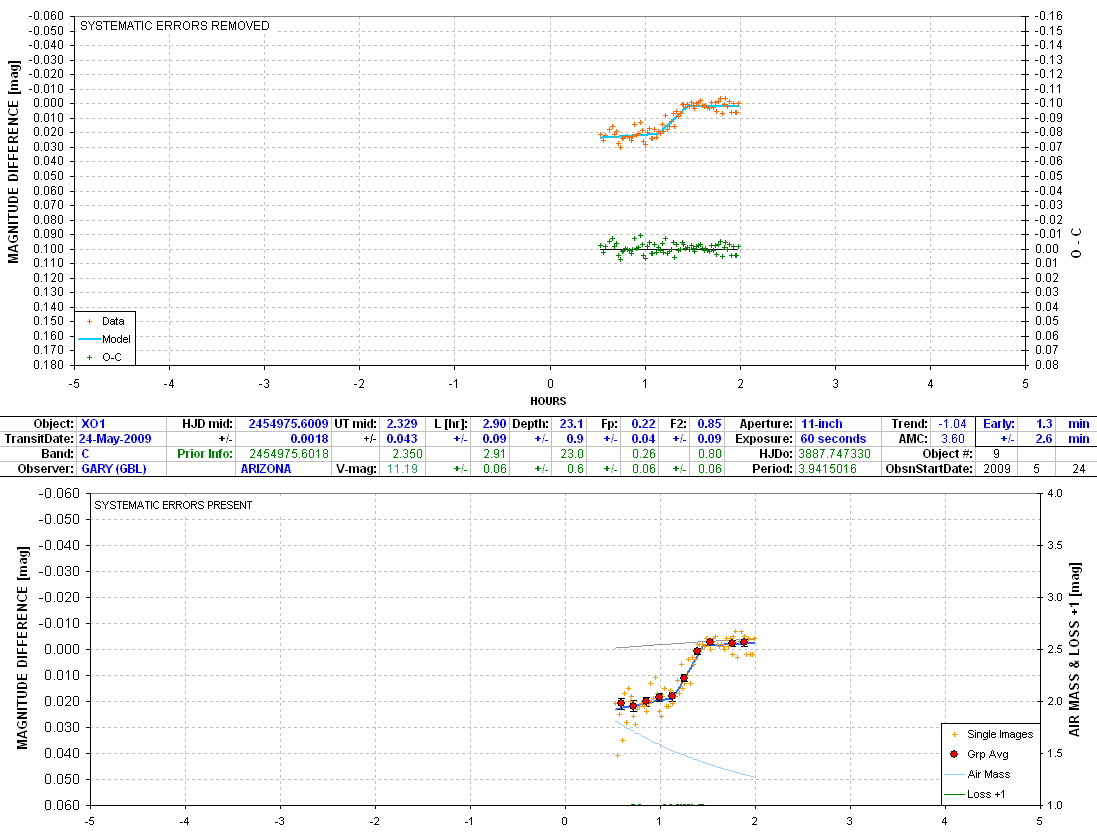
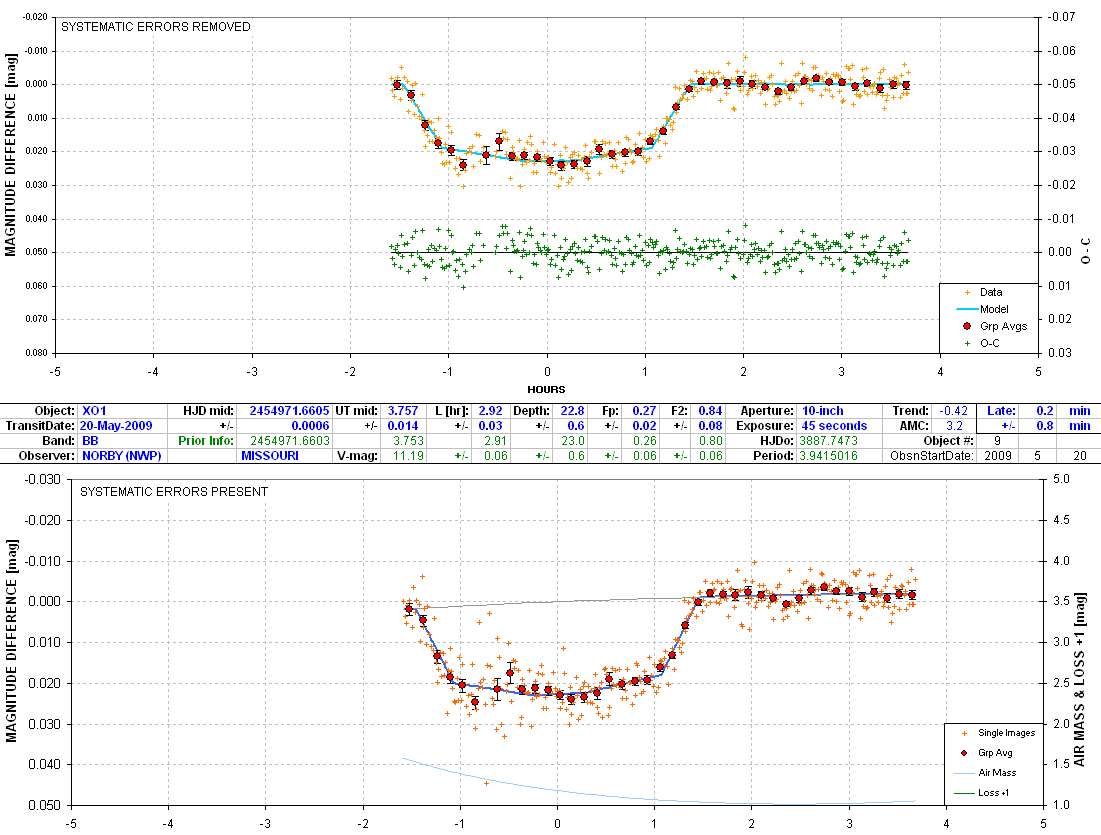
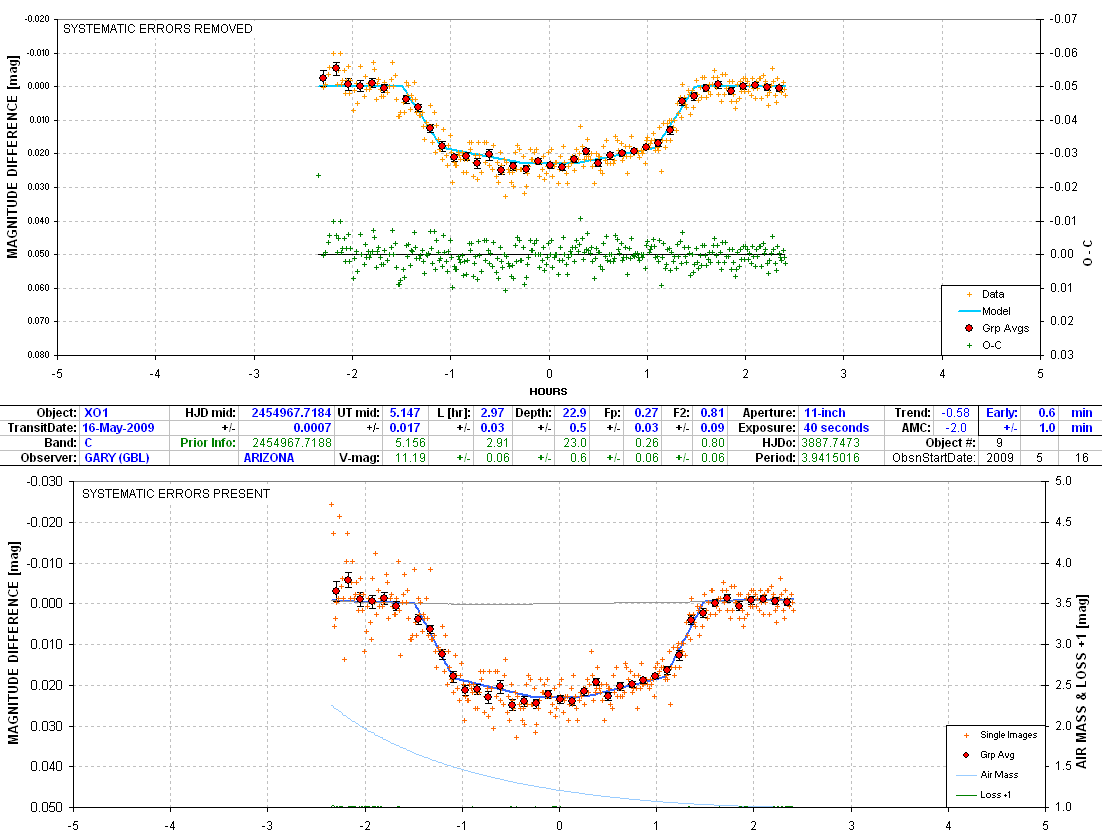
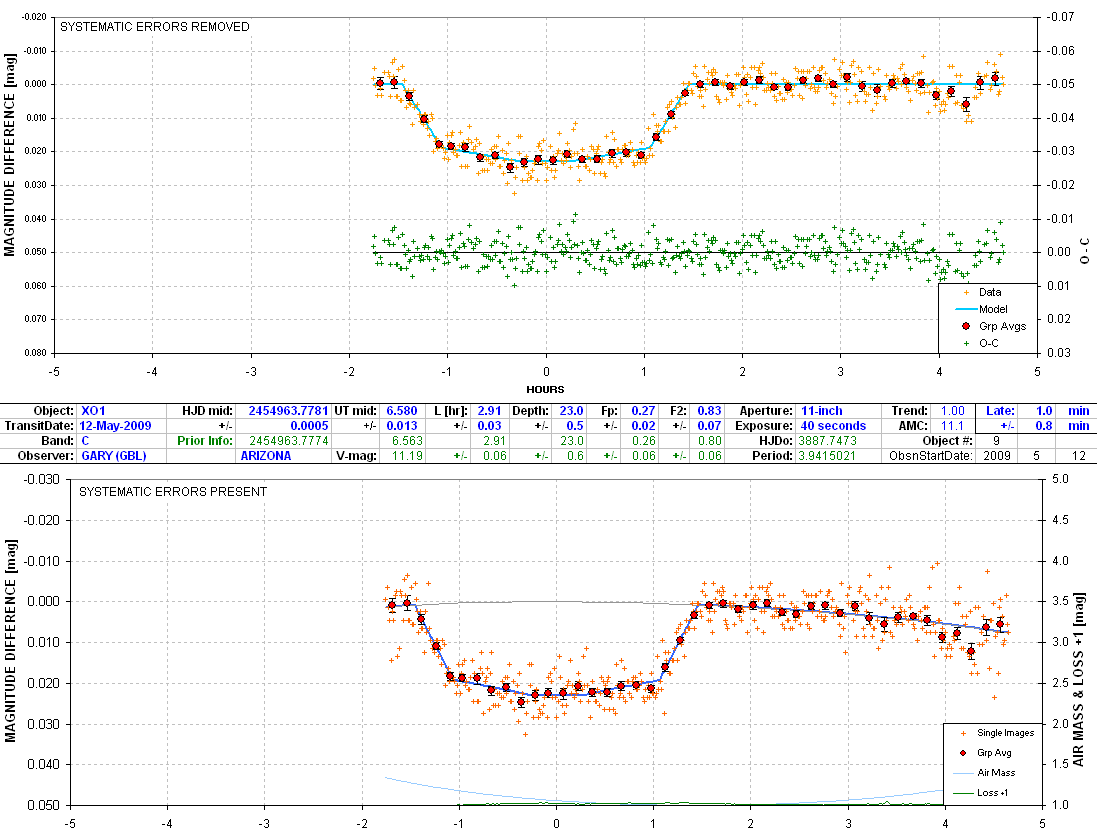
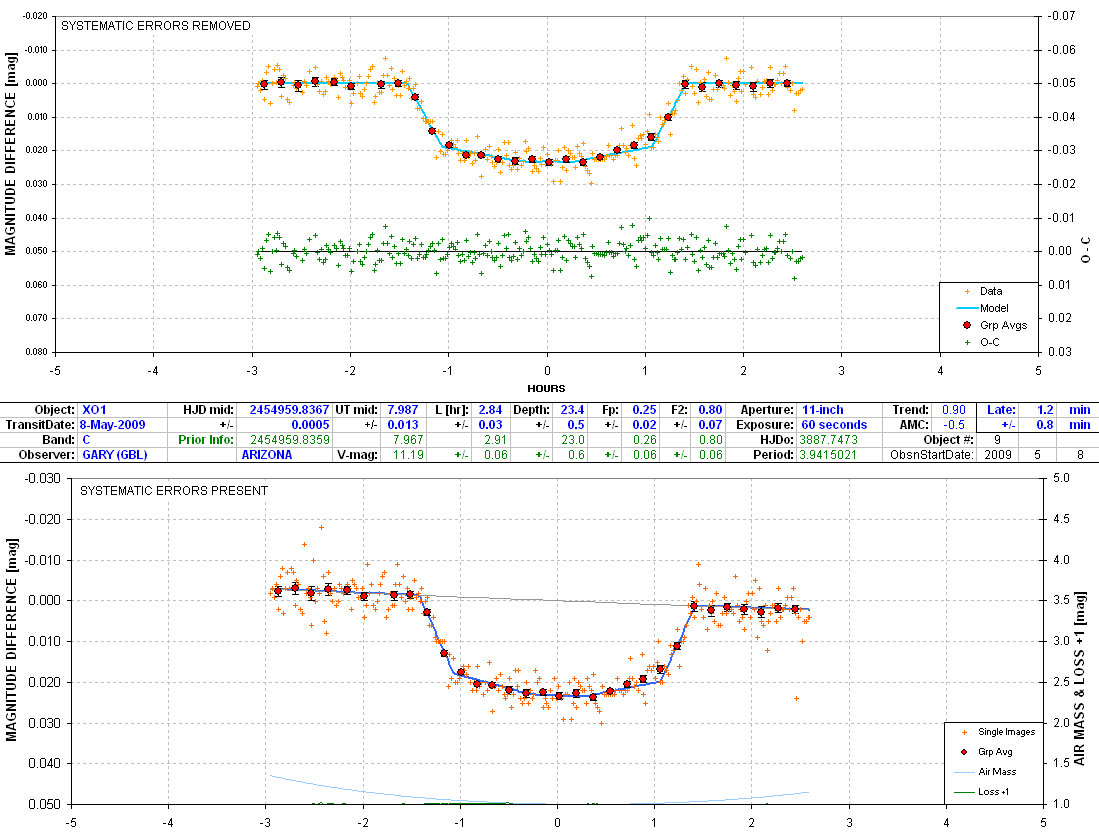
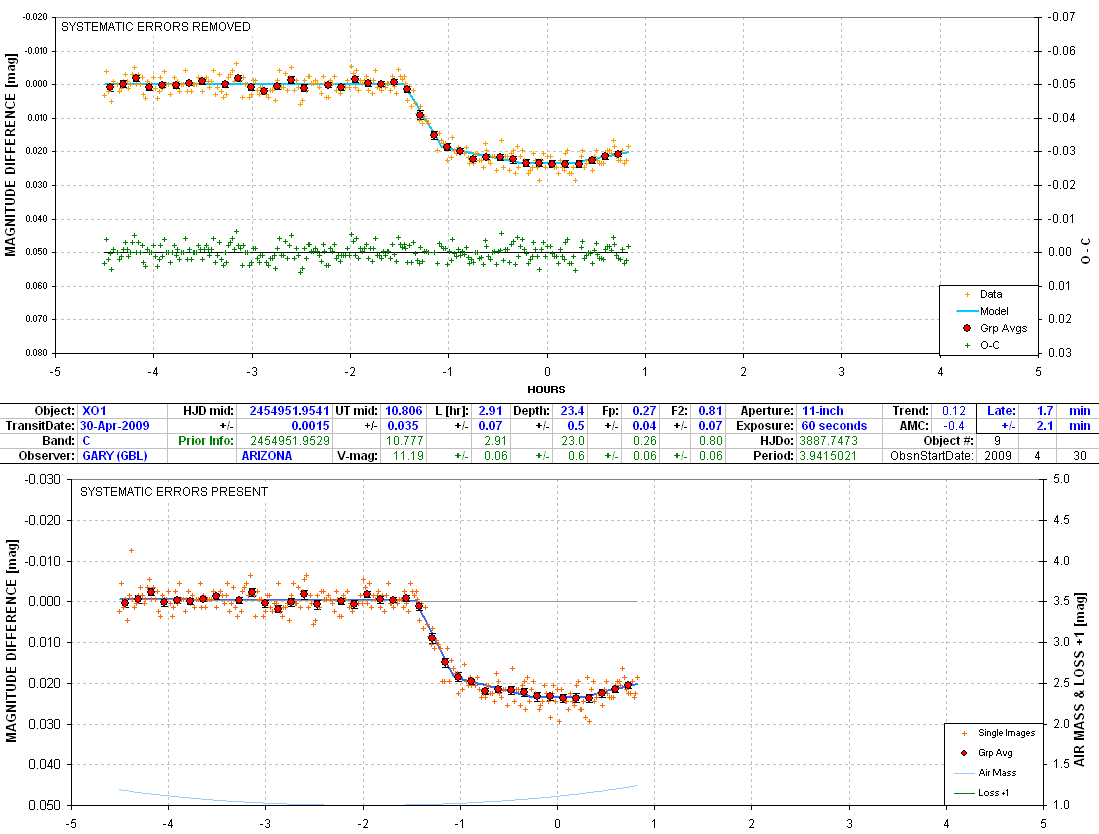
Transit Parameters
- Updated 2009.08.16
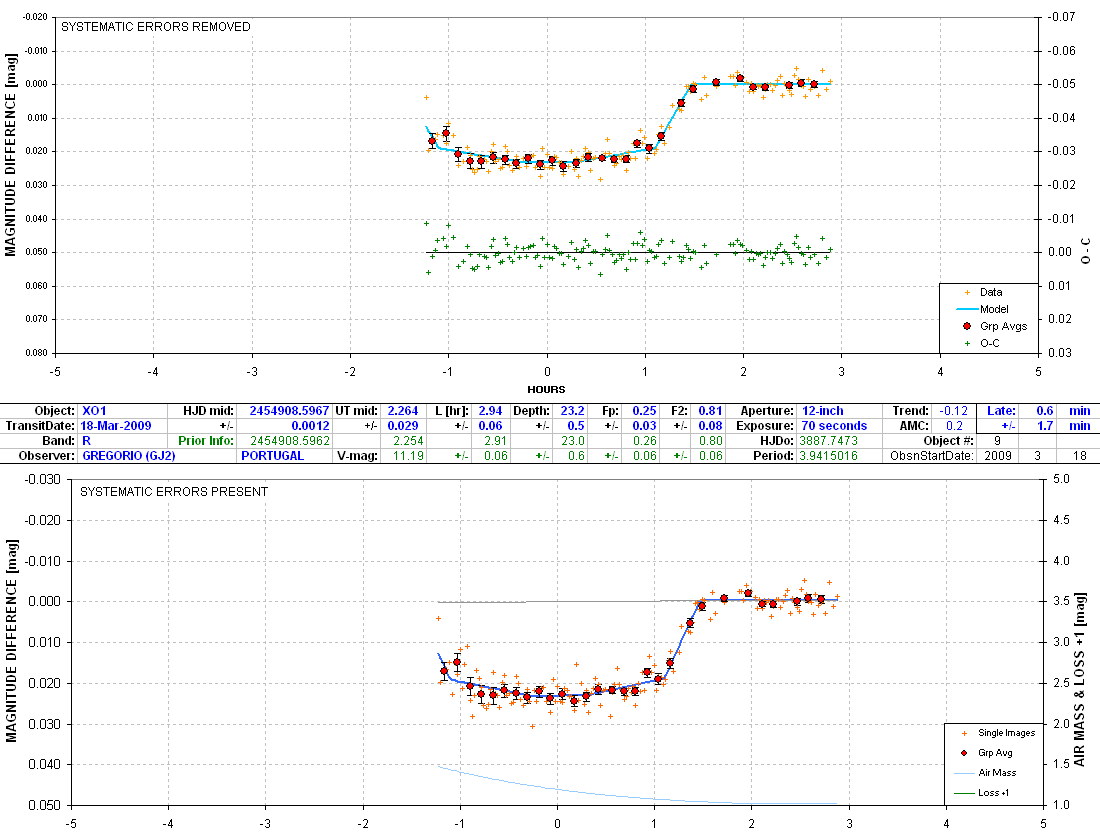
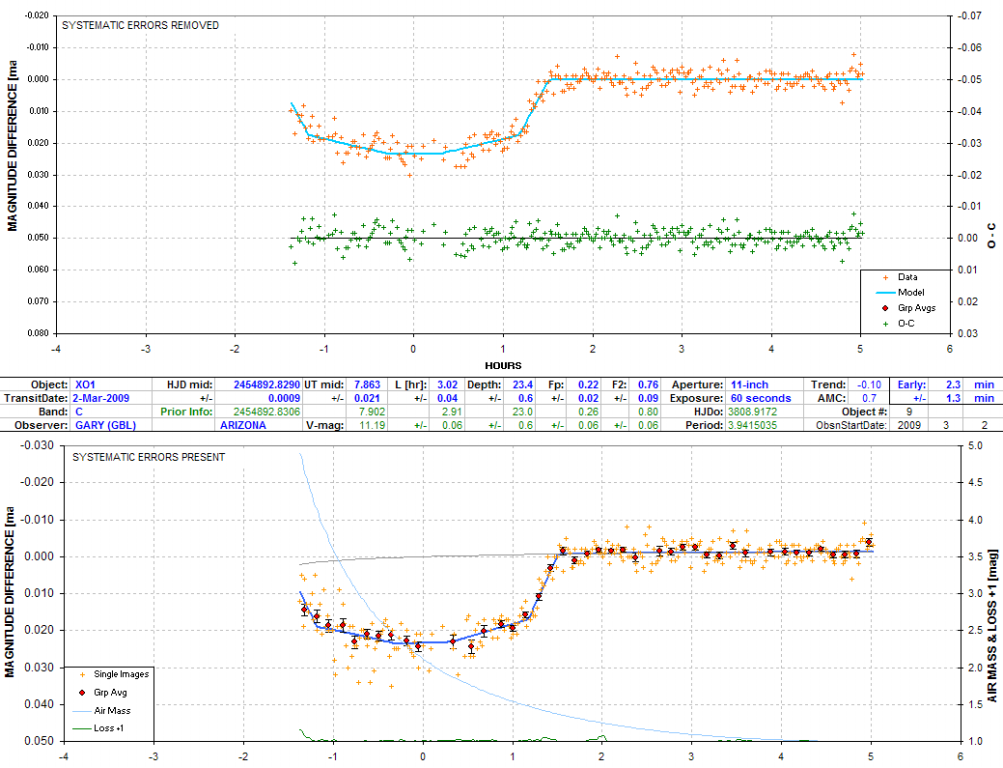
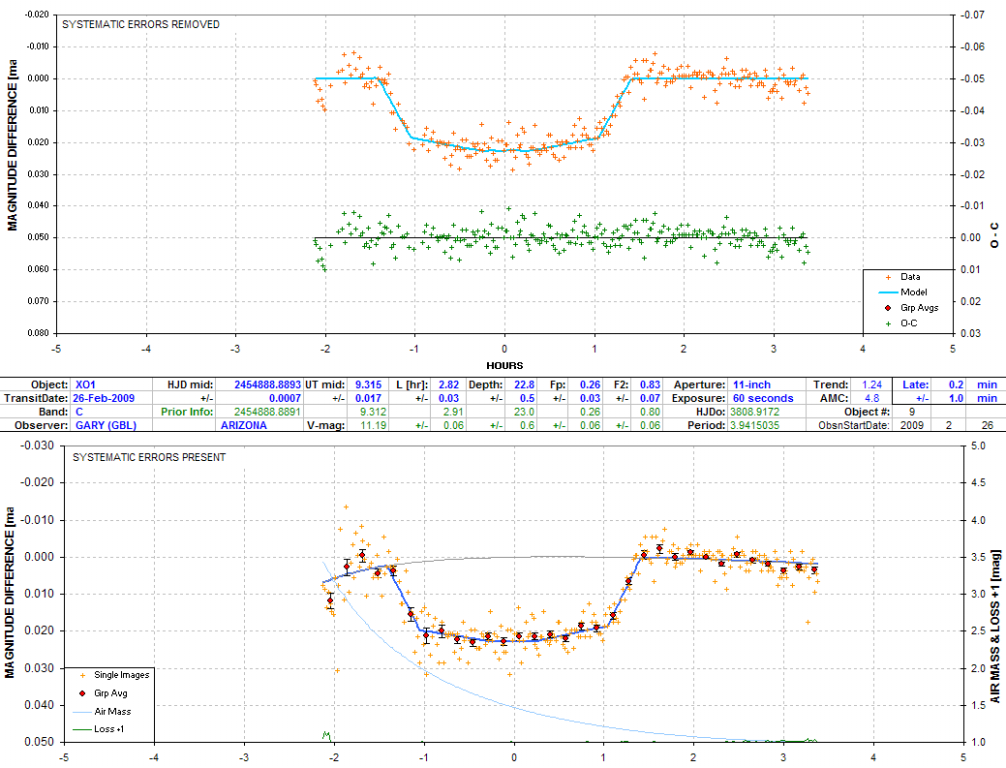
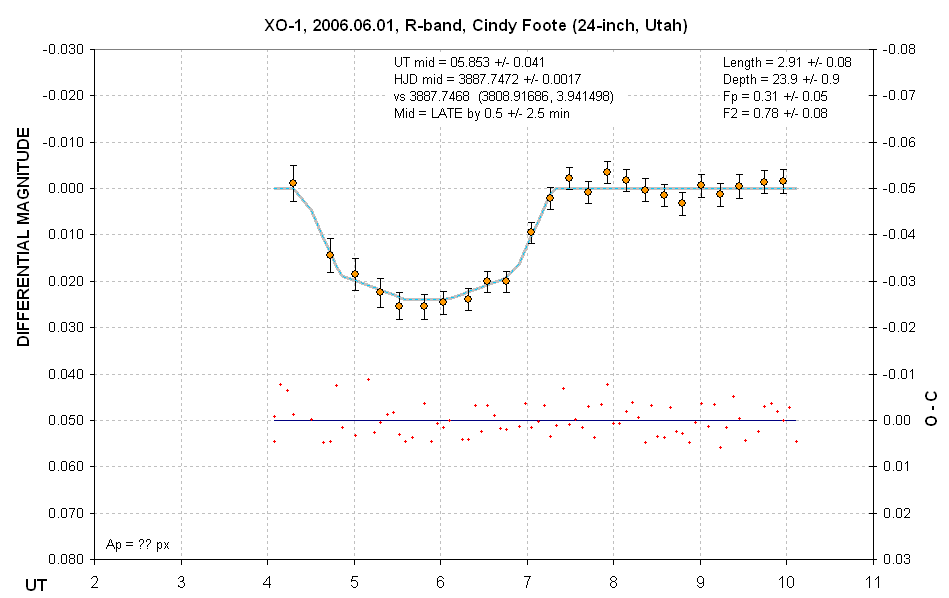
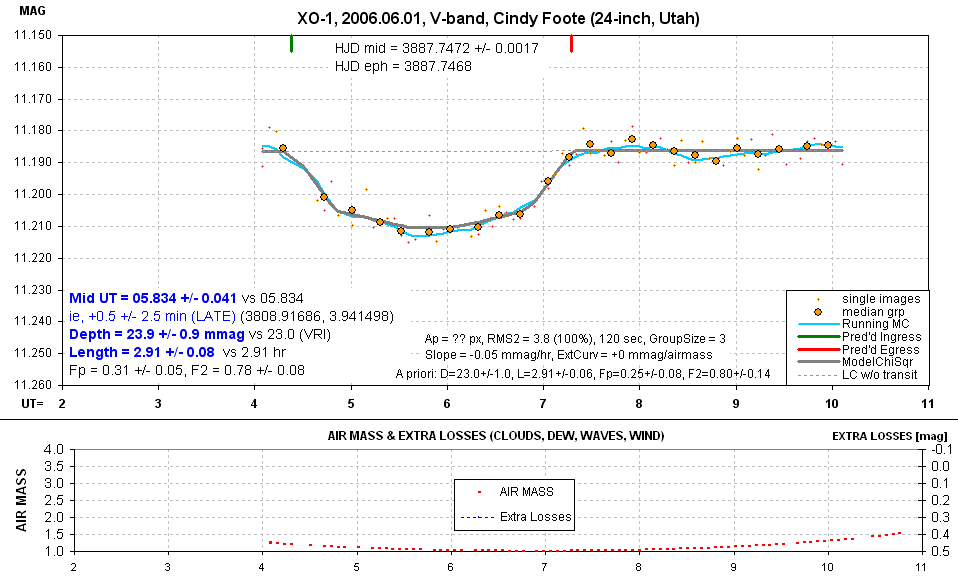
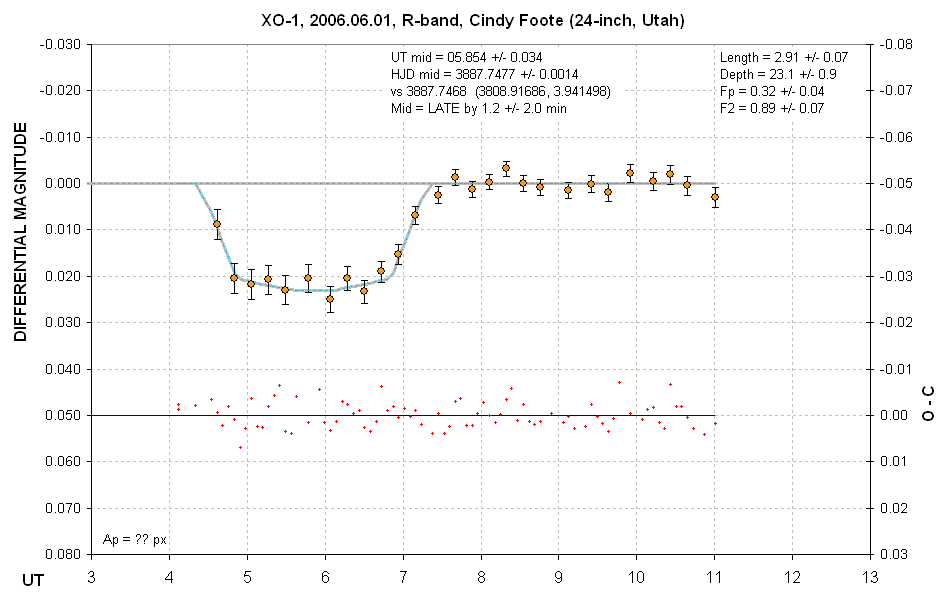
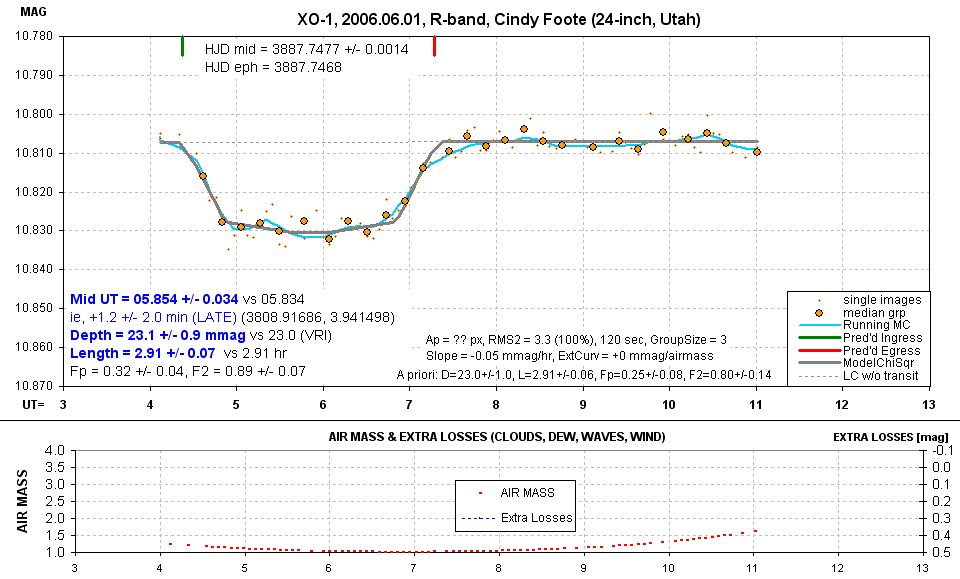
Light Curves by Amateurs
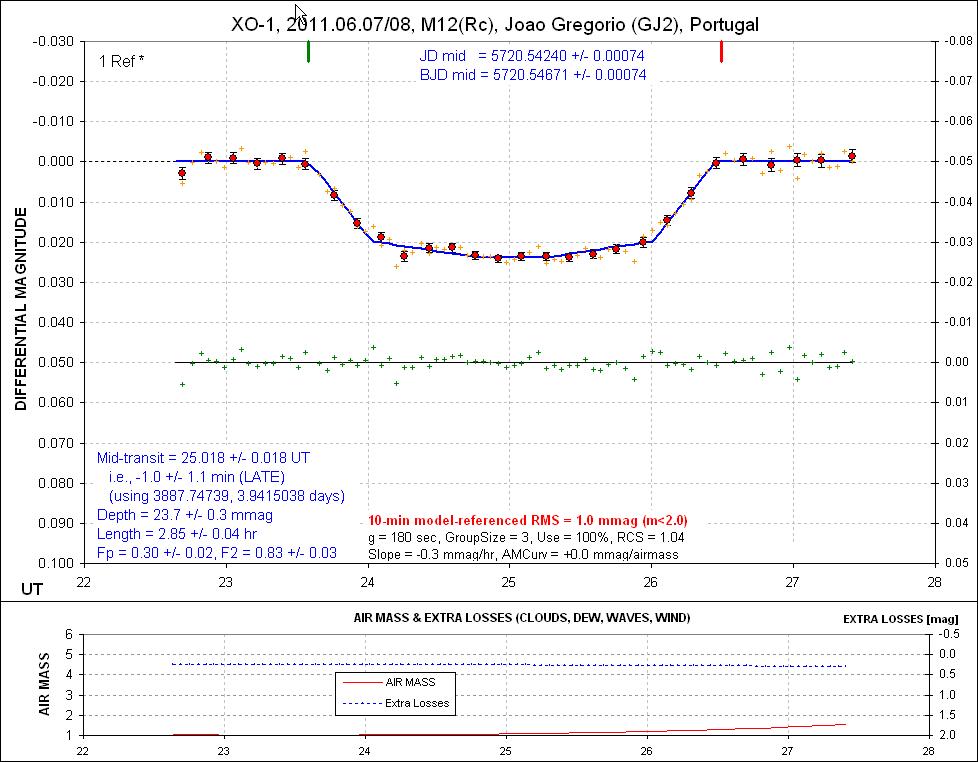
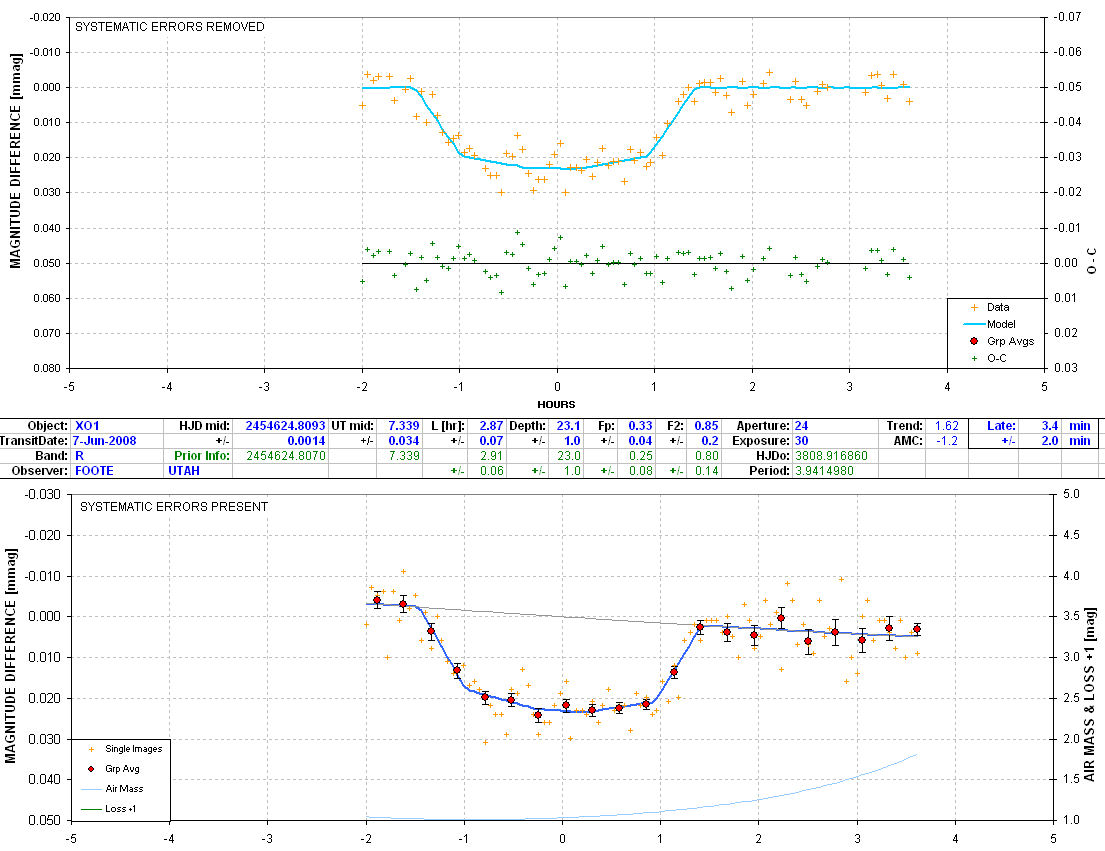
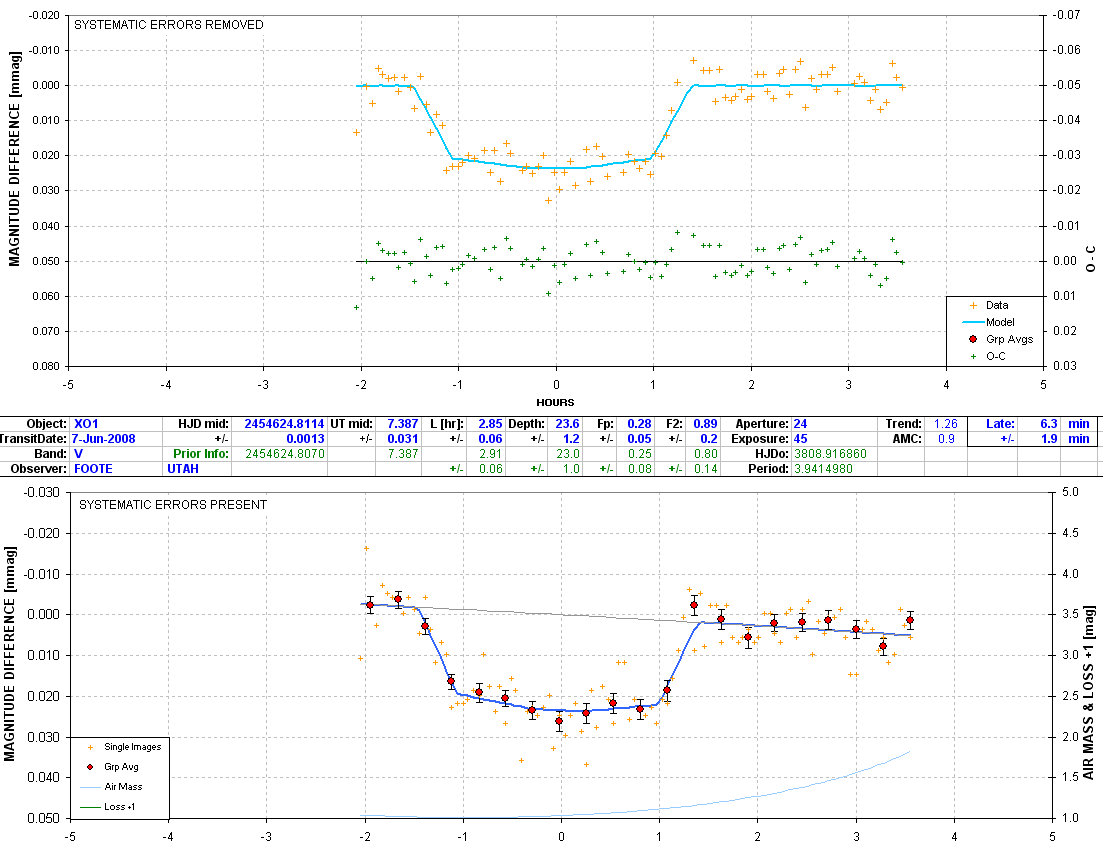
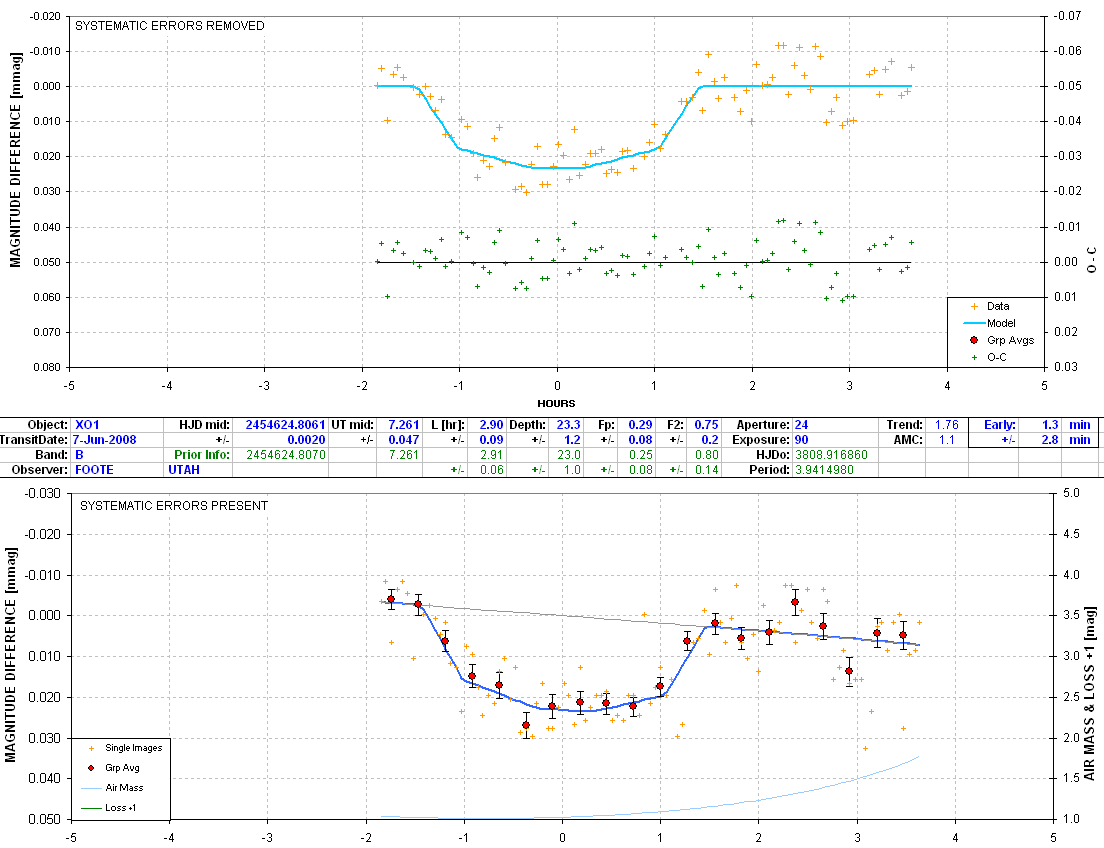
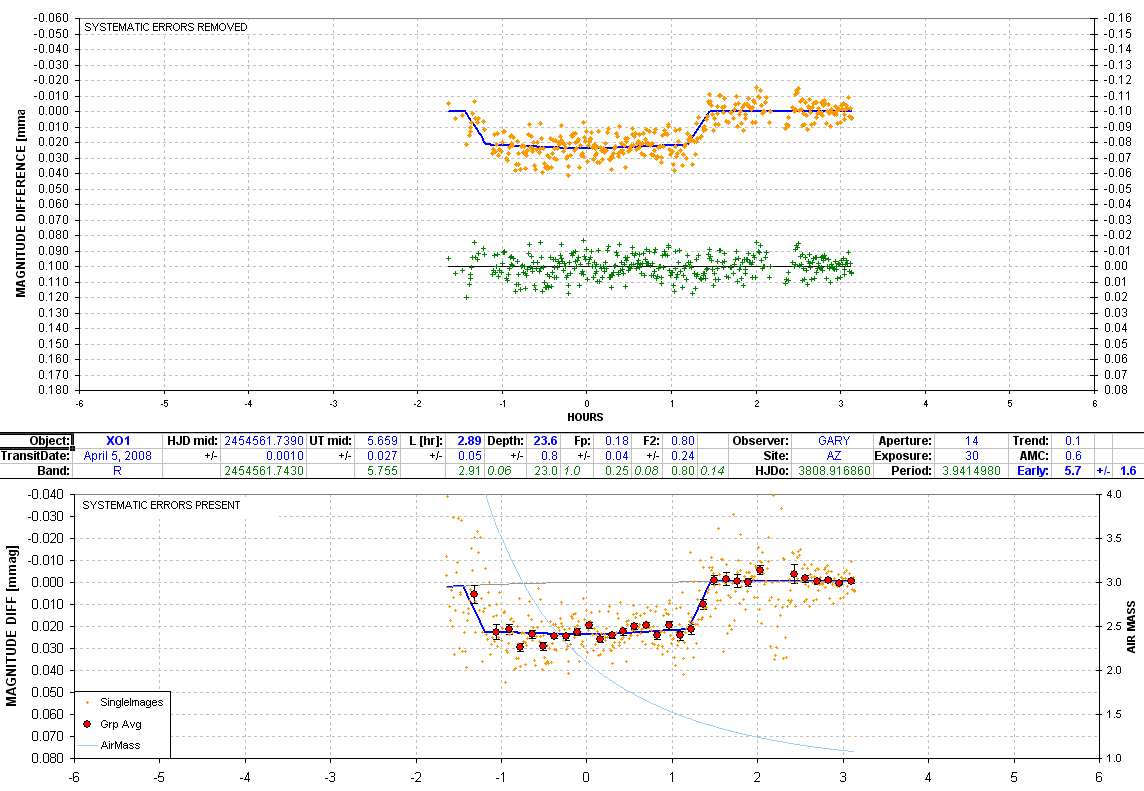
110607-XO1-GJ2-sys
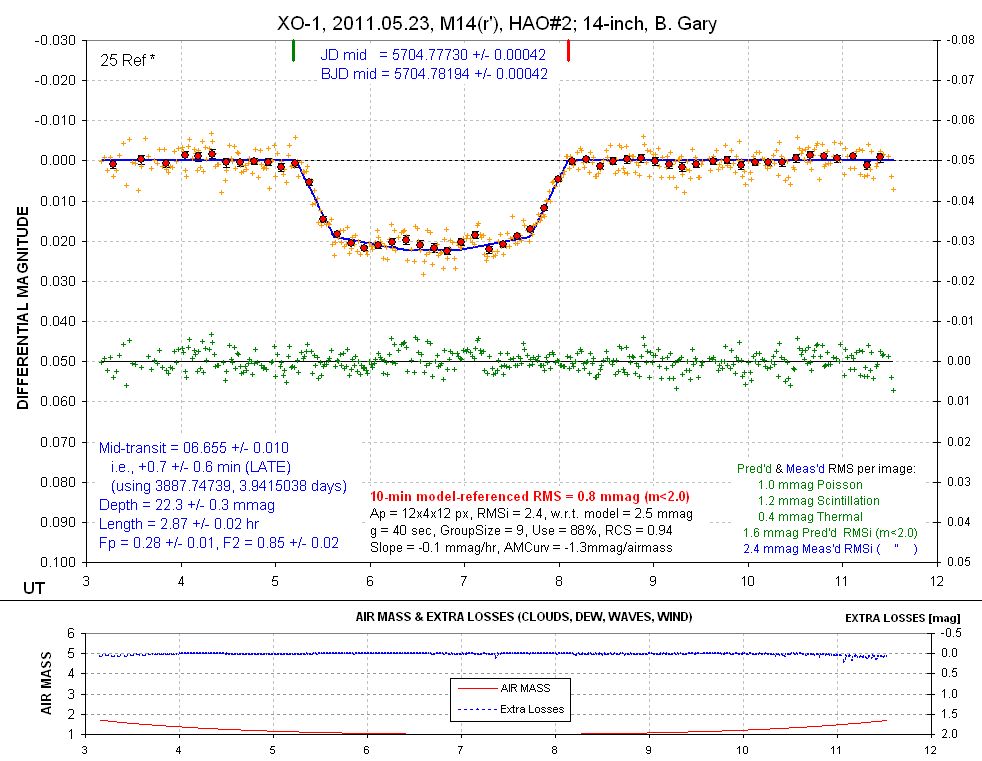
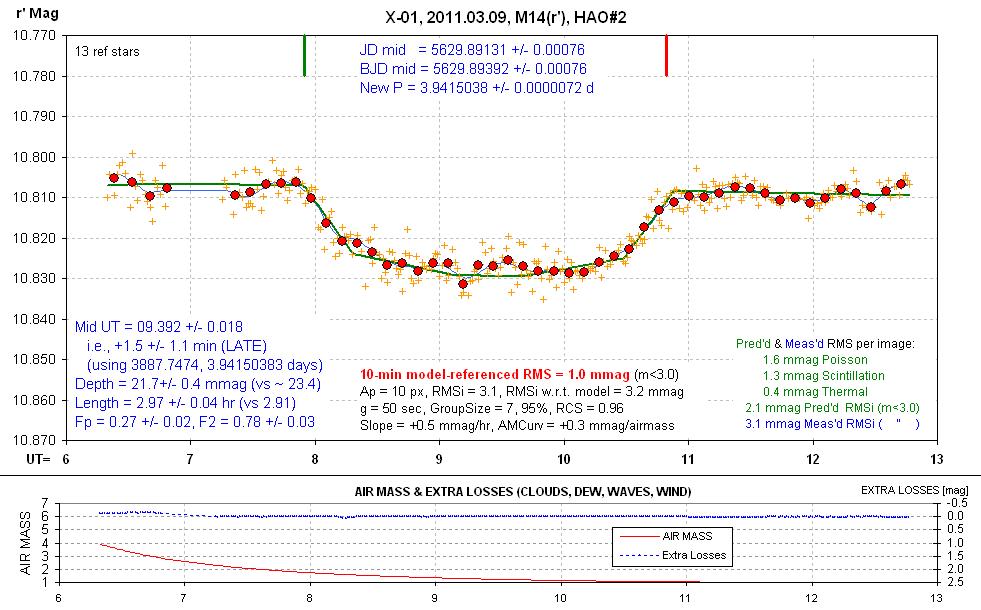
110523-XO1-M14(r')-pro
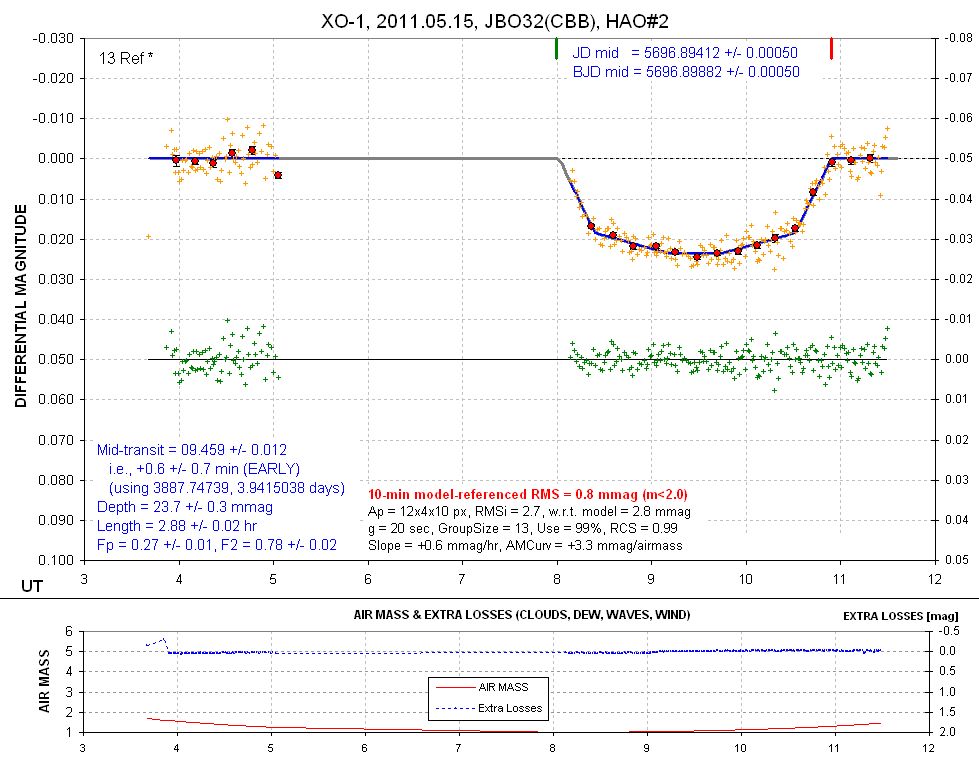
110515-XO1-JBO32-pro
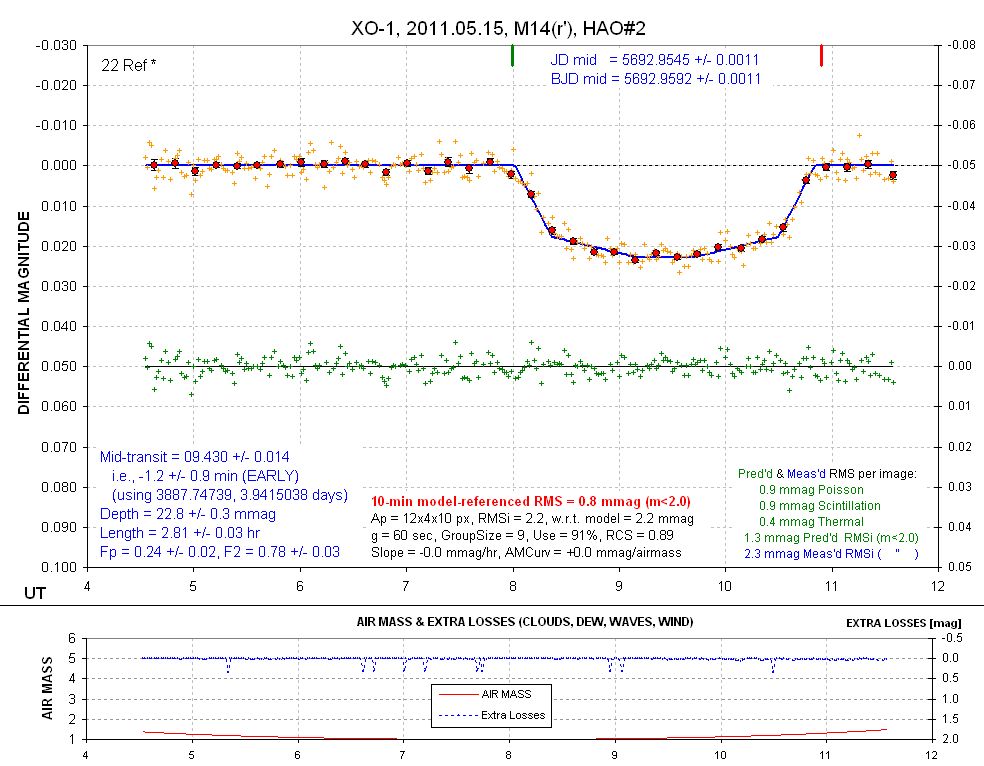
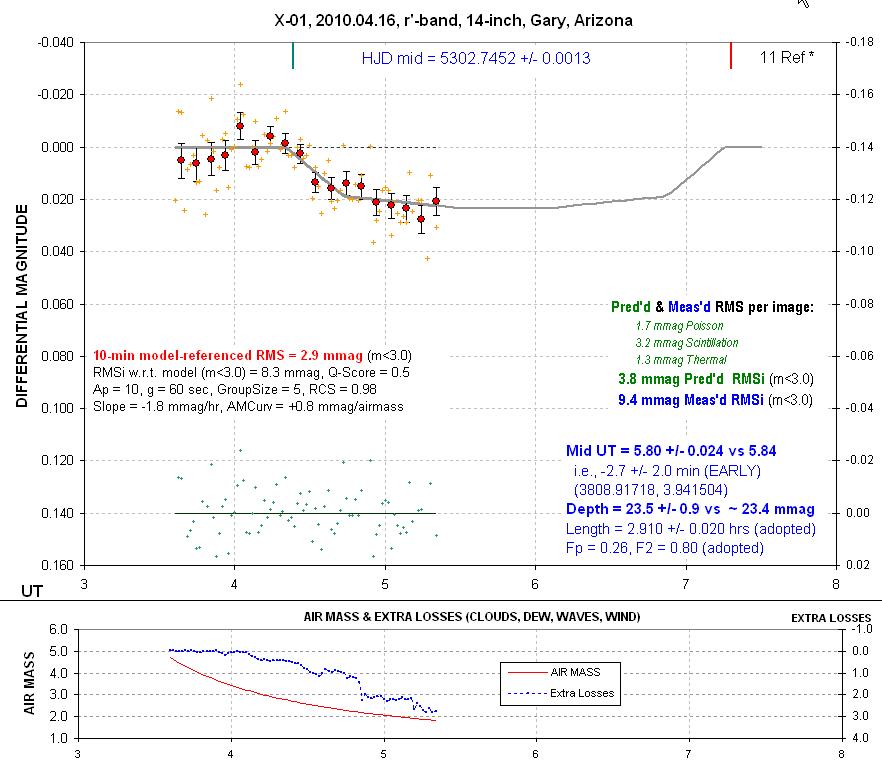
110515-XO1-M14(r')-pro
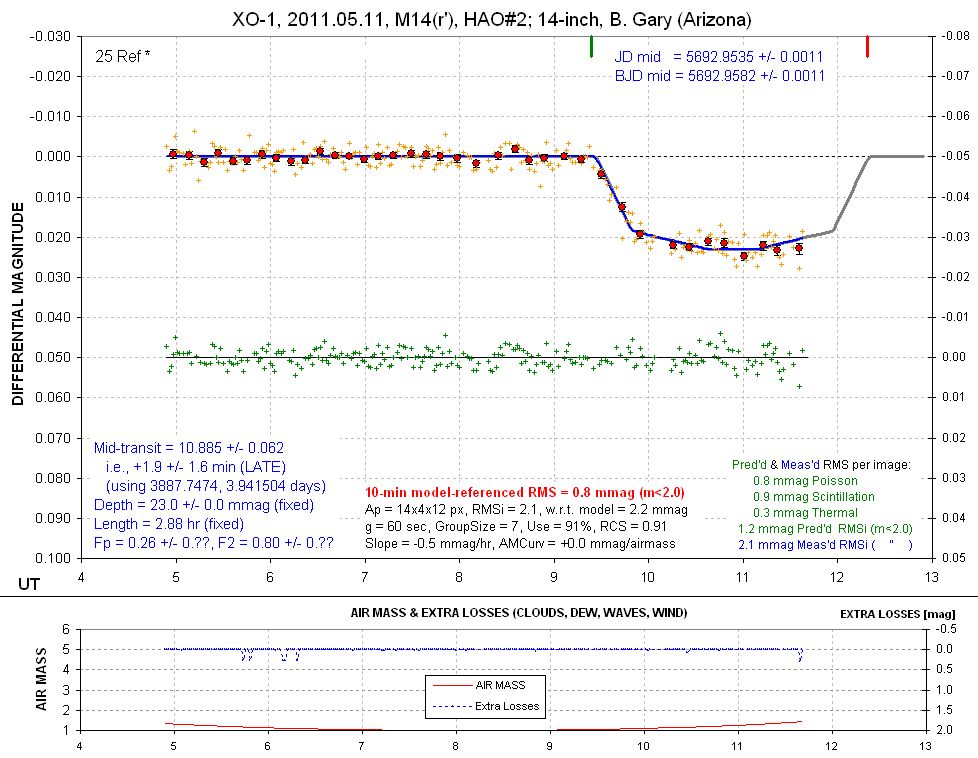
110511-XO1-M14(r')-pro
110401-X01-GJ2-sys
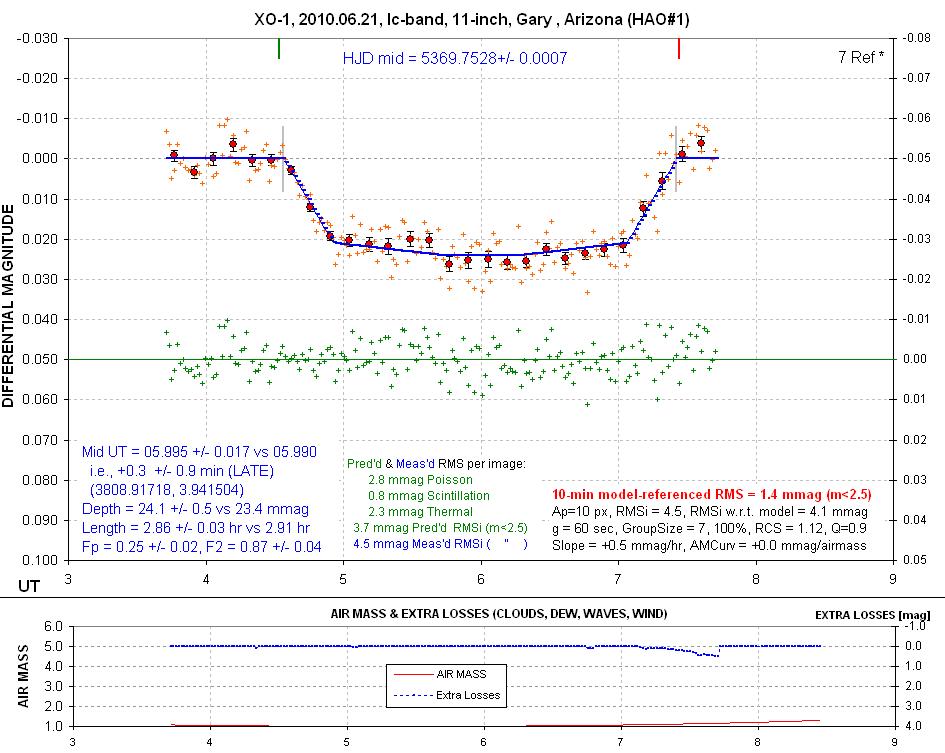
100622-xo1-C11(Ic)-pro
Note the correlated "brightening" above the model fit at 5.5
UT for simultaneously observed LCs using two telescopes.
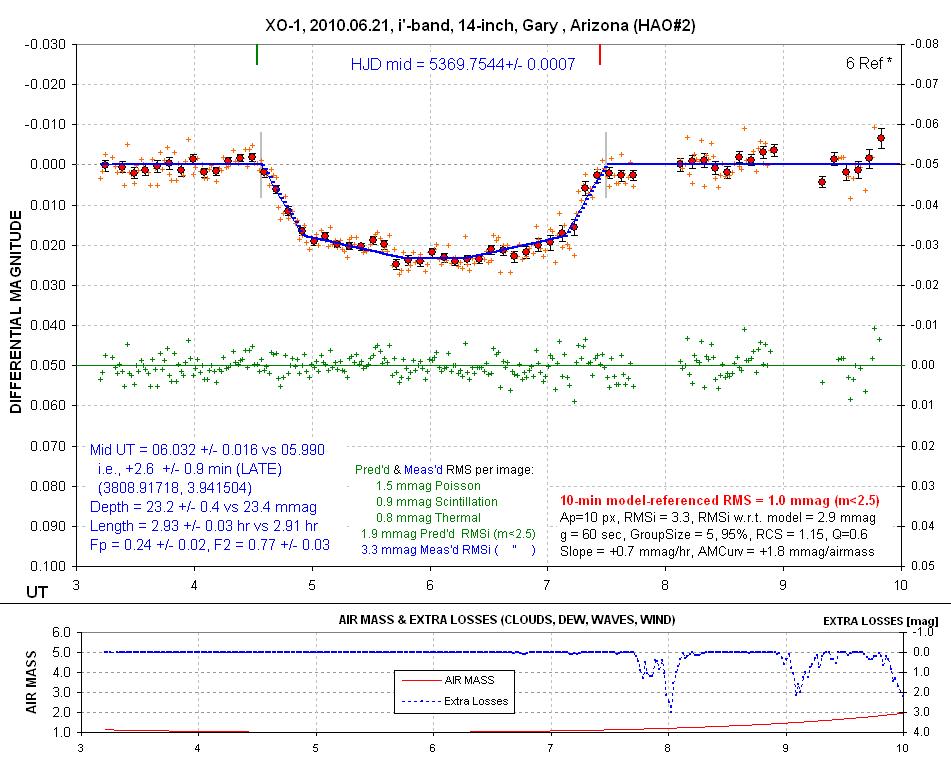
100622-XO1-M14(i')-pro
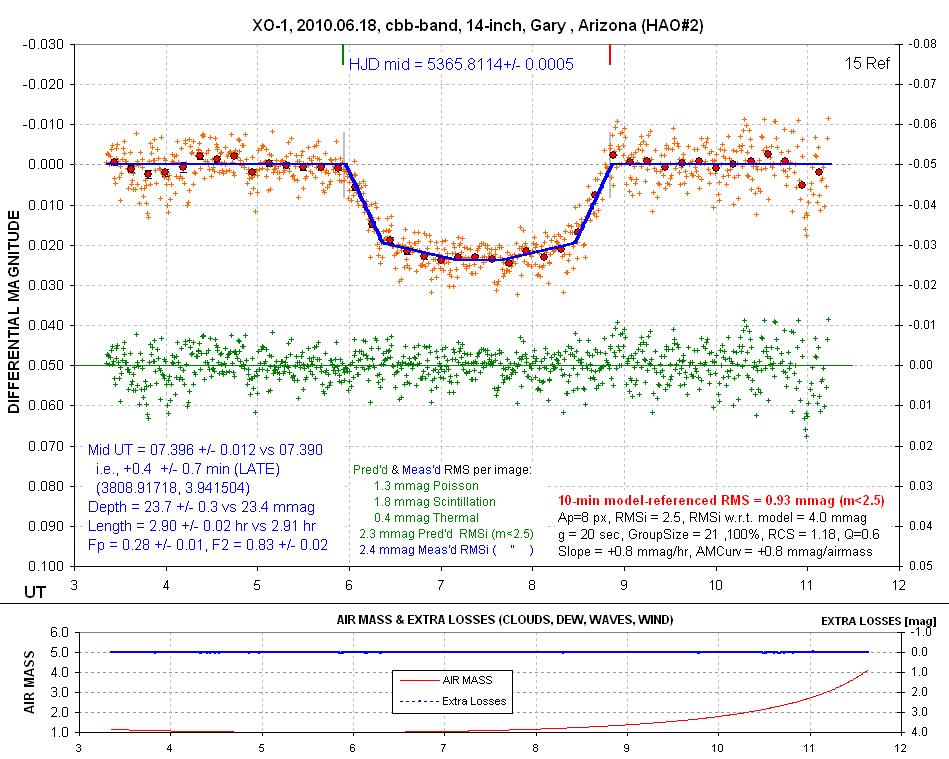
100618-XO1-M14(cbb)-sys
Clouds ruined this observing session.
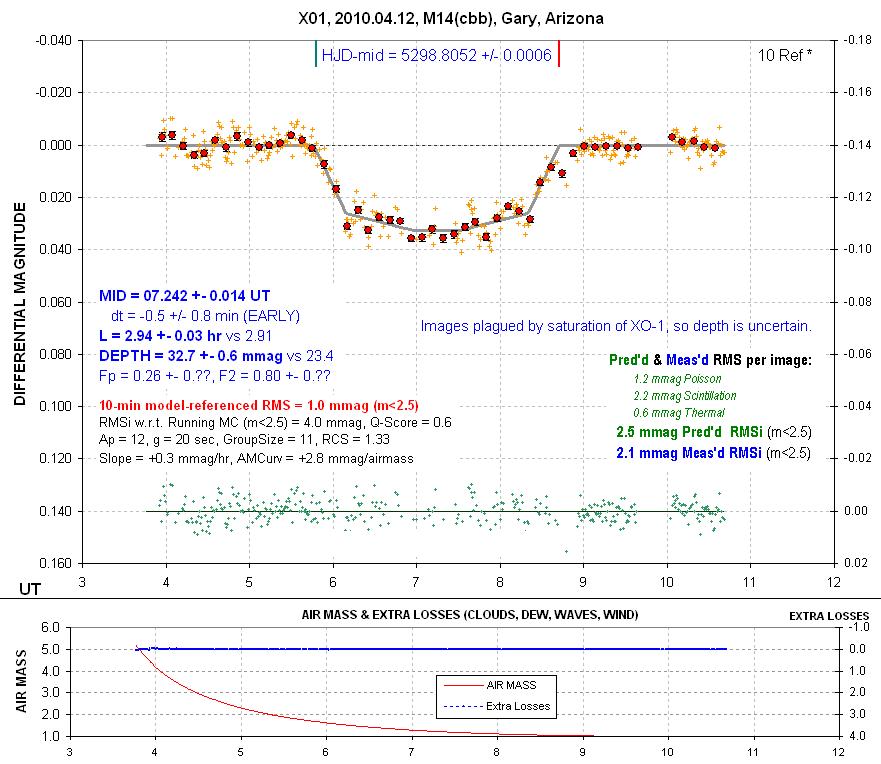
Many images had XO-1 saturated so the depth is
uncertain and the data are noisy.
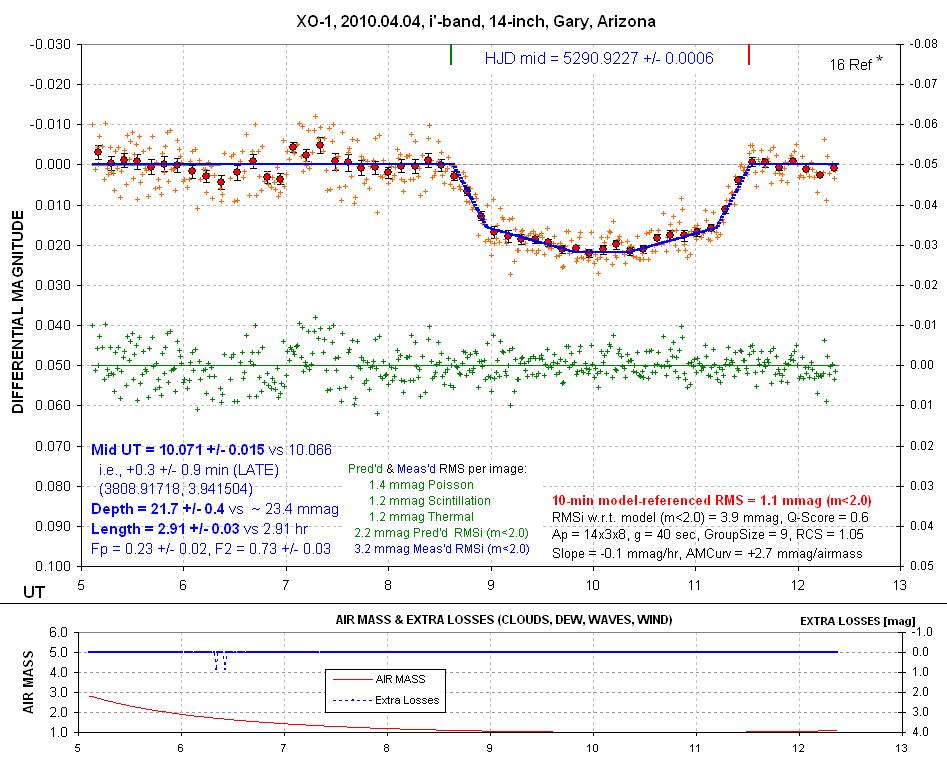
0404GBL Depth
is lower than the others because that's the case for i'-band compared
with shorter wavelengths. Some autoguiding problems made for noisy data
early on.
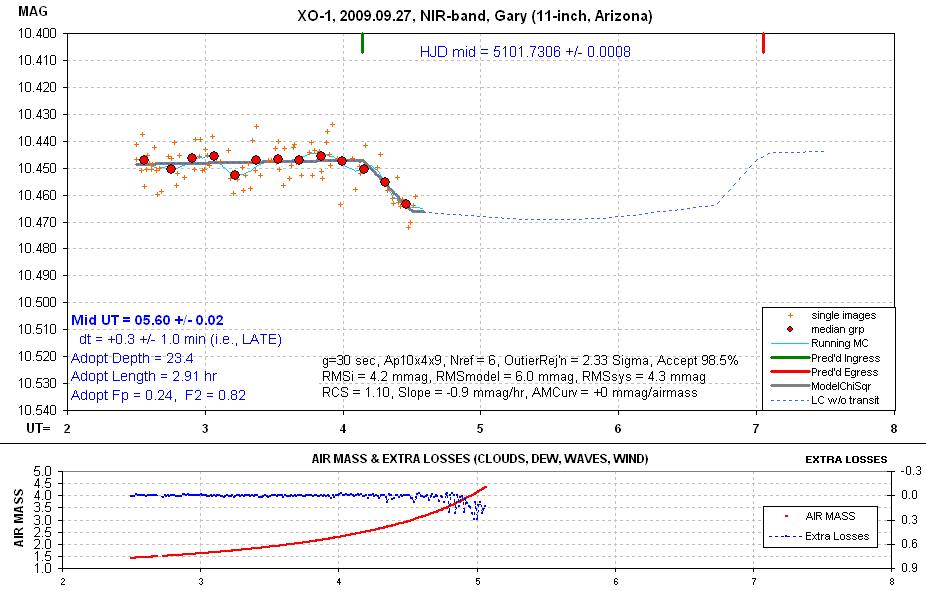
9927GBL
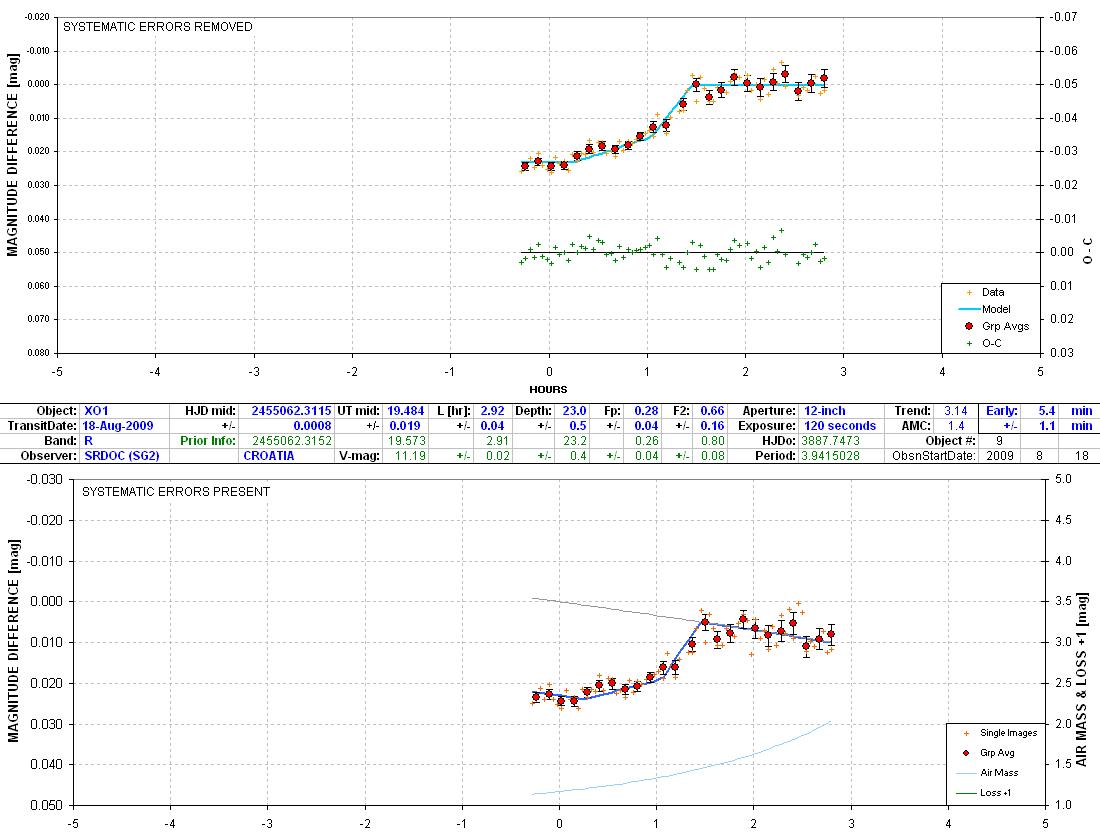
9818SG22
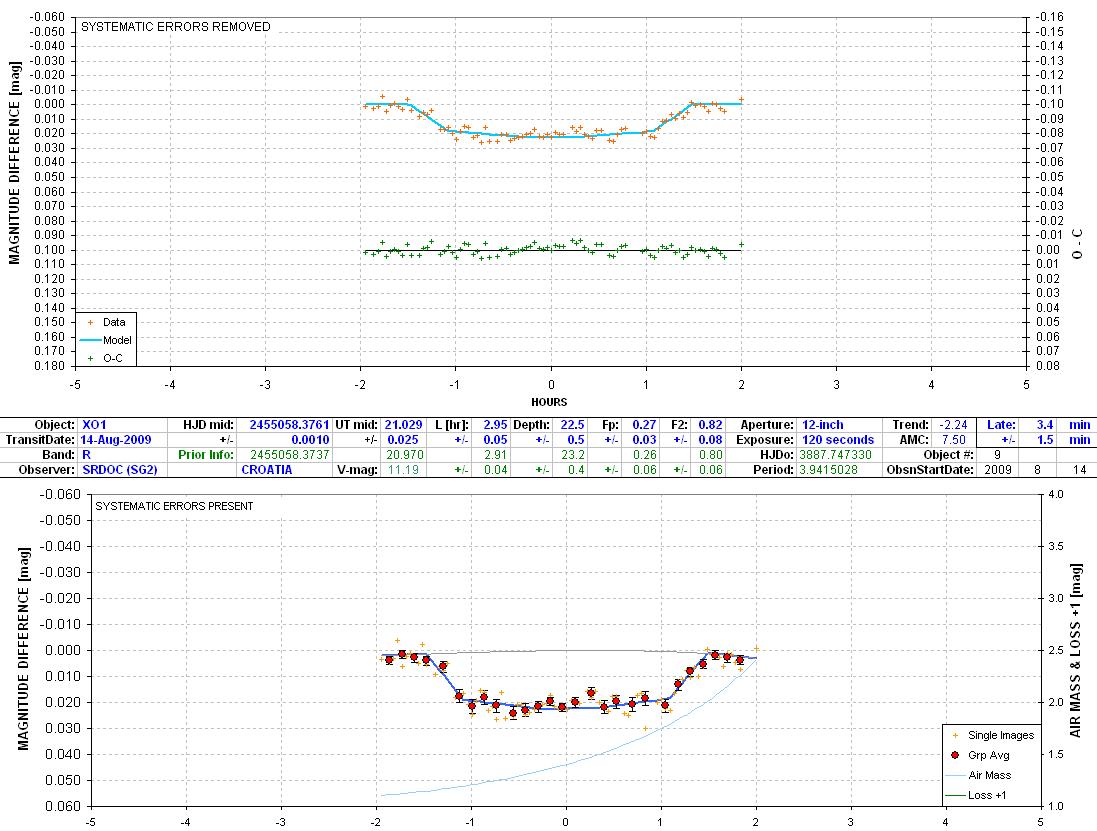
9814SG2
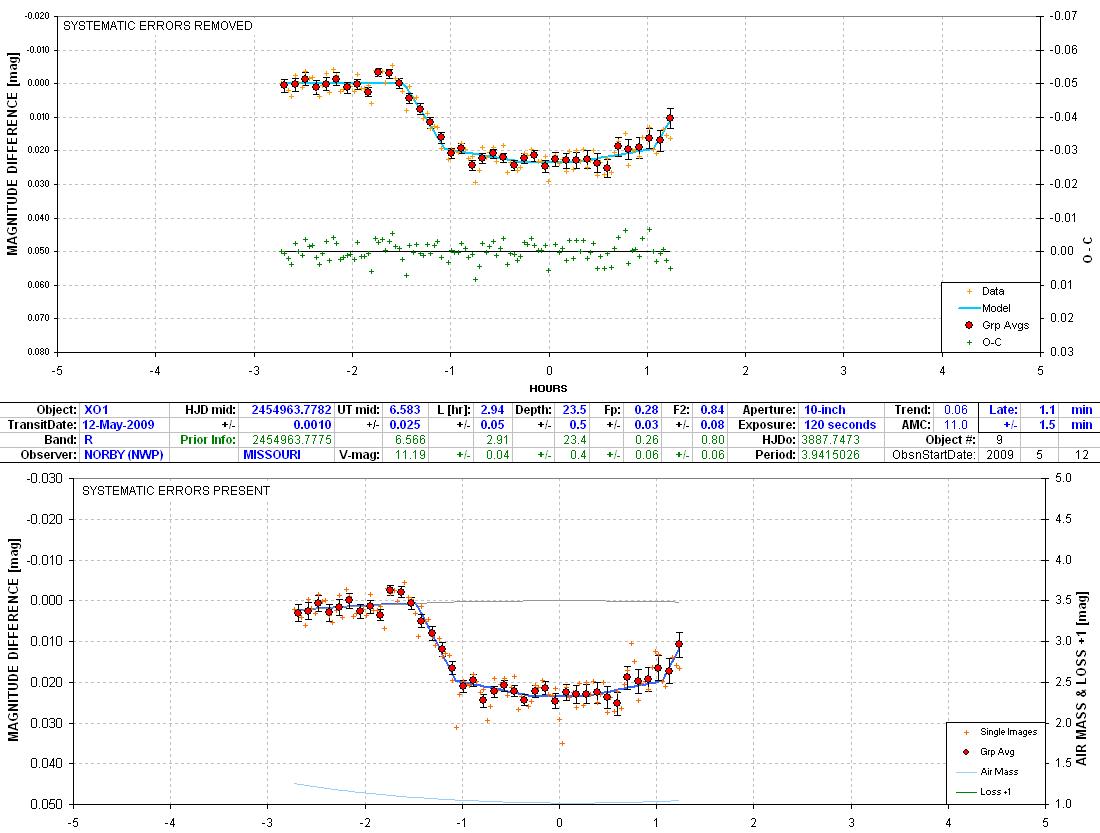
9512NWP
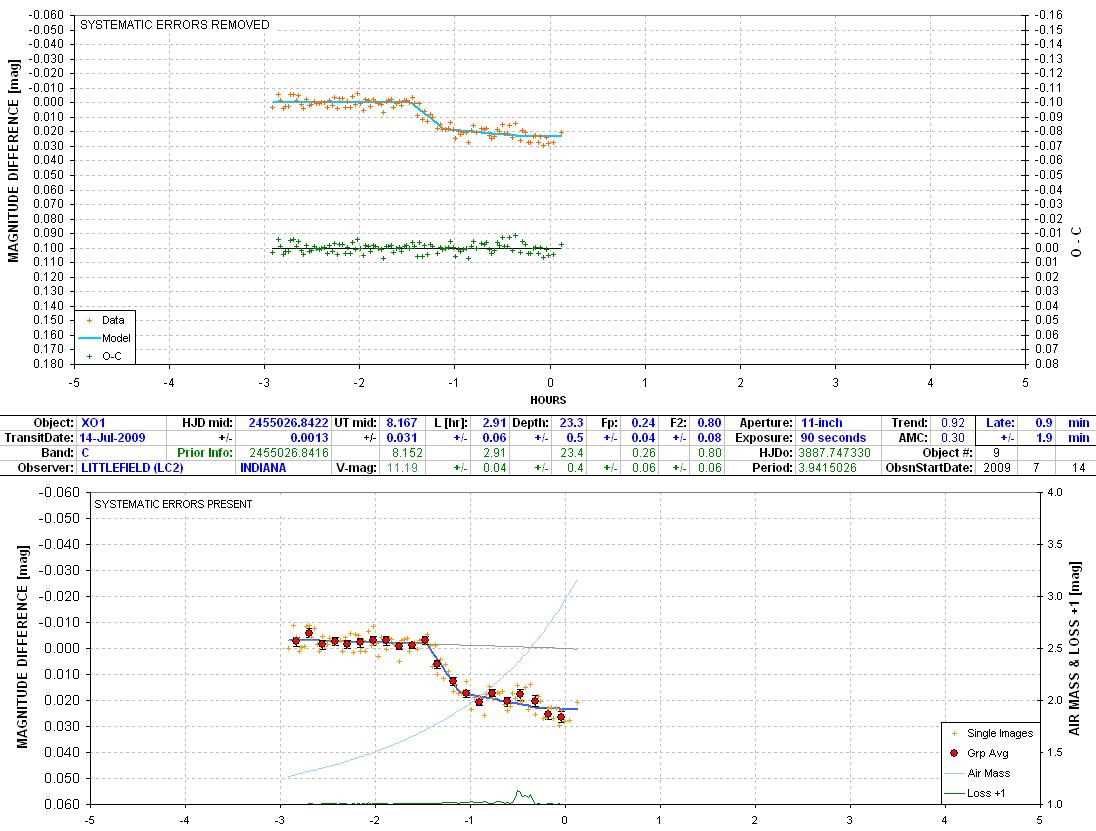
9714LC2
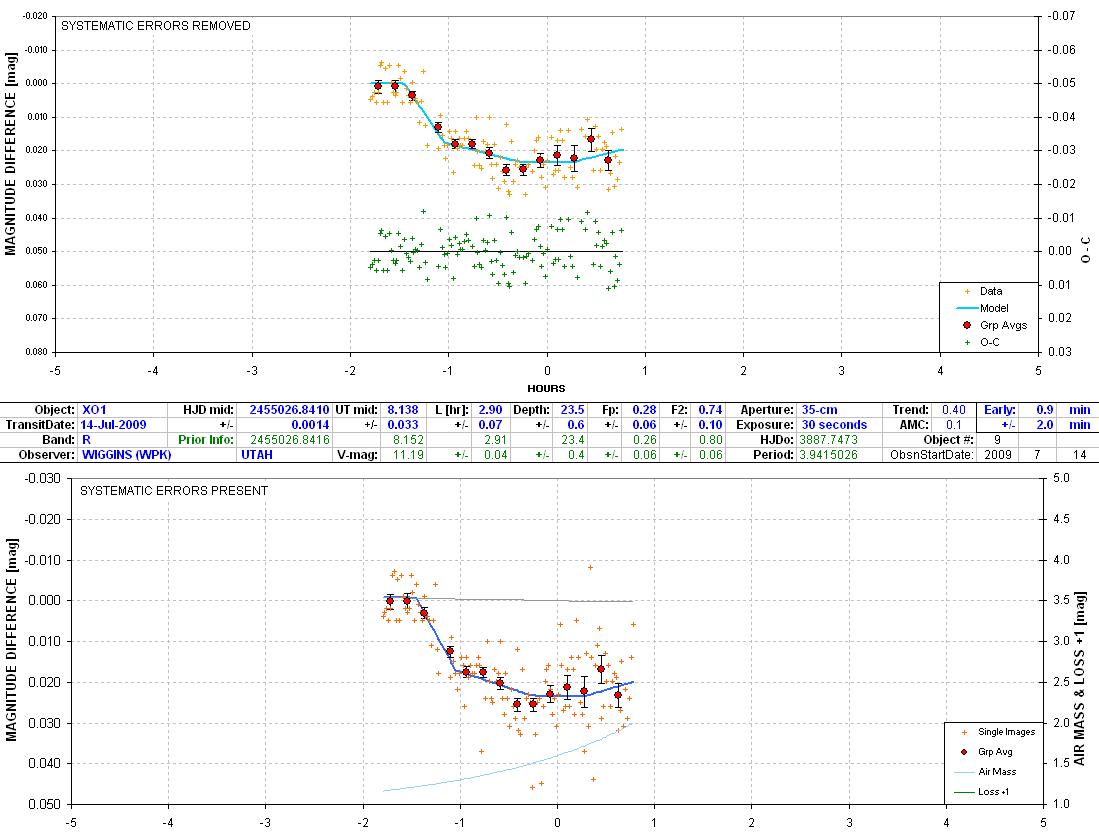
9714WPK
9612SG21
9608SG21
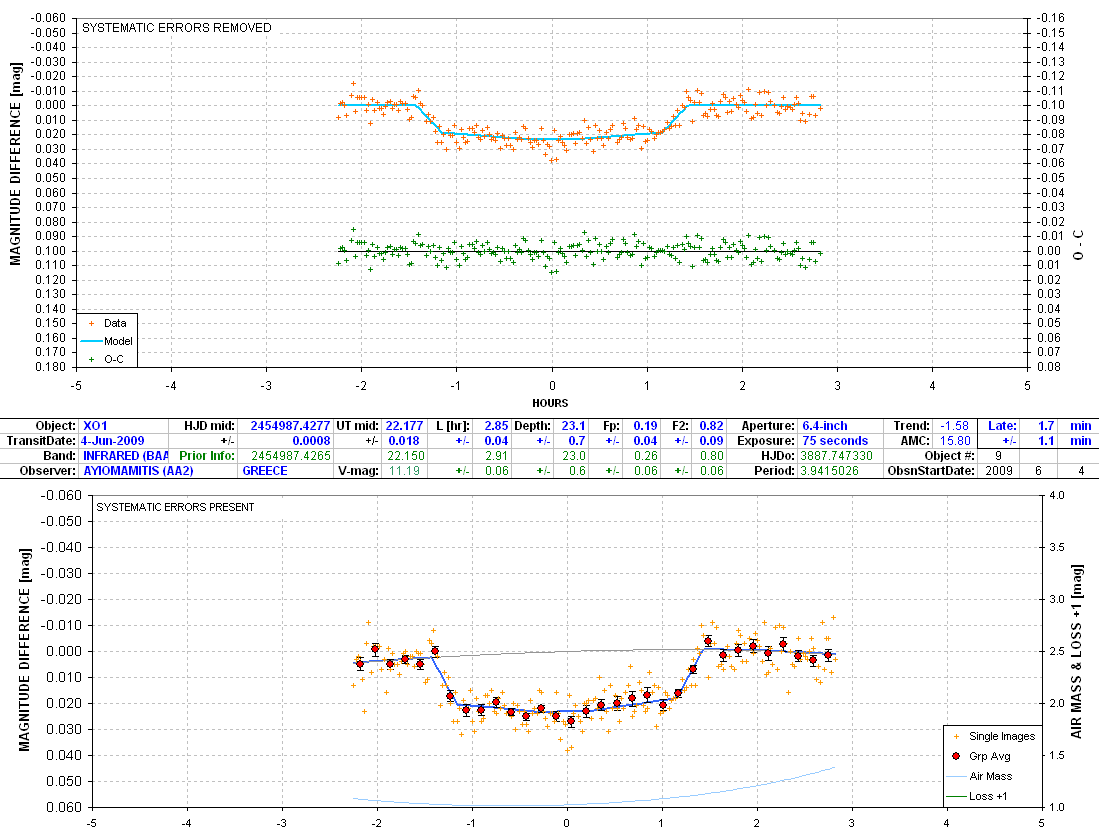
9604AA2
9531GJ2
9527GJ2
9524GBL1
9520NWP
9516GBL
9512GBL
9508GBL
9430GBL
9318GJ2
9302GBL1
9226GBL1
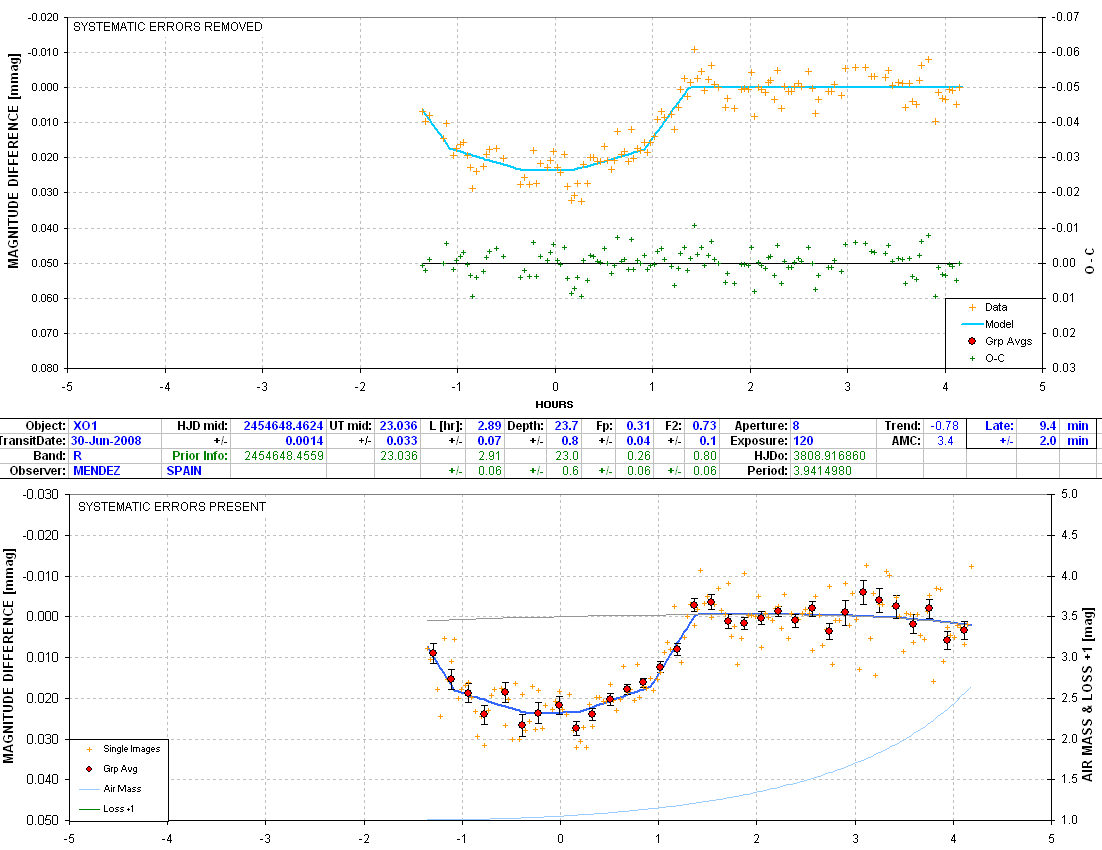
8630mndz
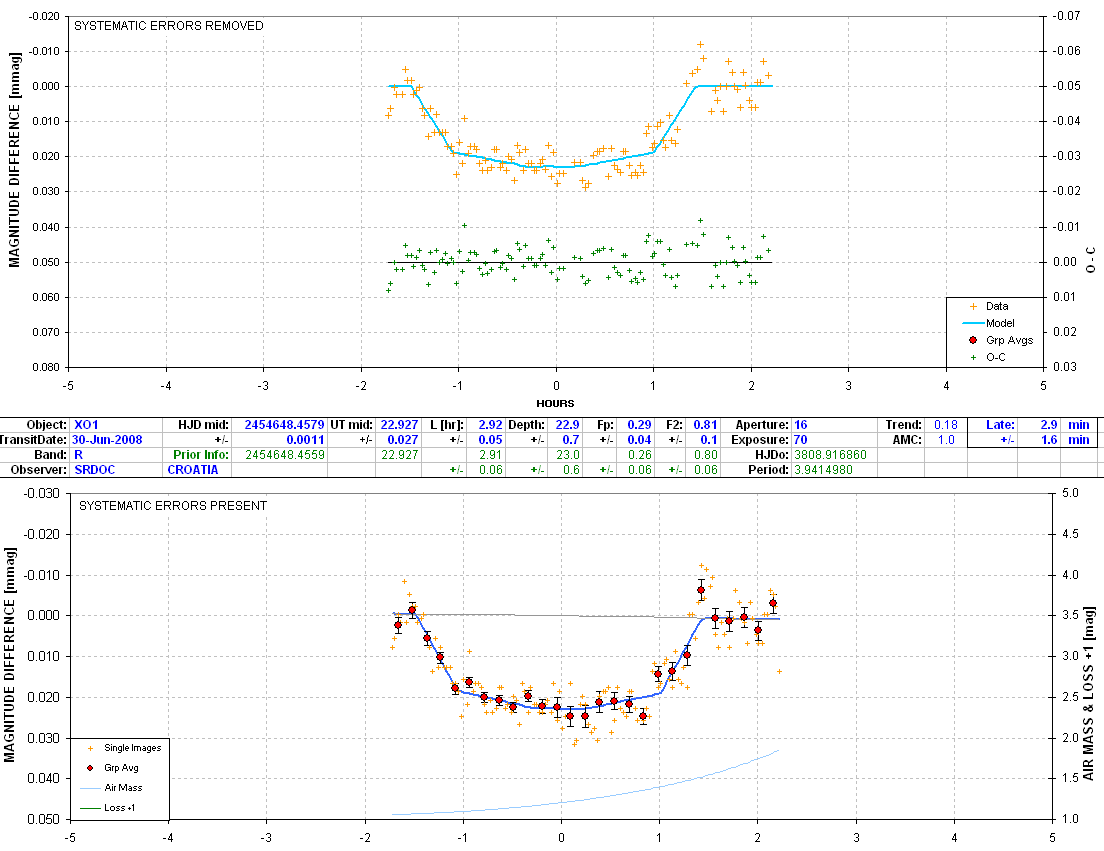
8630srdc
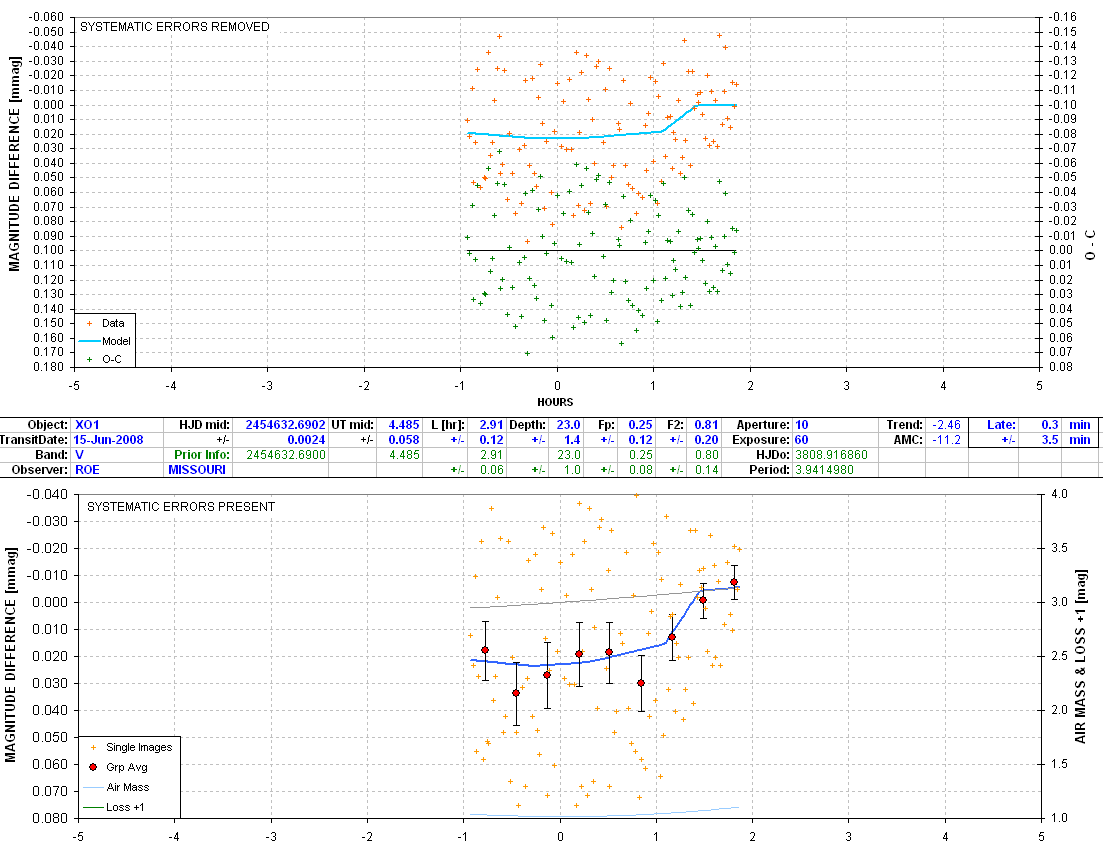
8615roeV
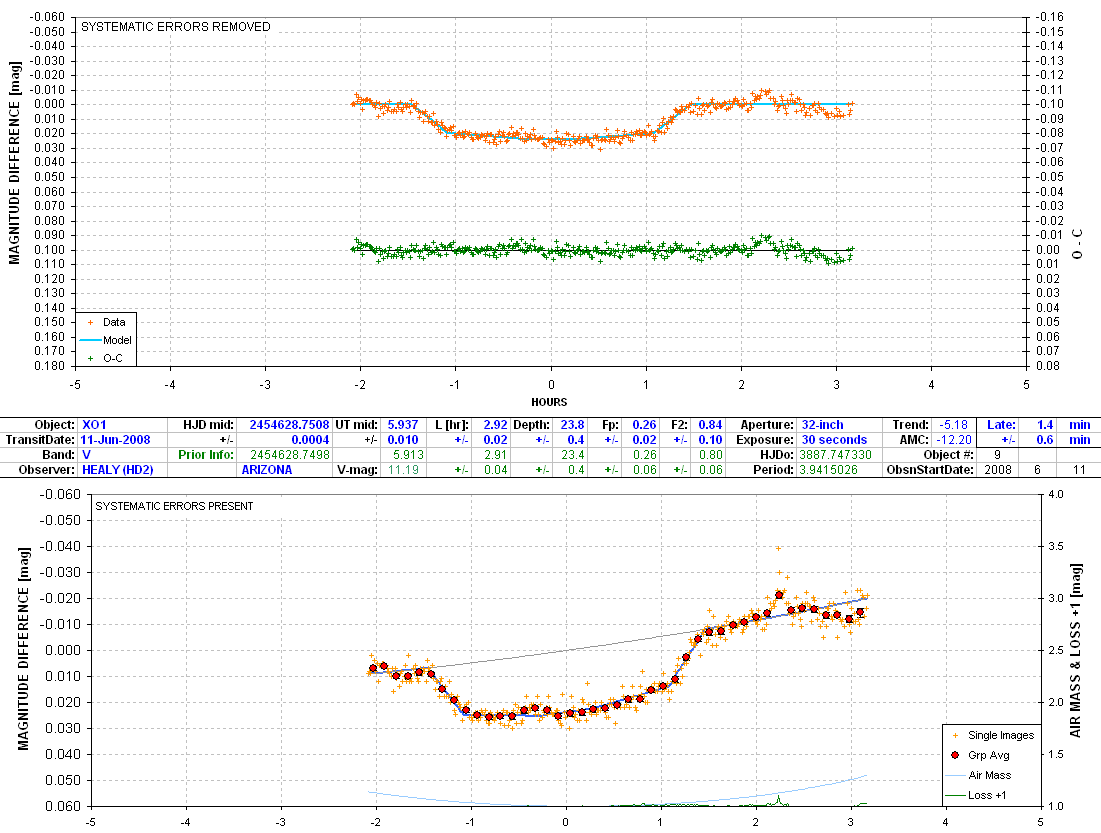
8611HD2
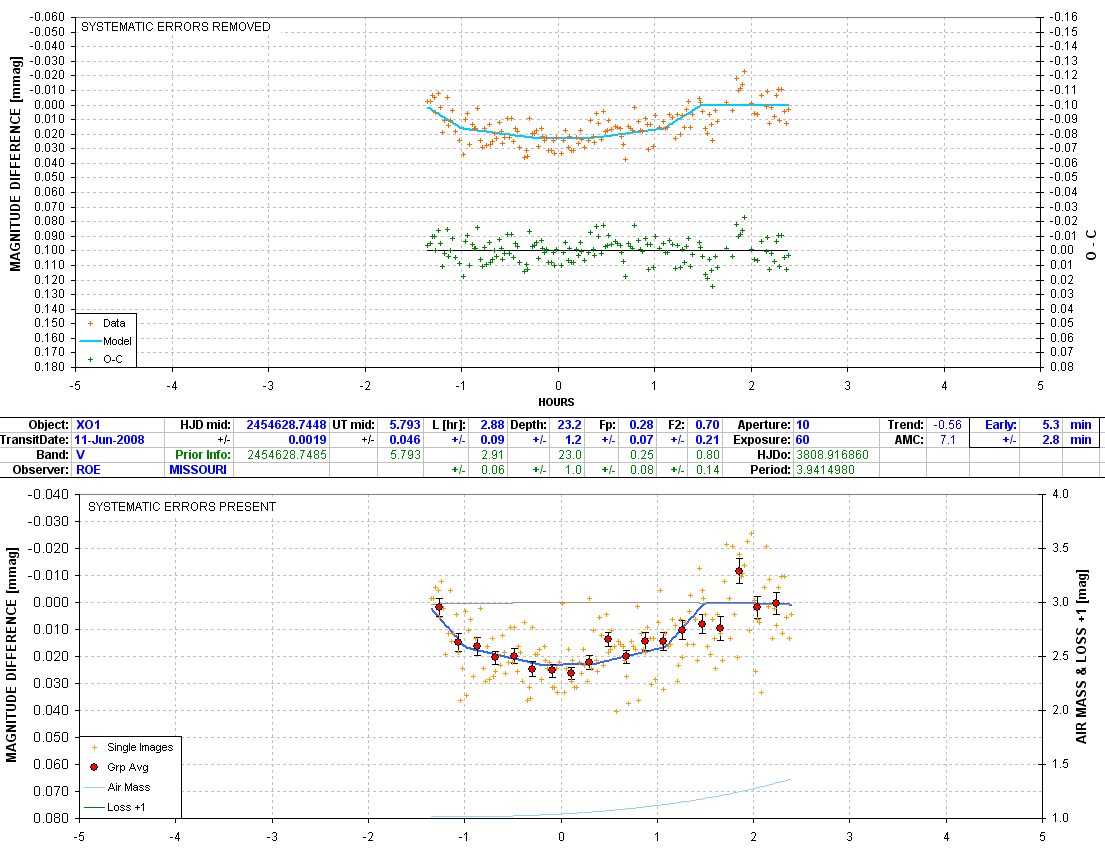
8611roeV
8607futR
8607futV
8607futB
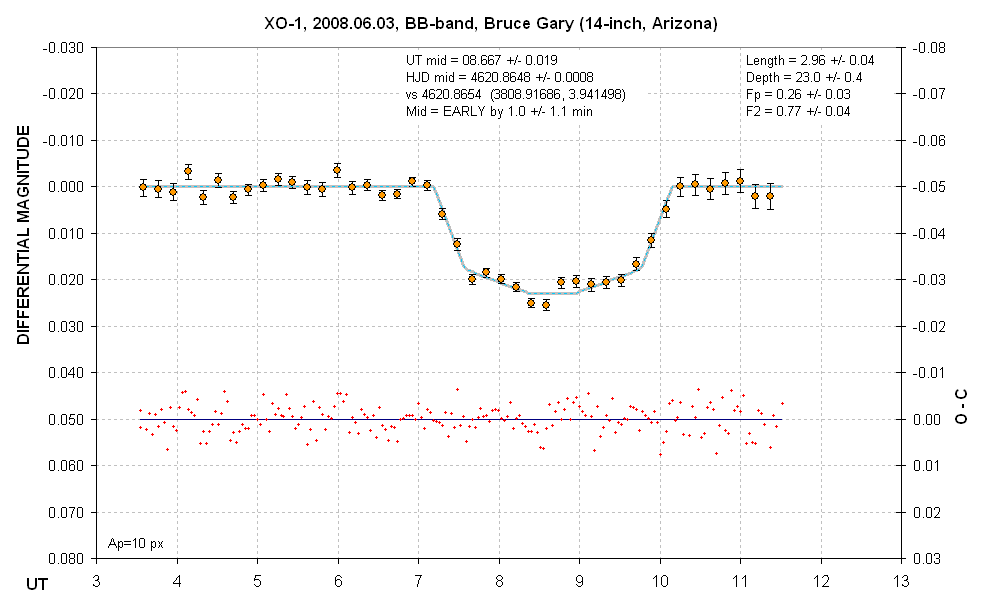
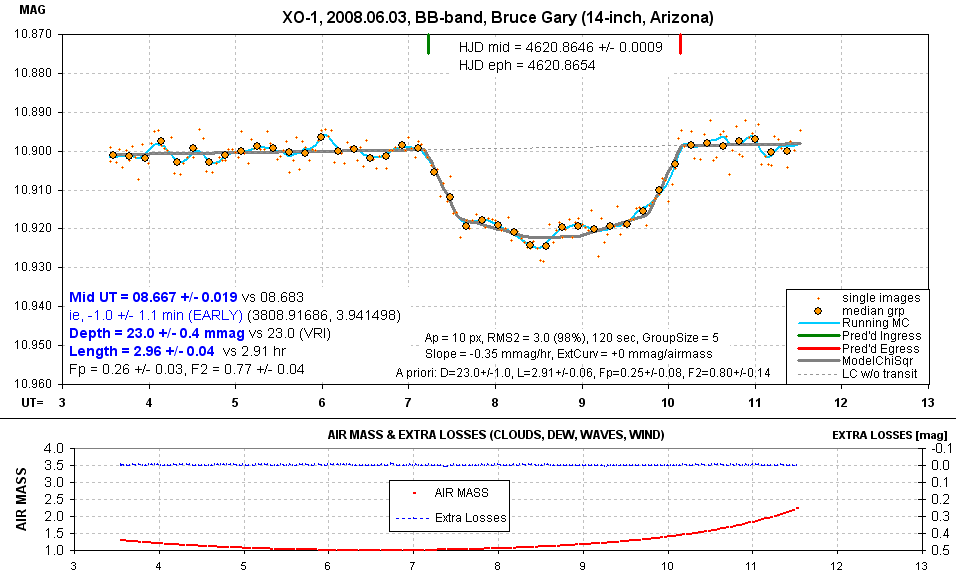
8603gary
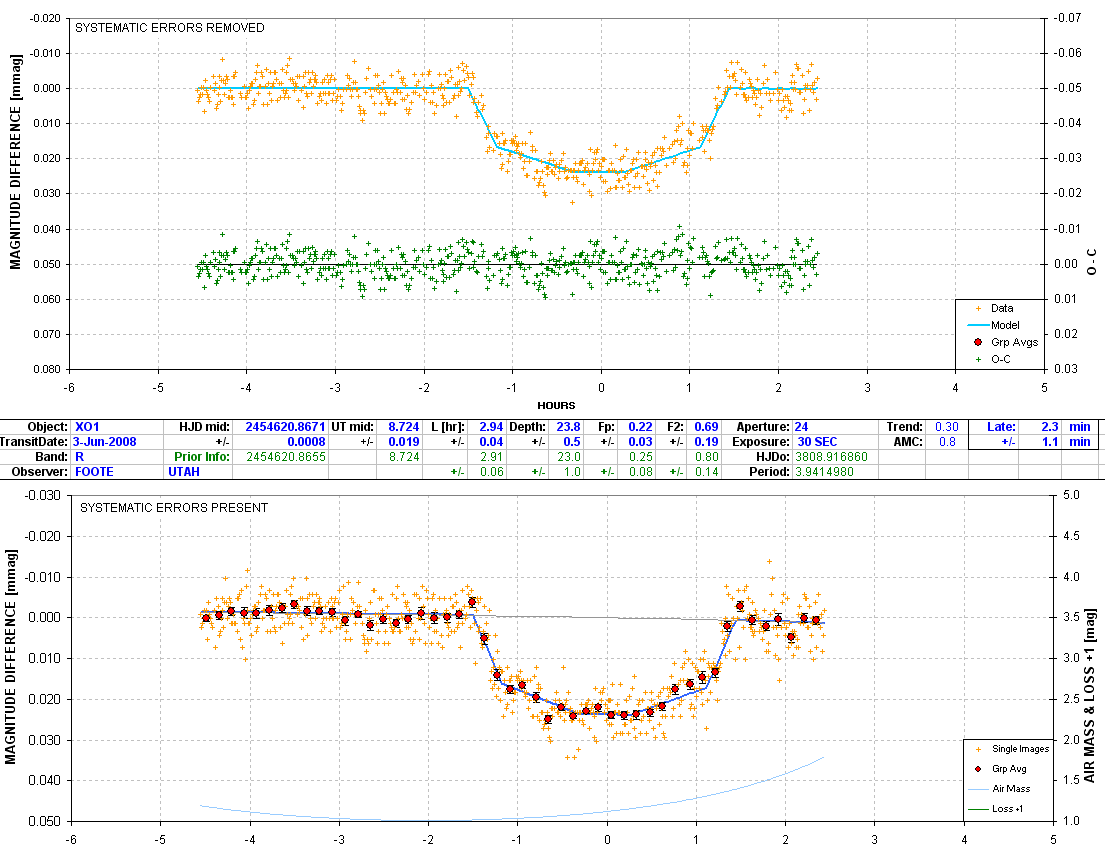
8603futR
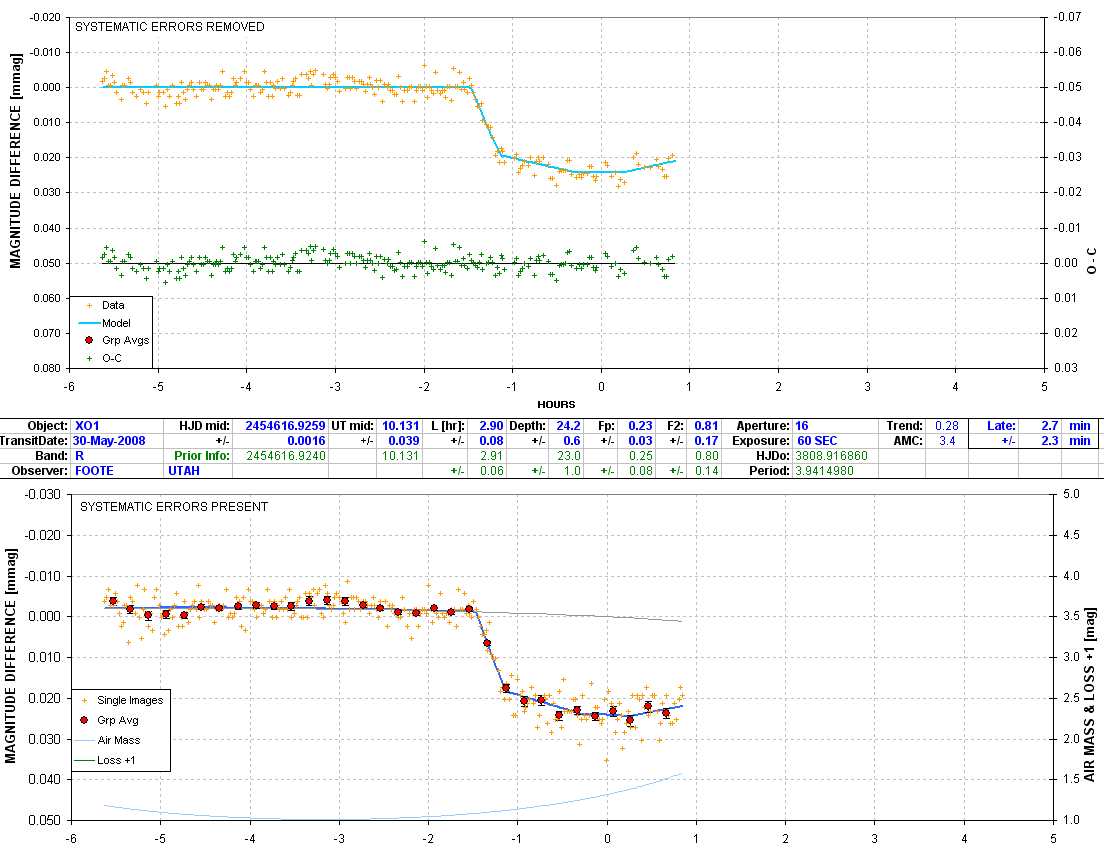
8530futR
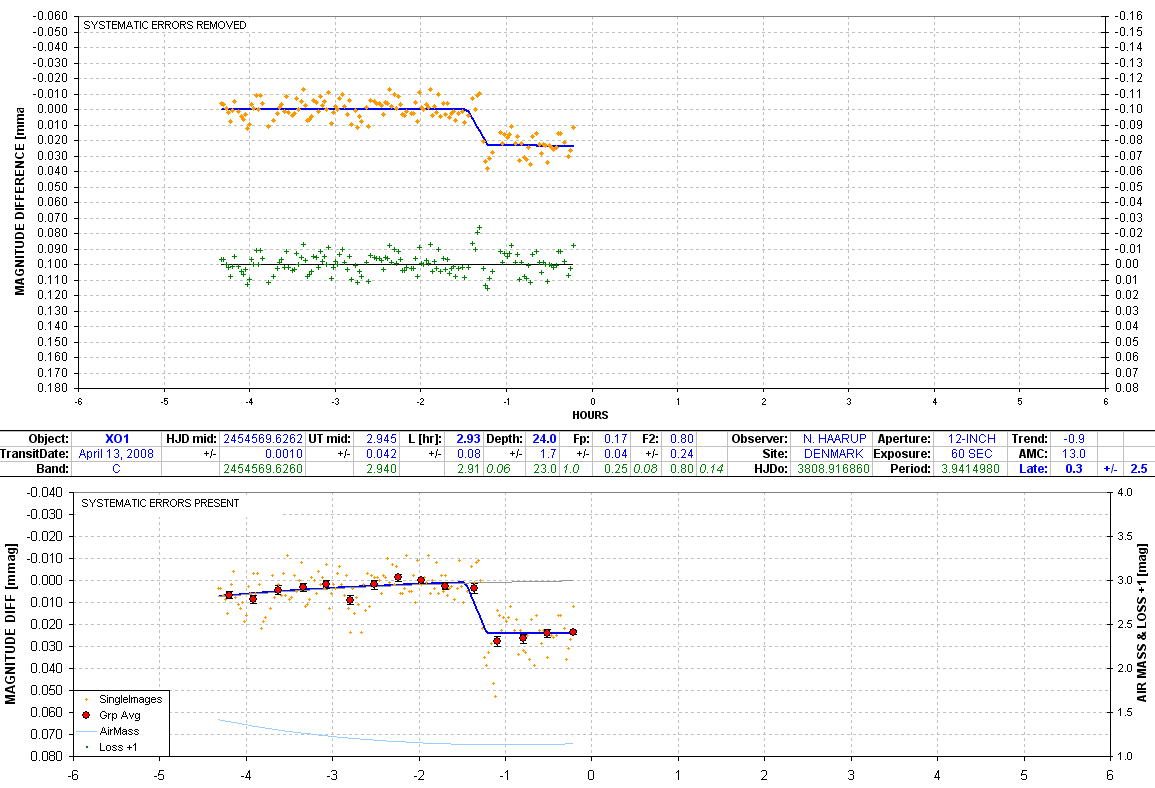
8413haar
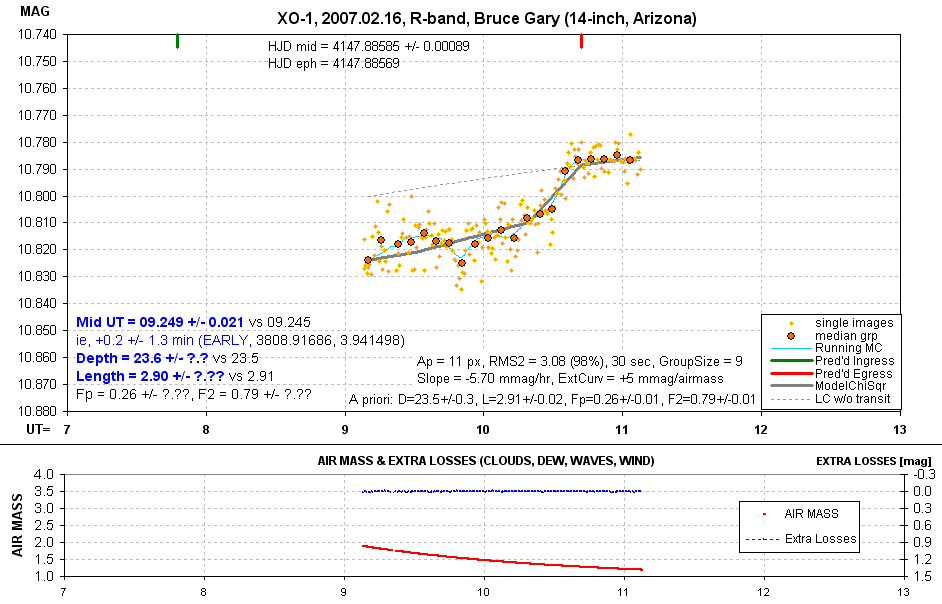
8405gary High air
mass ruined the early data and clouds affected the
post-egress data.
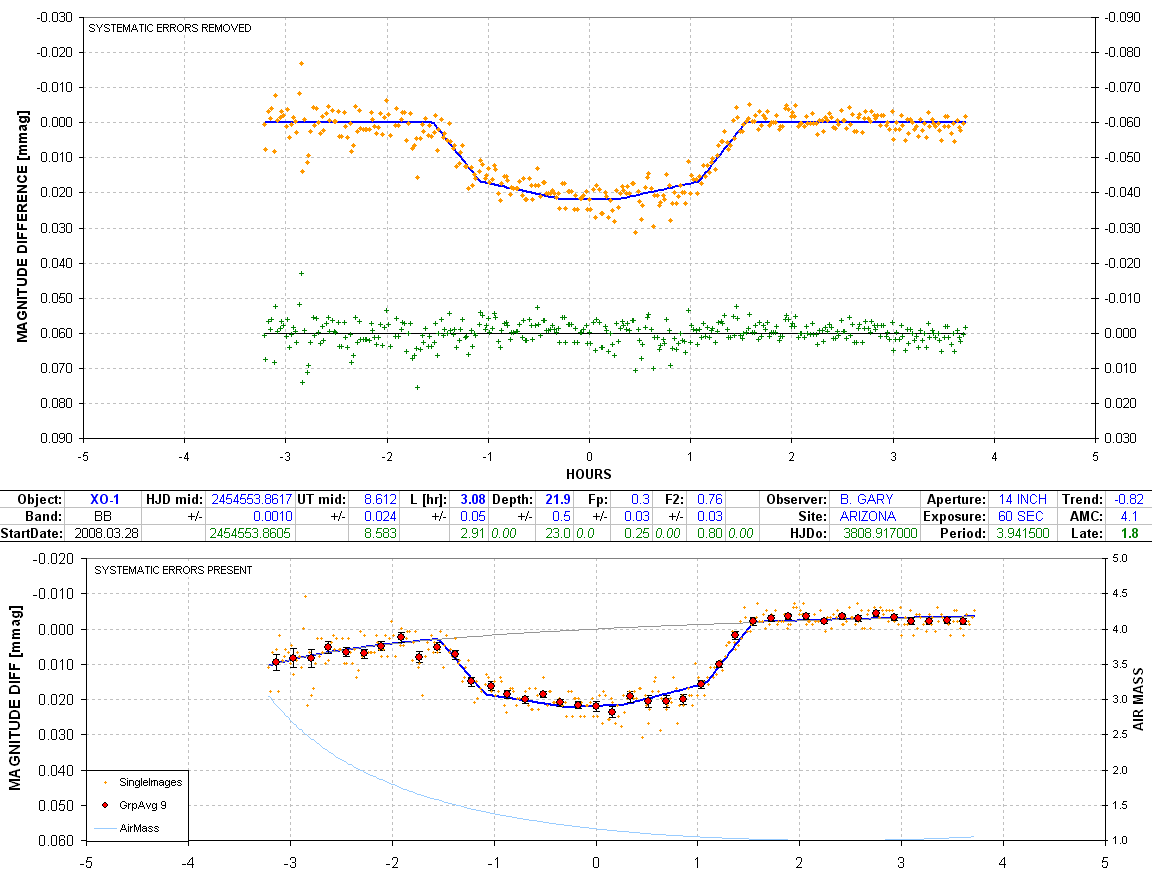
8328gary
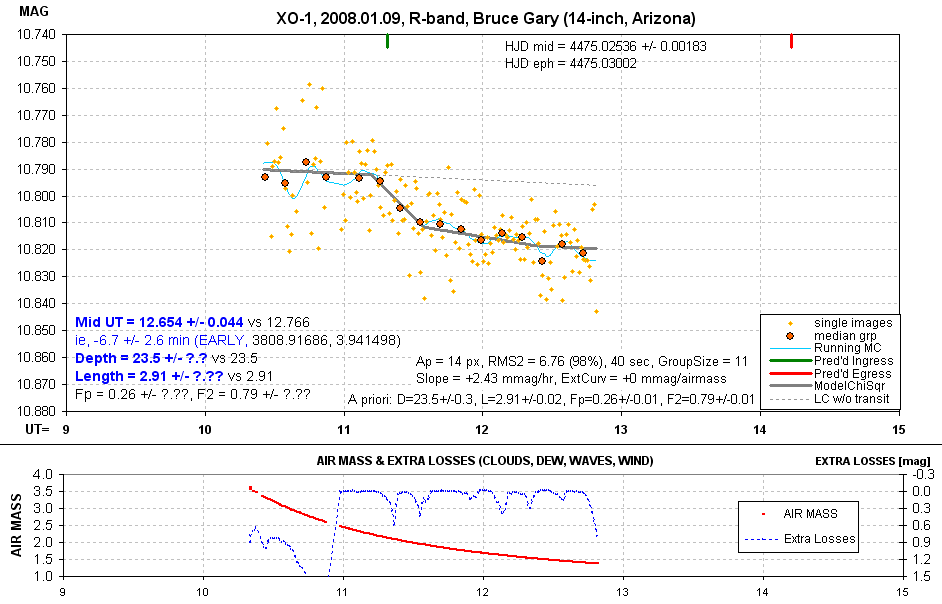
8109gary
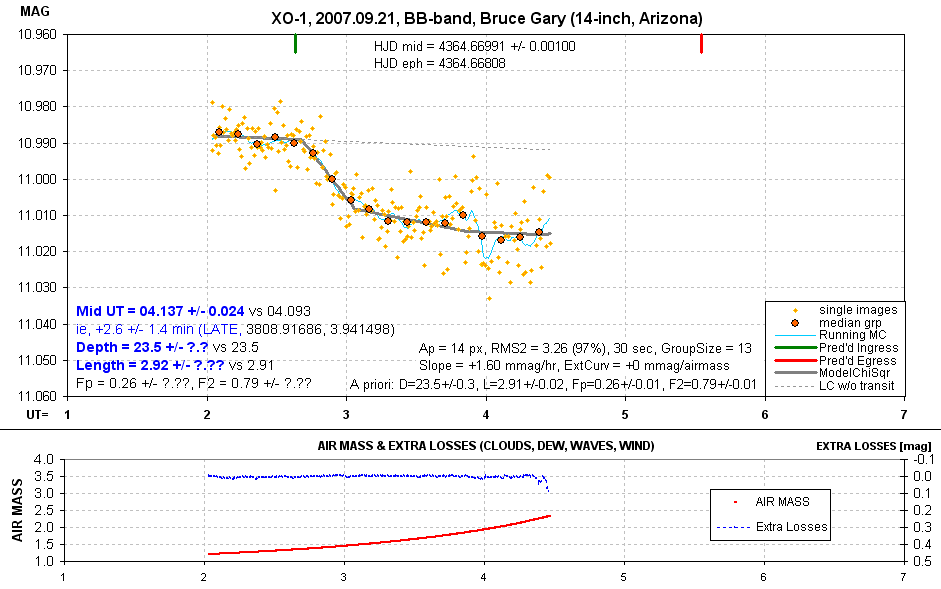
7921gary Wind, clouds and
lightning degraded data & forced early closure.
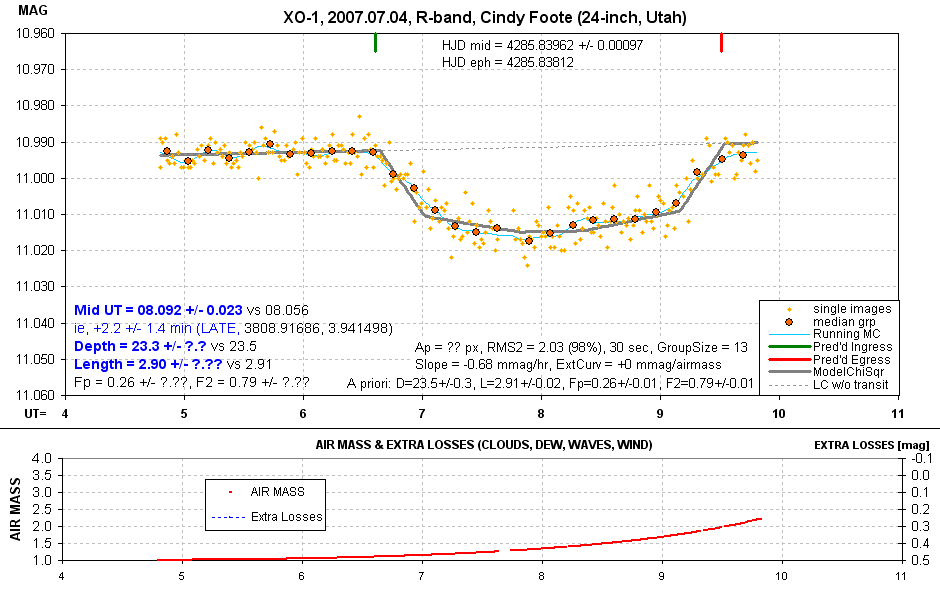
7704futR
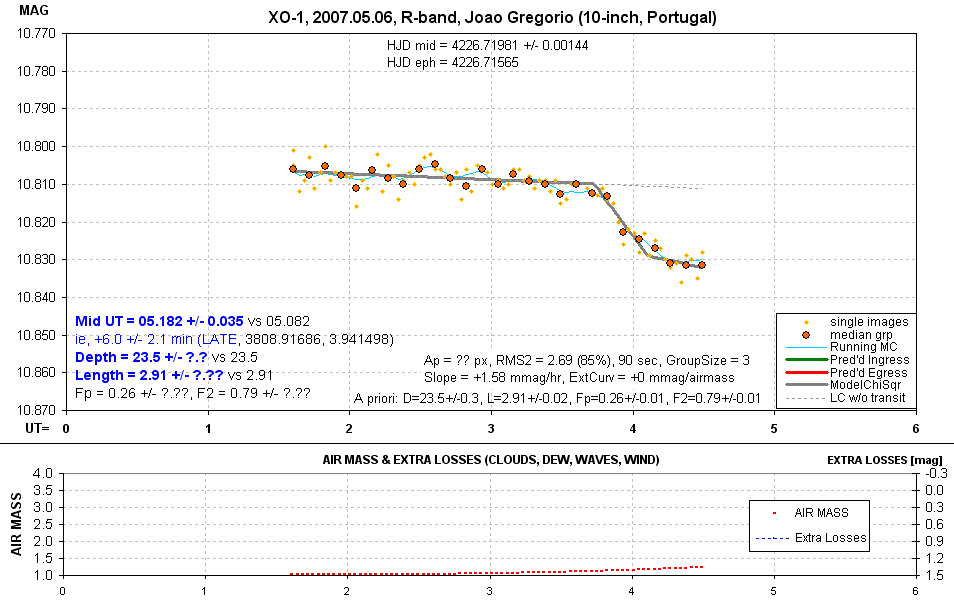
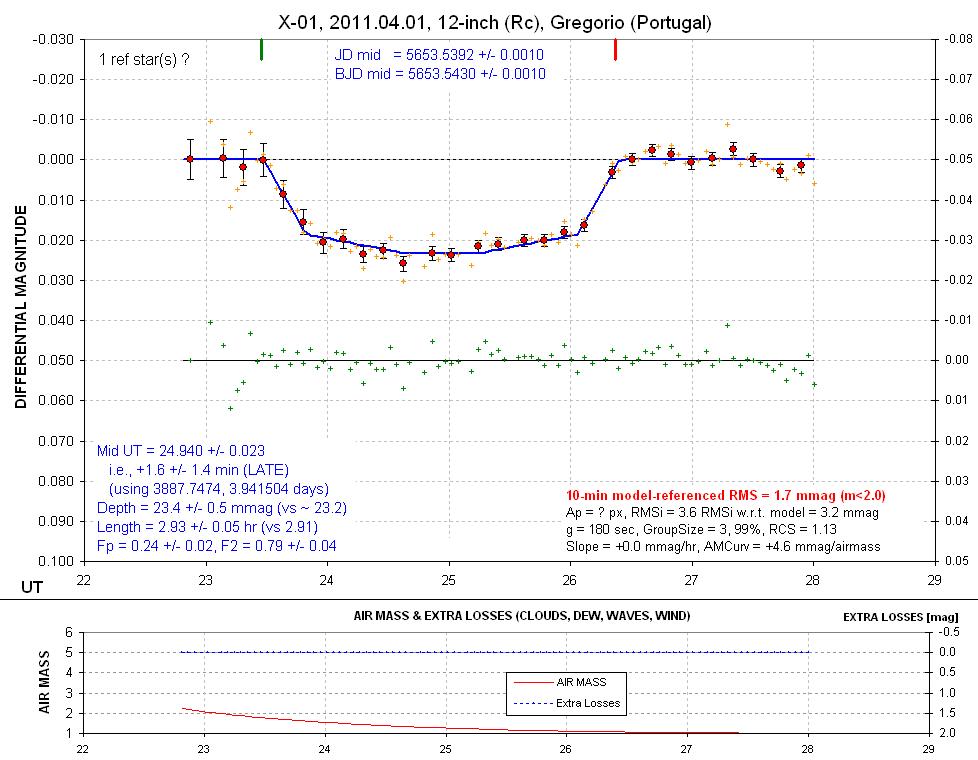
7506greg
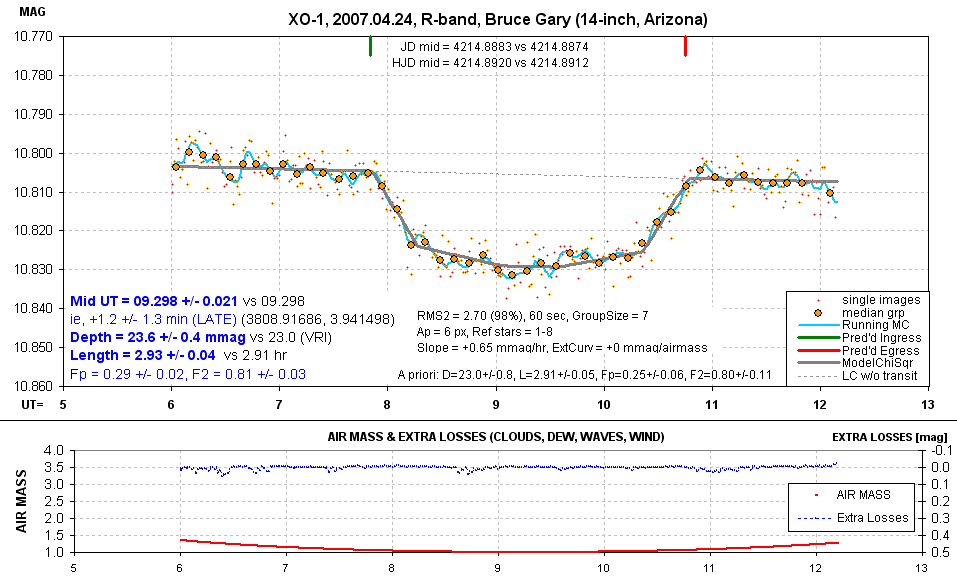
7424gary
7216gary
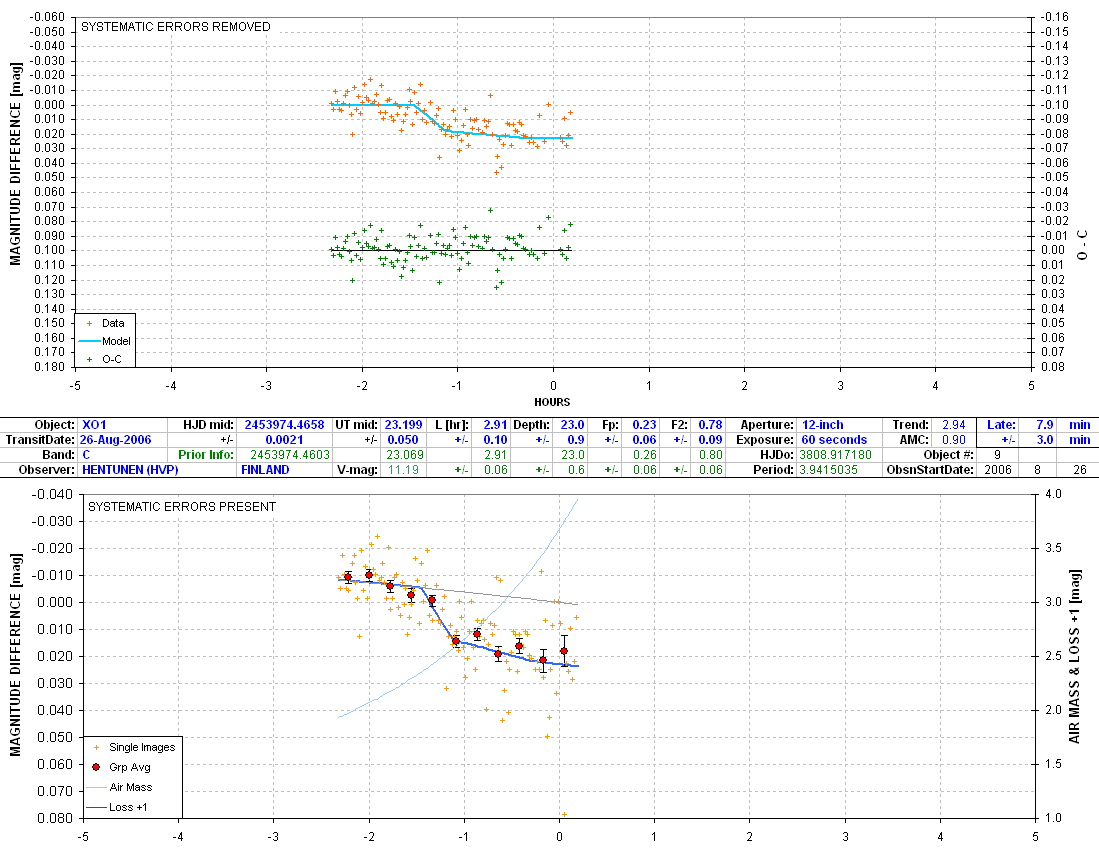
6826HVP1
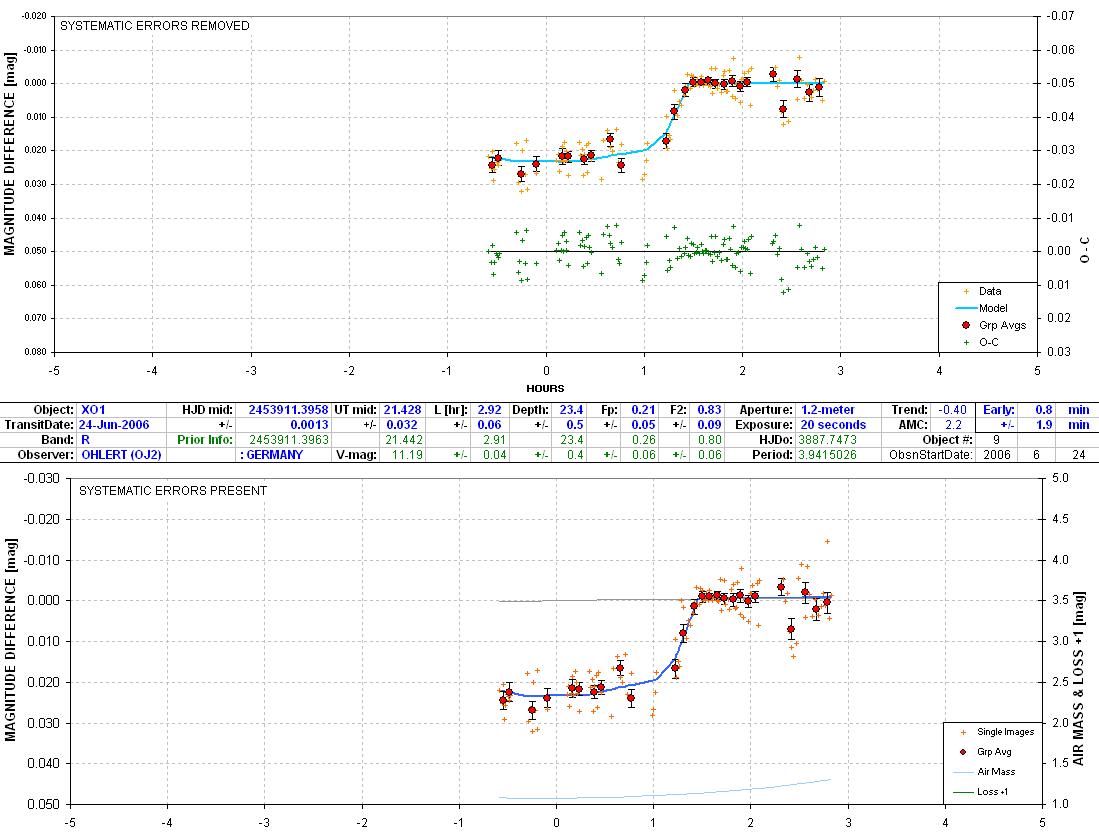
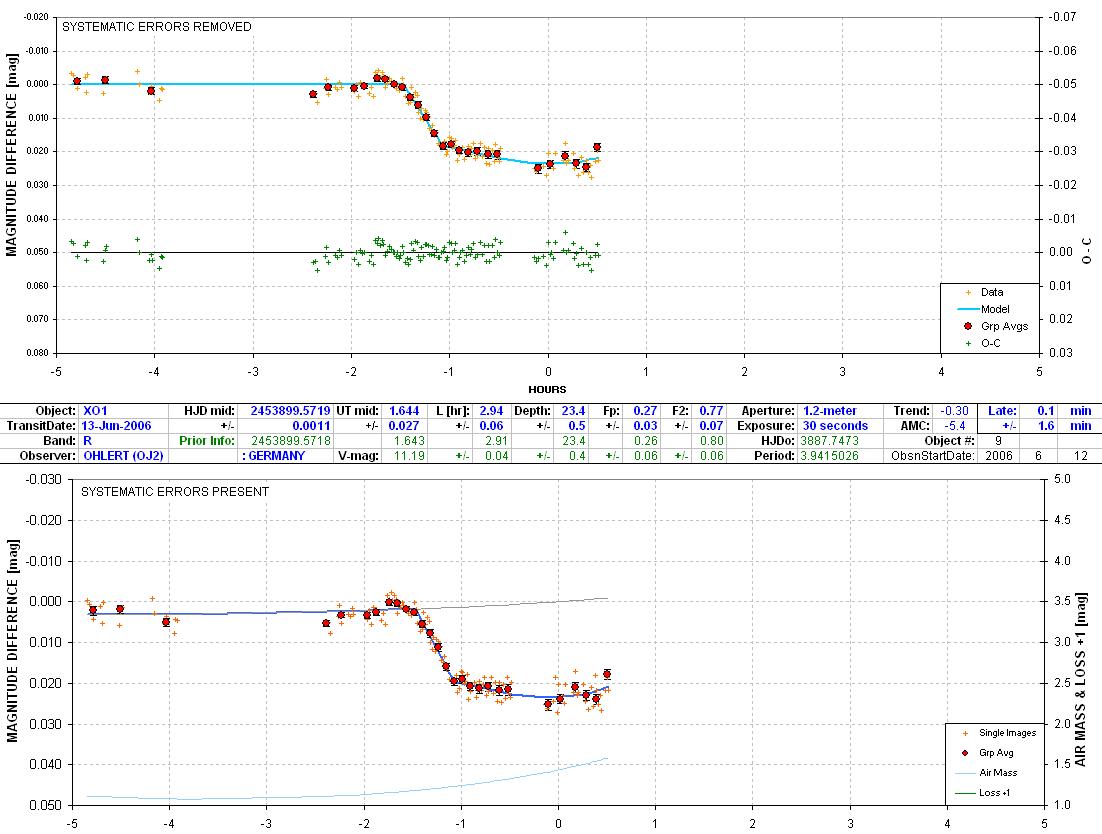
6624OJ2
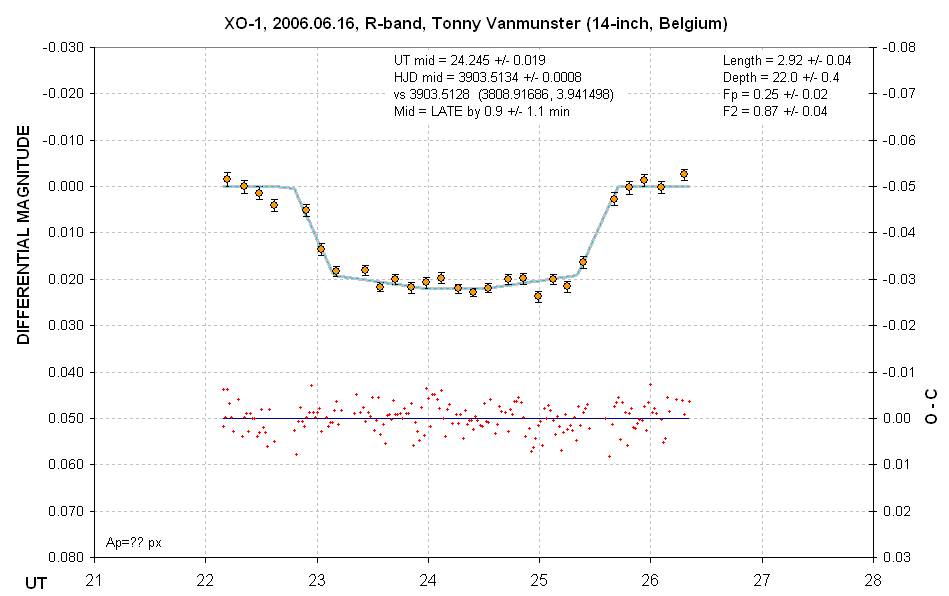
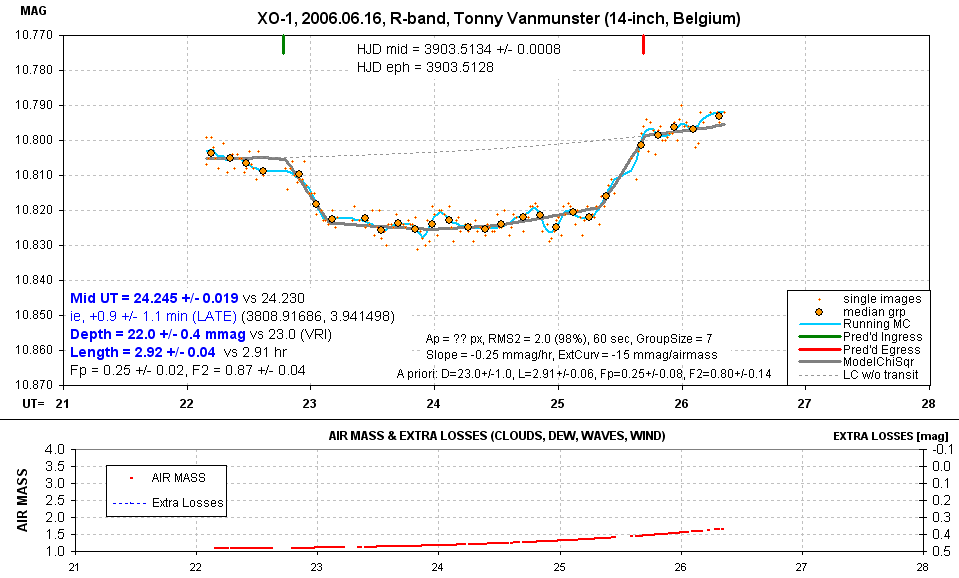
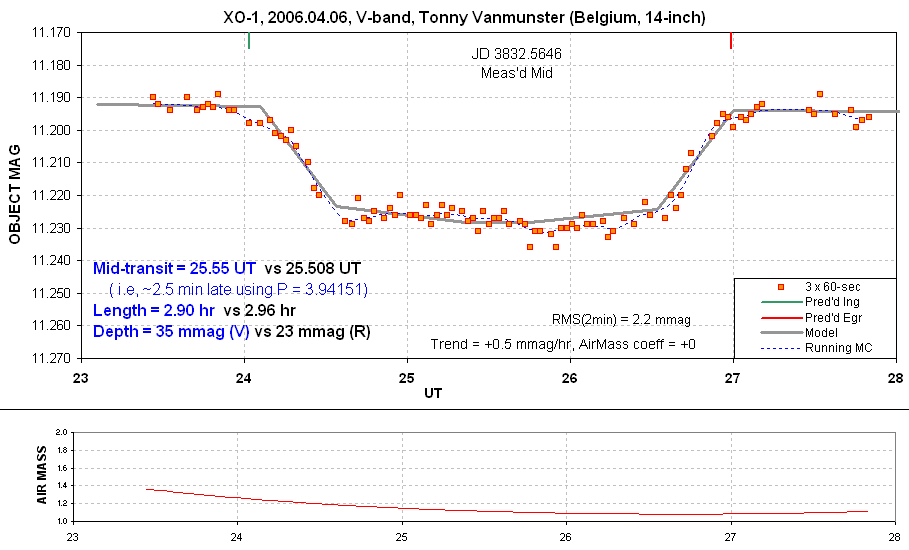
6617vanm
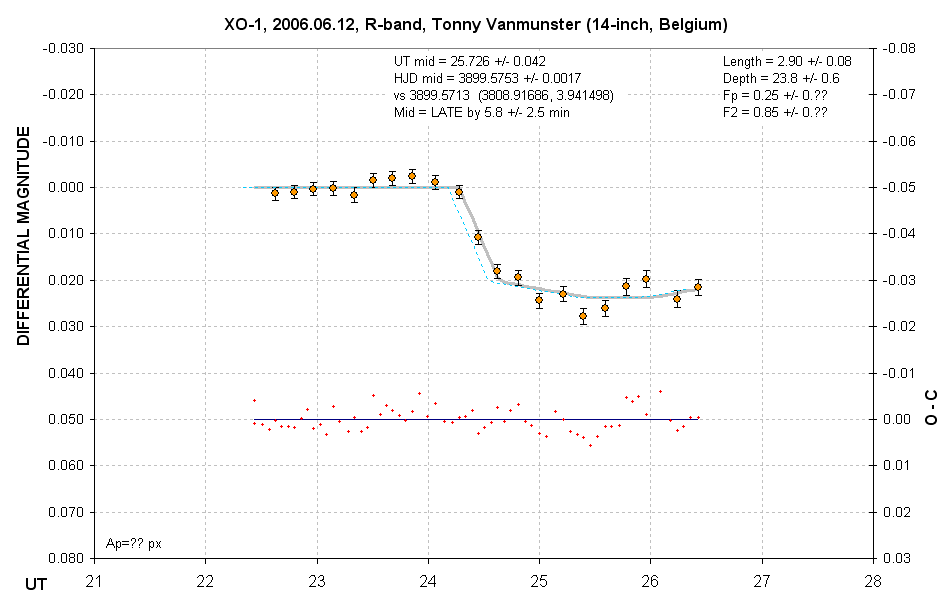
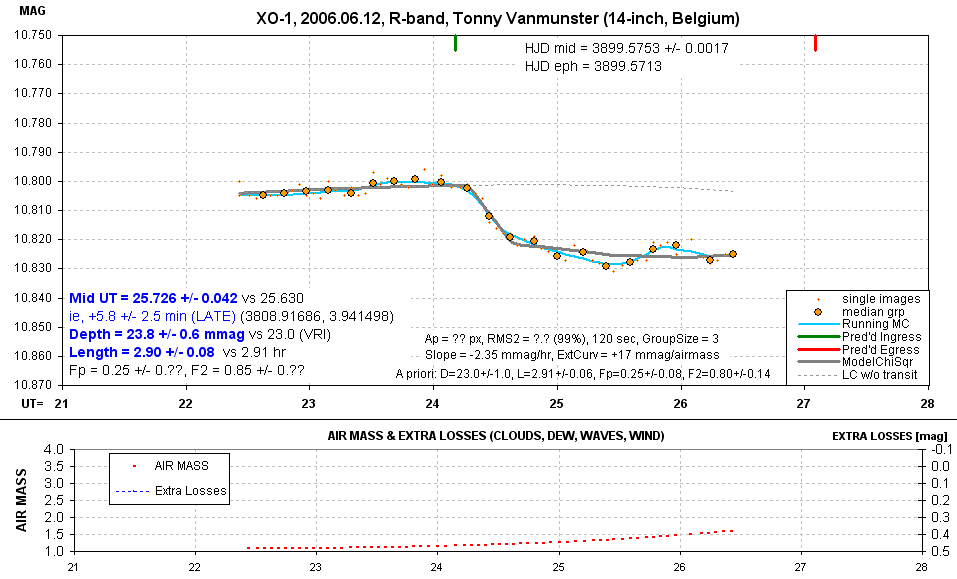
6612OJ2
6613vanm
6601futV
6601futR
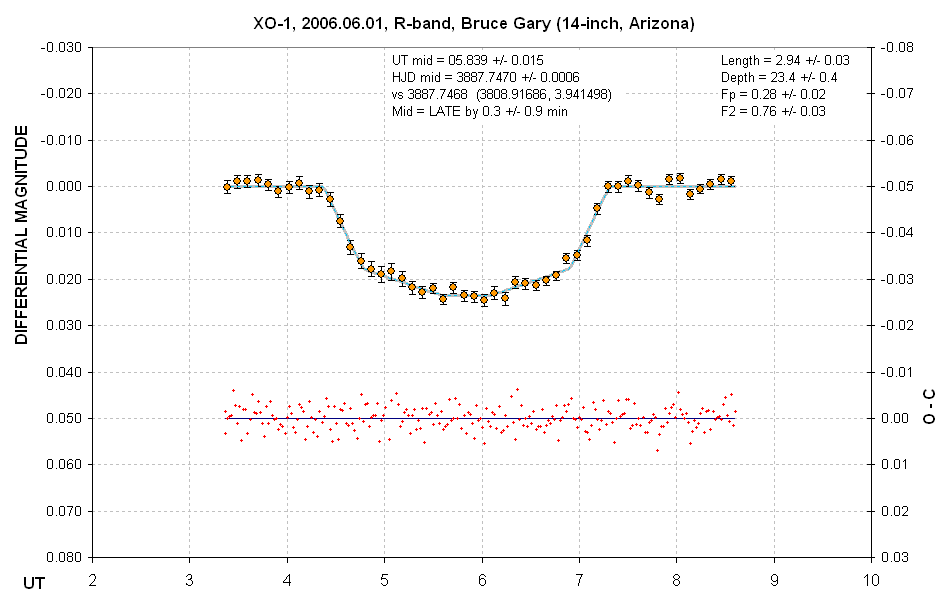
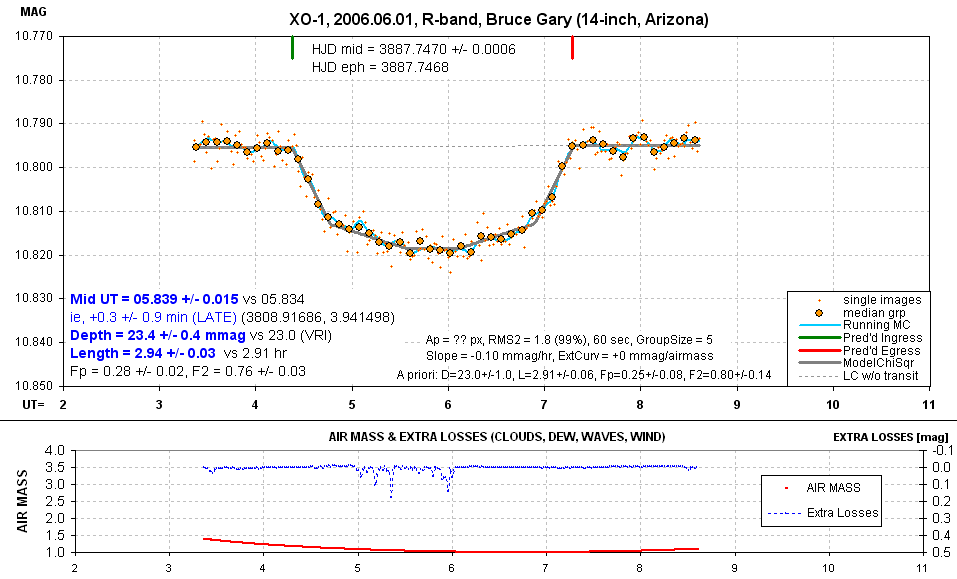
6601gary
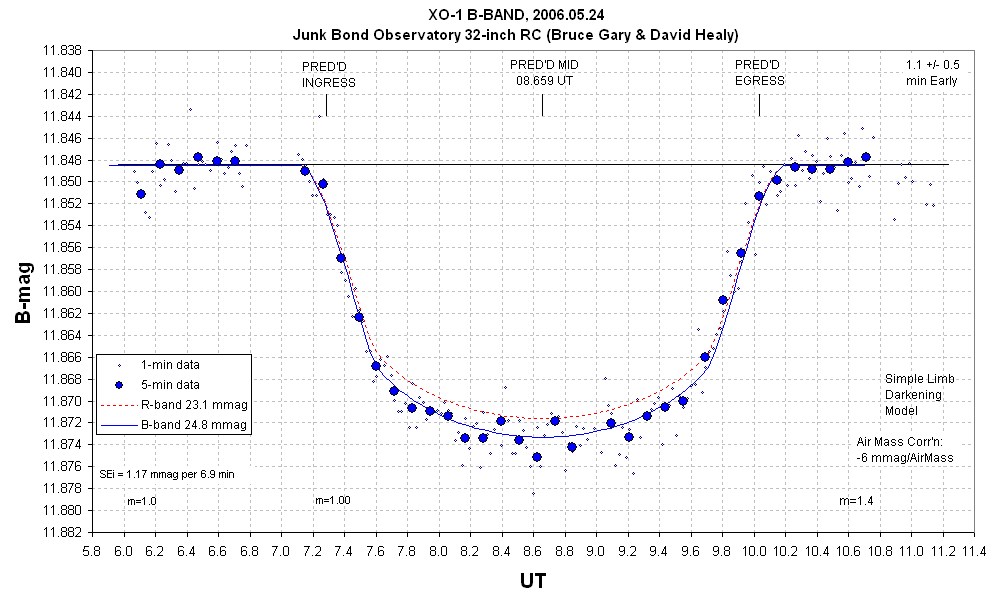
6424heal Junk Bond
Observatory 32-inch allowed B-band observing. Depth
was greater, as expected.
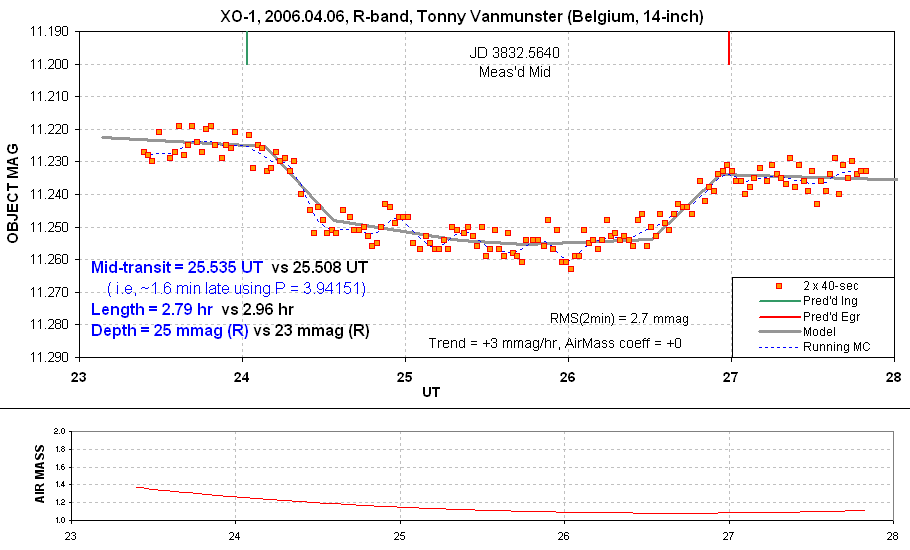
6406vanR
6406vanV Depth
sortof deep. "Low frequency" variations.
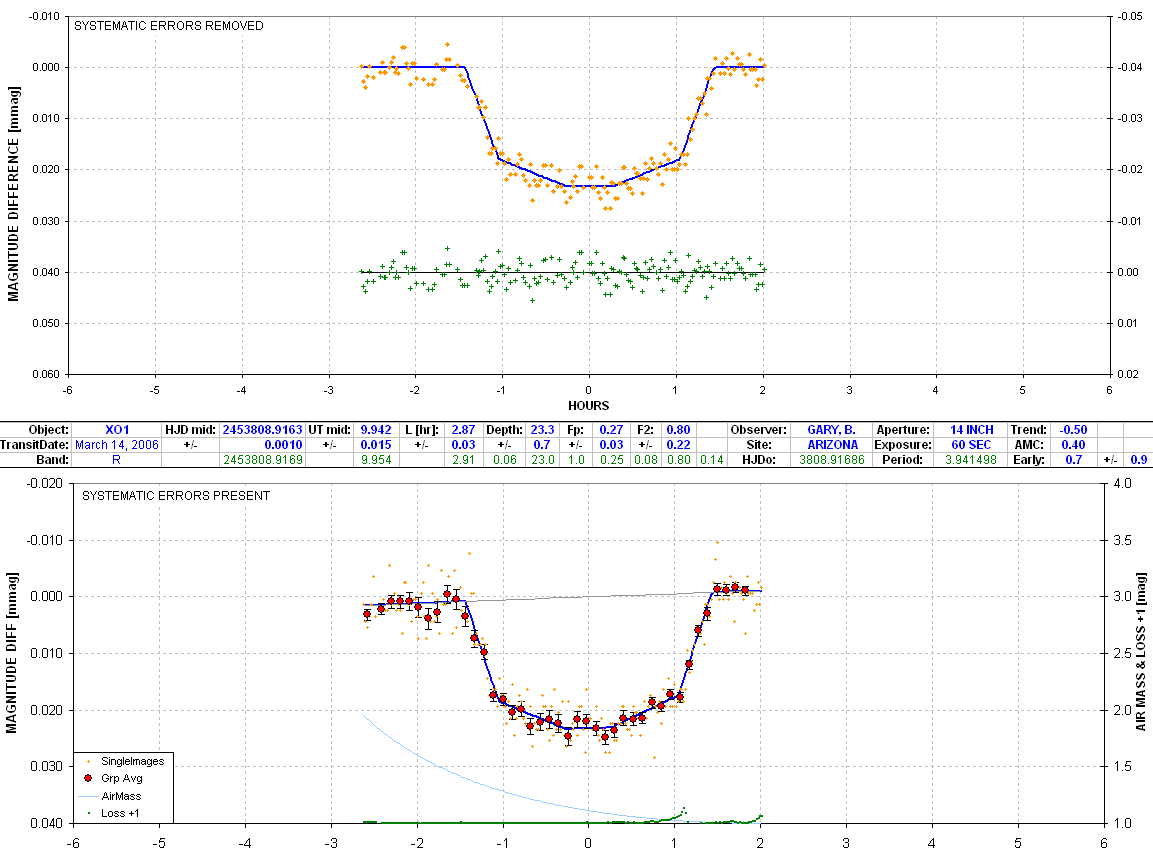
6314gary This LC was used
to establish HJDo for the discovery paper ephemeris.
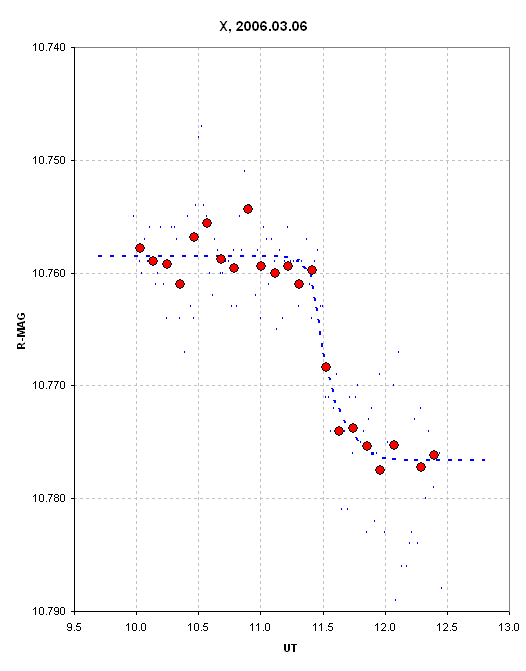
6306gary 2006.03.06.
UT mid ~12.88 (i.e., 11.40 + 1.48).
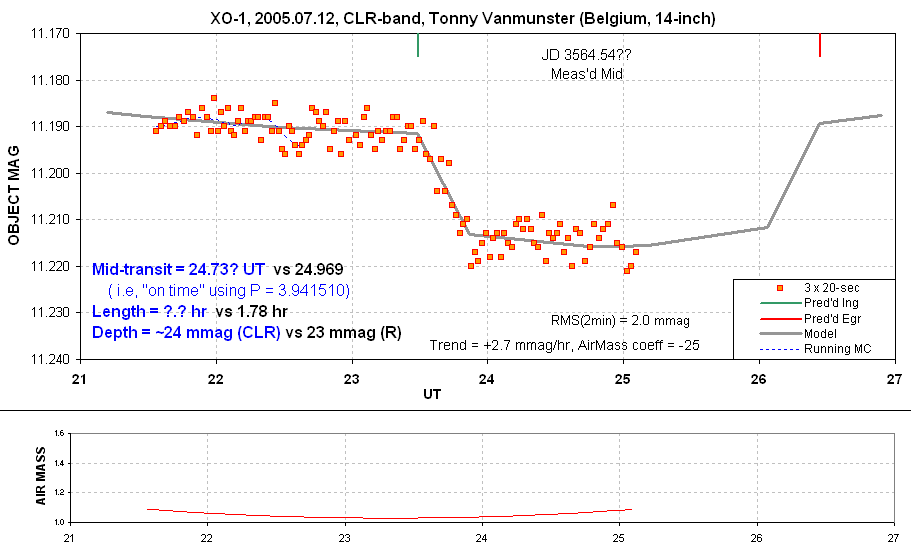
5712vanC
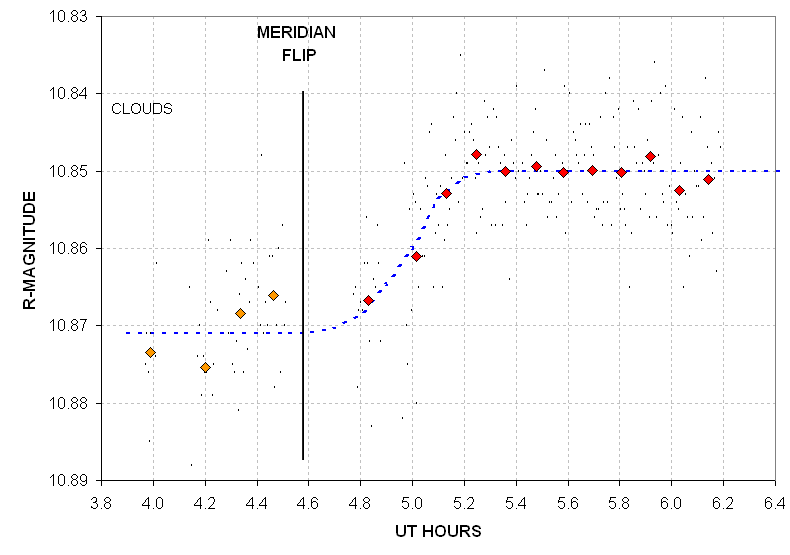
5705gary 2005.07.05.
UT mid ~03.74 +/- 0.10.
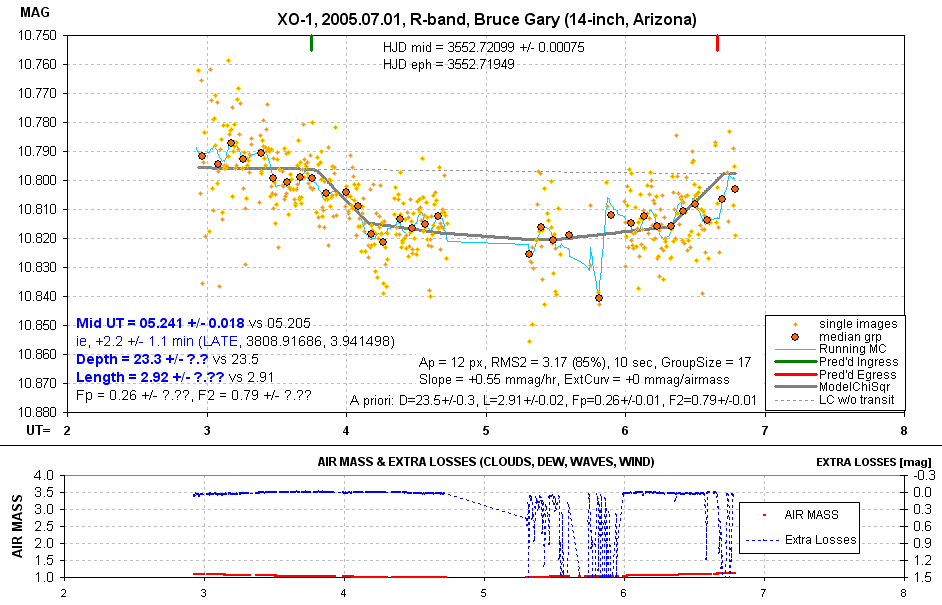
5701gary There were
lots of problems with this data: clouds, poor tracking,too-short
exposure times, etc.
Light Curves
- Professional
More coming
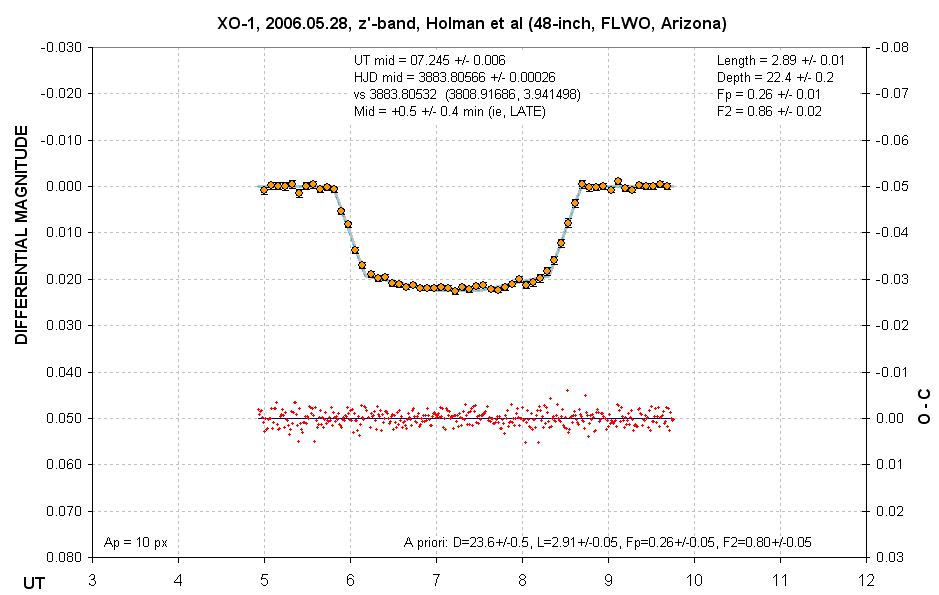
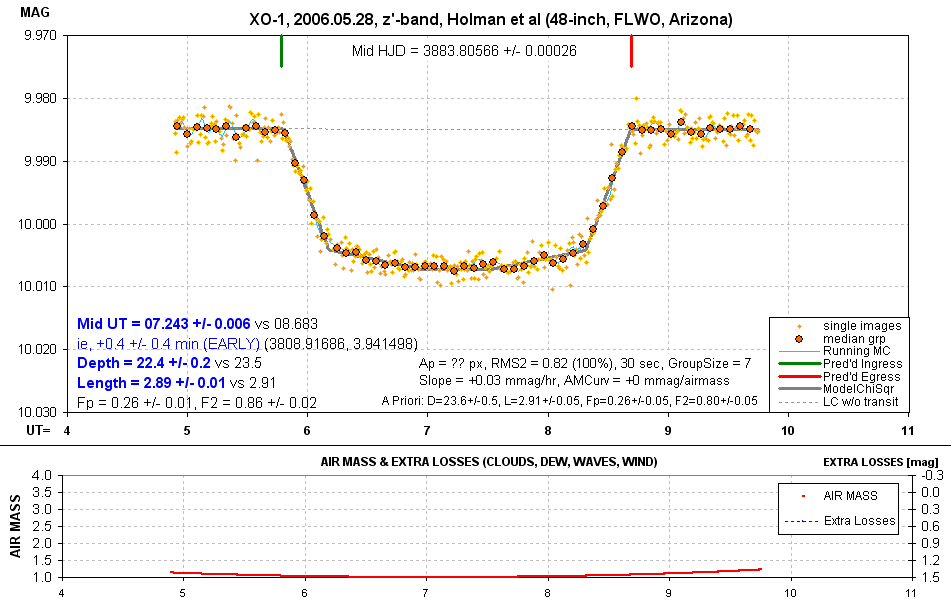
6528holz
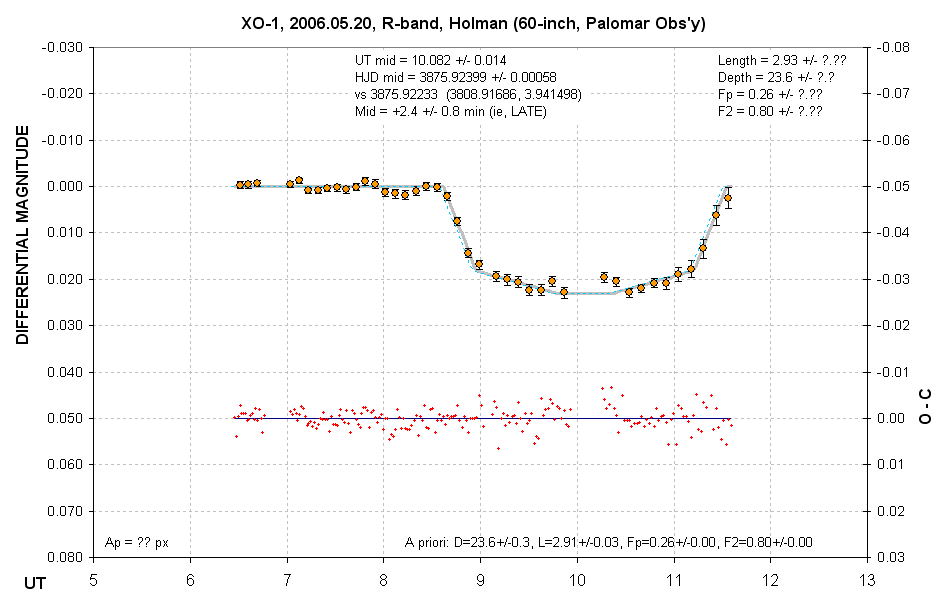
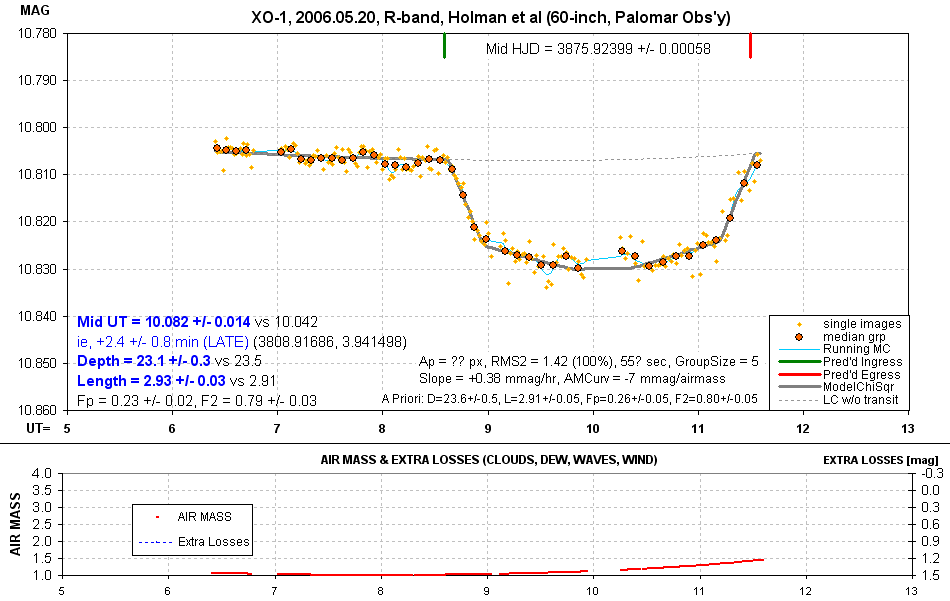
6520holR
(this data downloaded from NStED)
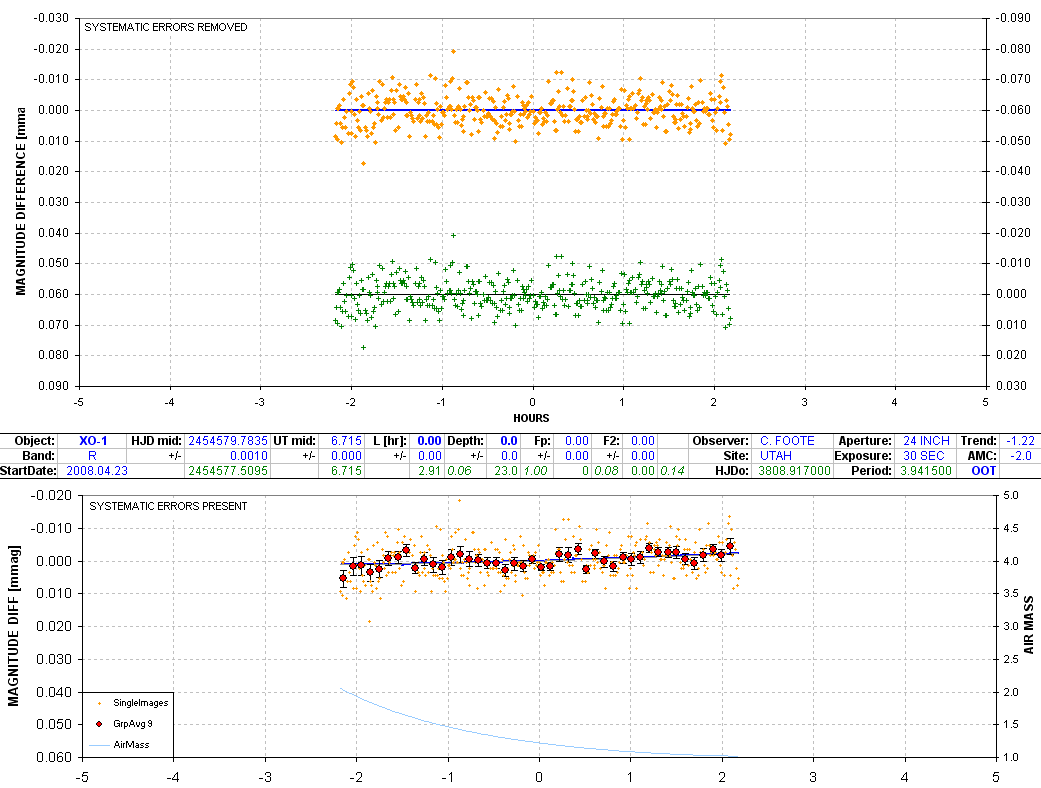
Out-of-Transit (OOT) Light
Curves
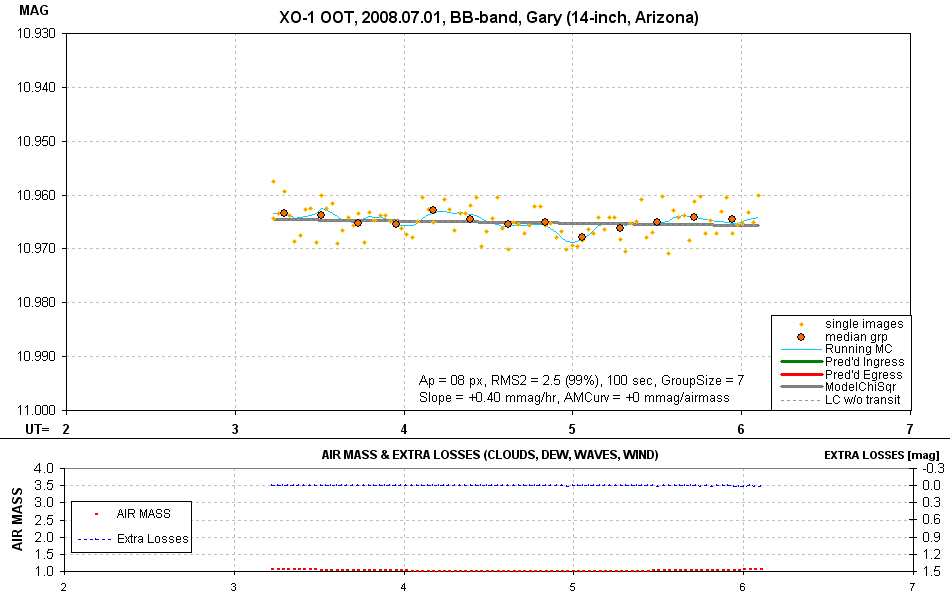
8701gary
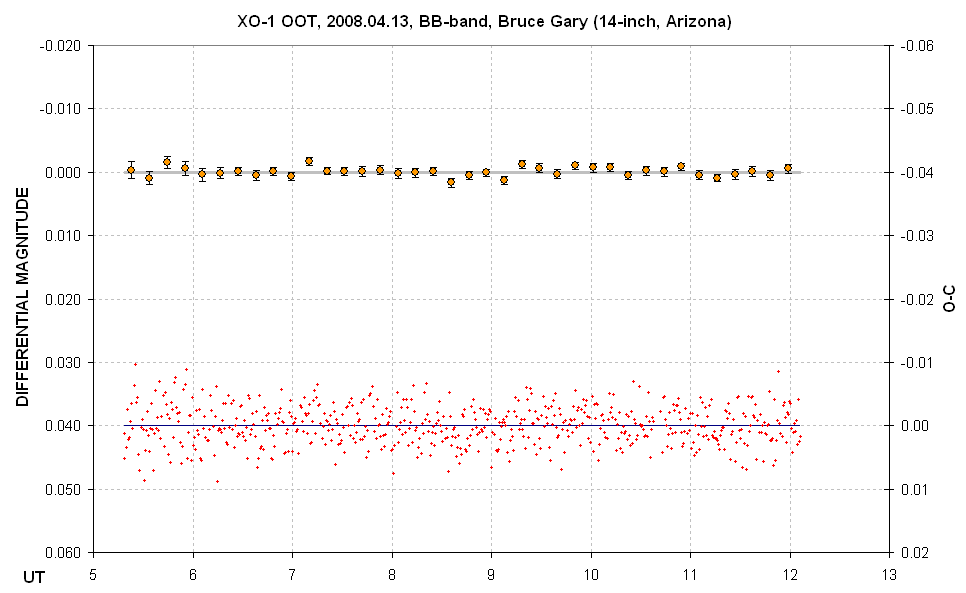
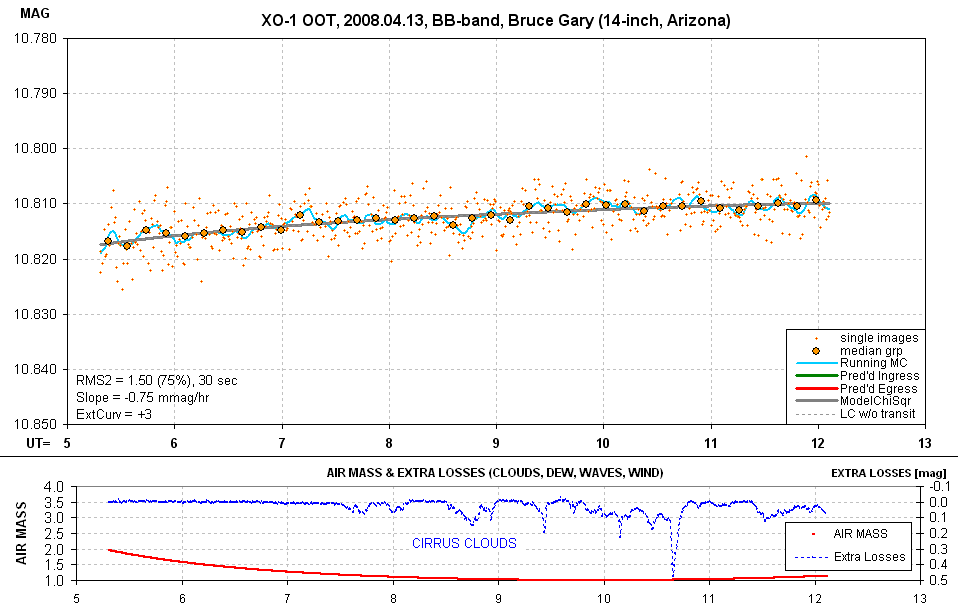
In spite
of cirrus clouds, with losses up to ~1/2 magnitude,
the LC is featureless at the 1 mmag level.
I have a
couple dozen OOT observing sessions from May, 2006
that I'll add to this section when time permits.
All-Sky Photometry
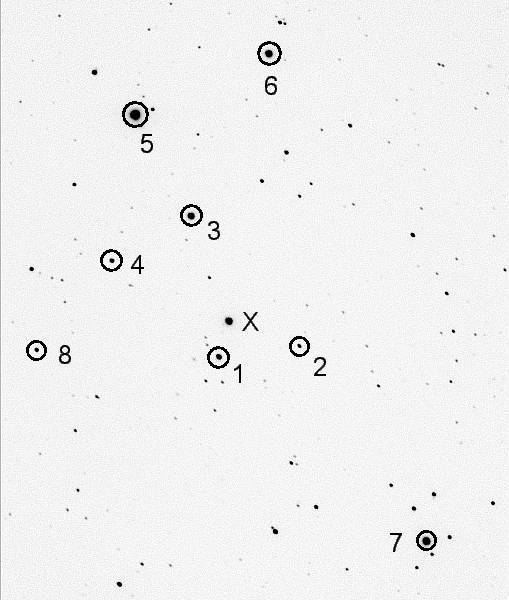
Estimated SEs are 0.025, 0.035, 0.030, 0.040 magnitude,
based on RMS residuals of fit to three
Landolt star regions (N = 29, 35, 18, 14).
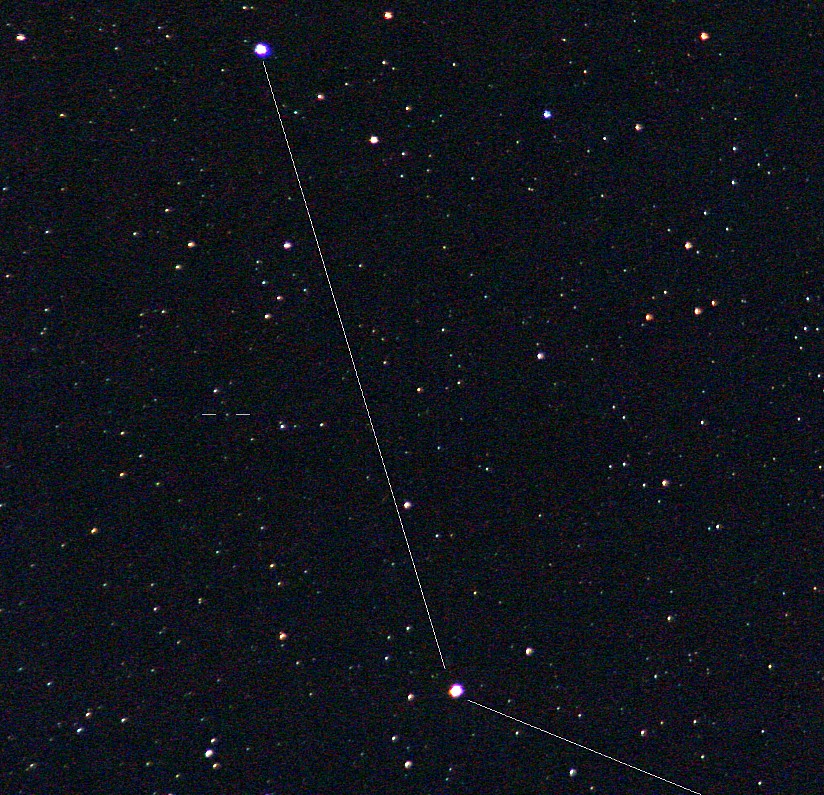
Note: The star to the upper-right of star #3 in the above
image is continuosuly variable ("contact binary"). Don't use it for reference.
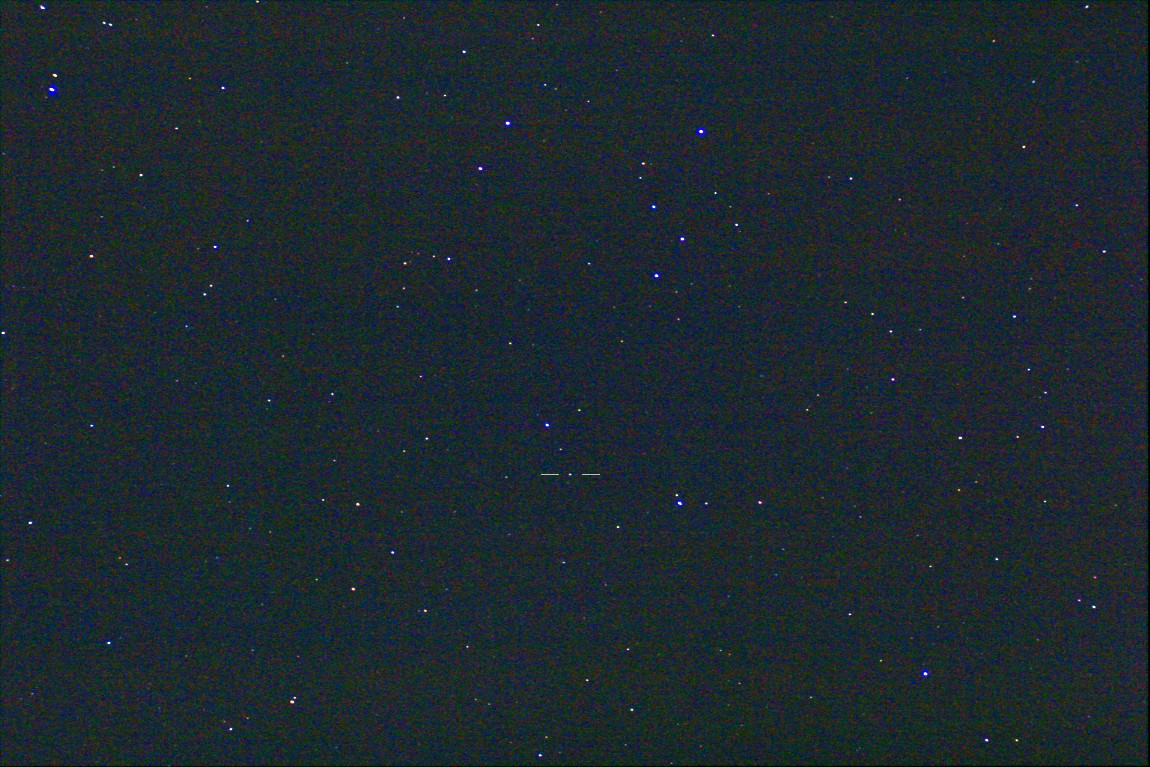
RA/DE = 16:02:07.7,+28:14:45 (GSC 2041:1416). Two other stars to the
upper-right of this FOV are also variables (see next image).
Finder Charts
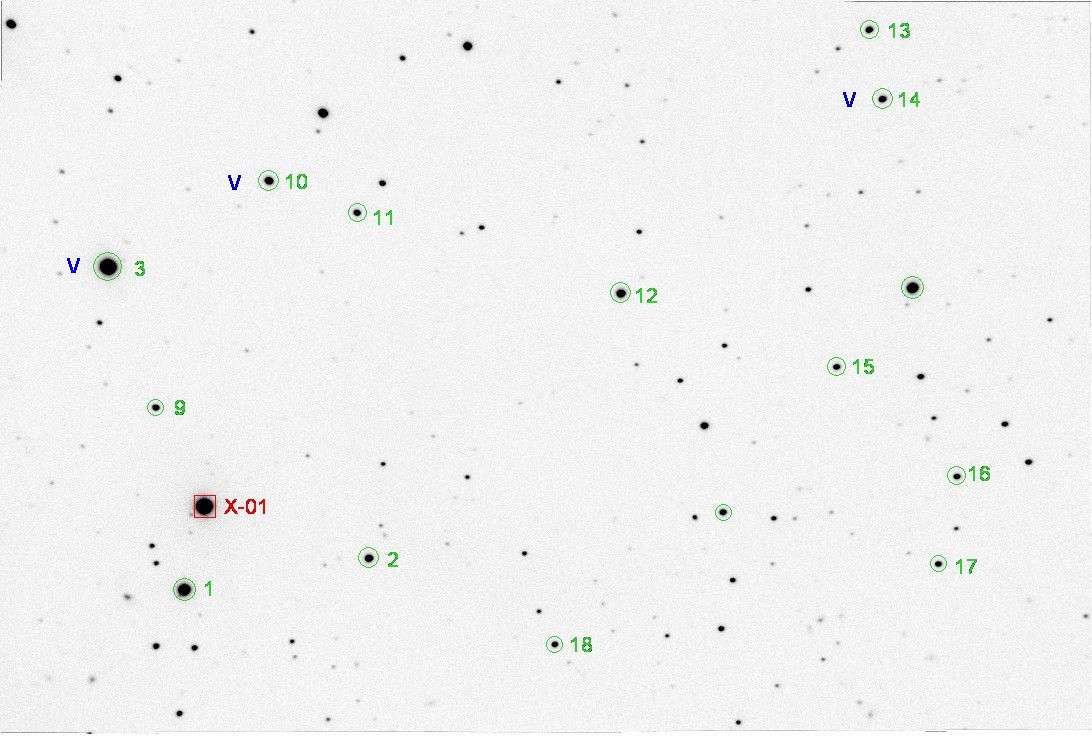
Warning: Stars #3, #10 and #14 are variables.
Detailed description of Spring, 2006 observations of XO-1
References
McCullough et al, 2006 link
Wilson et al, 2006 link
Machalek et al, 2008 link
Return to calling web page AXA
____________________________________________________________________
WebMaster: Bruce L. Gary. Nothing on this web page is copyrighted. This site opened: July 04, 2007. Last Update: 2011.06.08