Links internal to this web page:
Comments
Basic data
Table Summary of transit measurements
Transit LCs
OOT
LCs
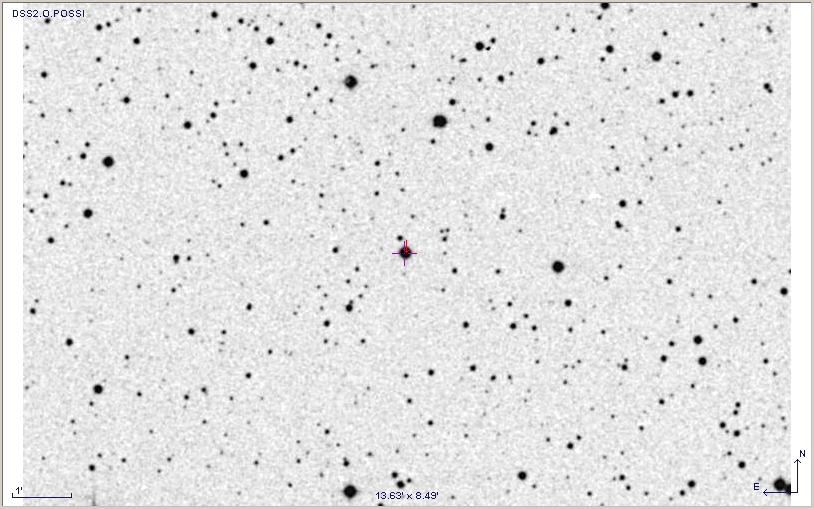
Finder
image
Comments on LCs on this web page:
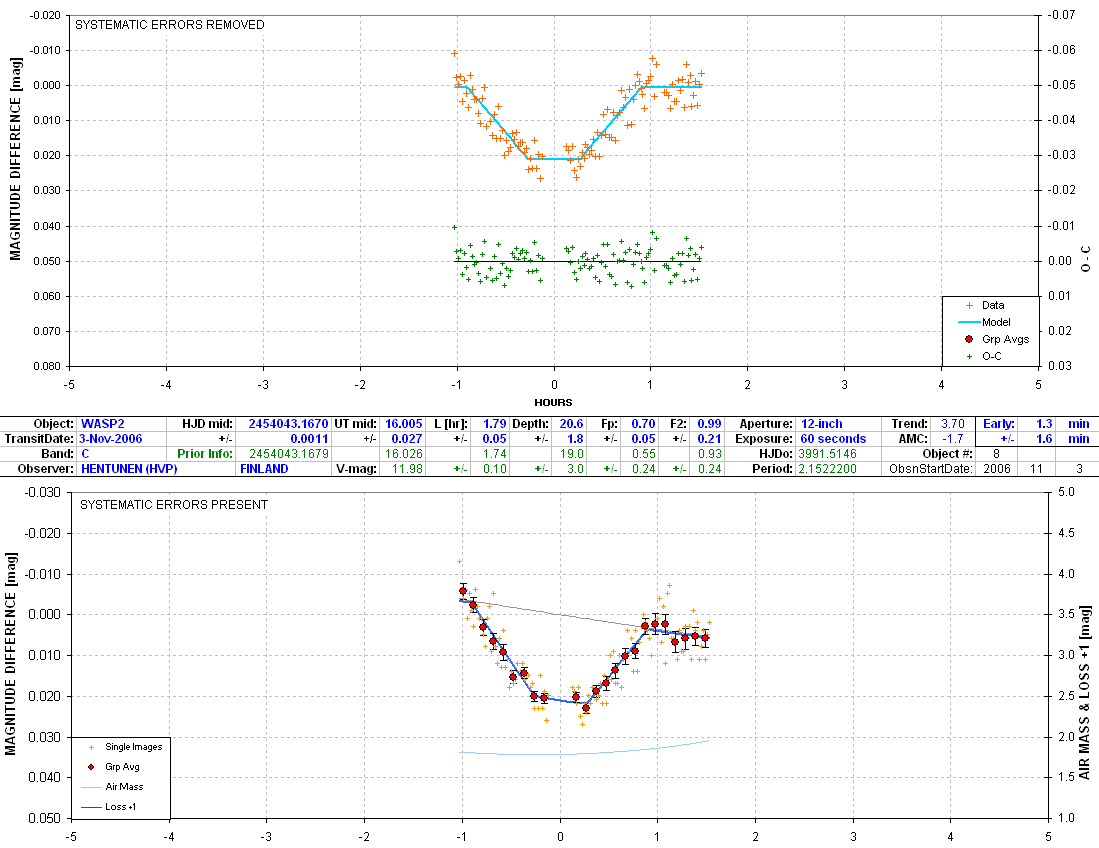
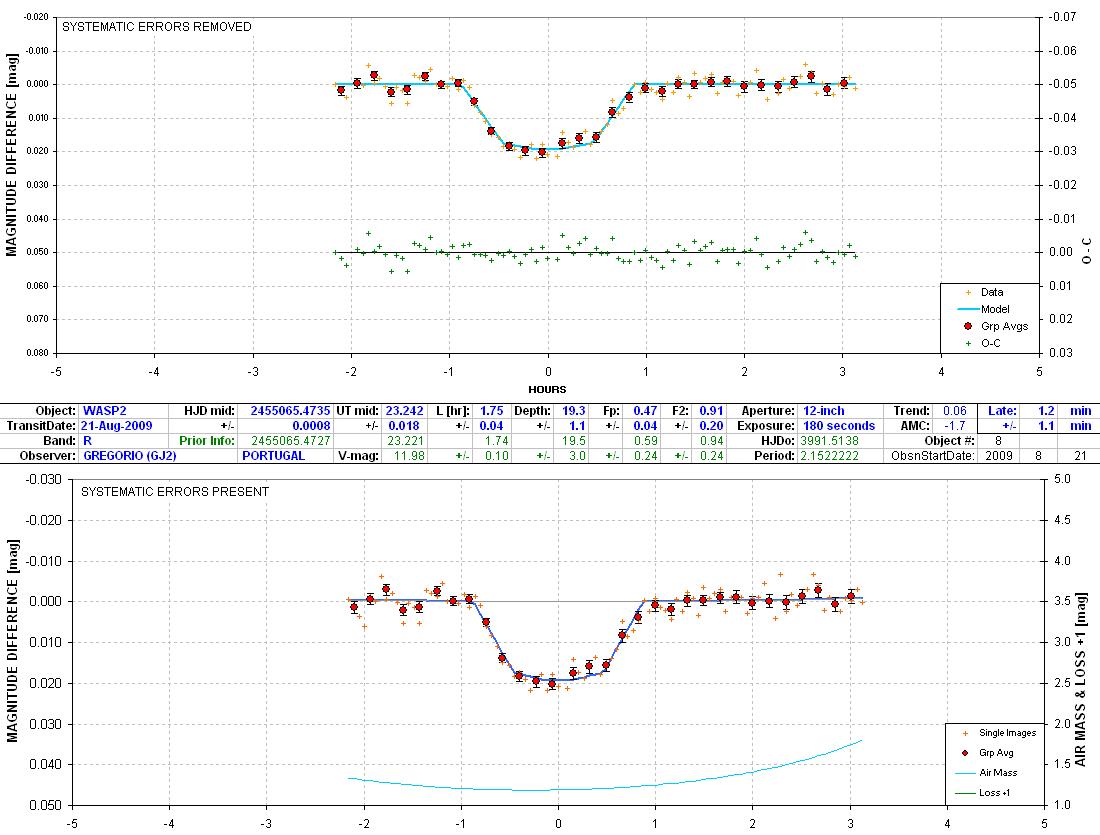
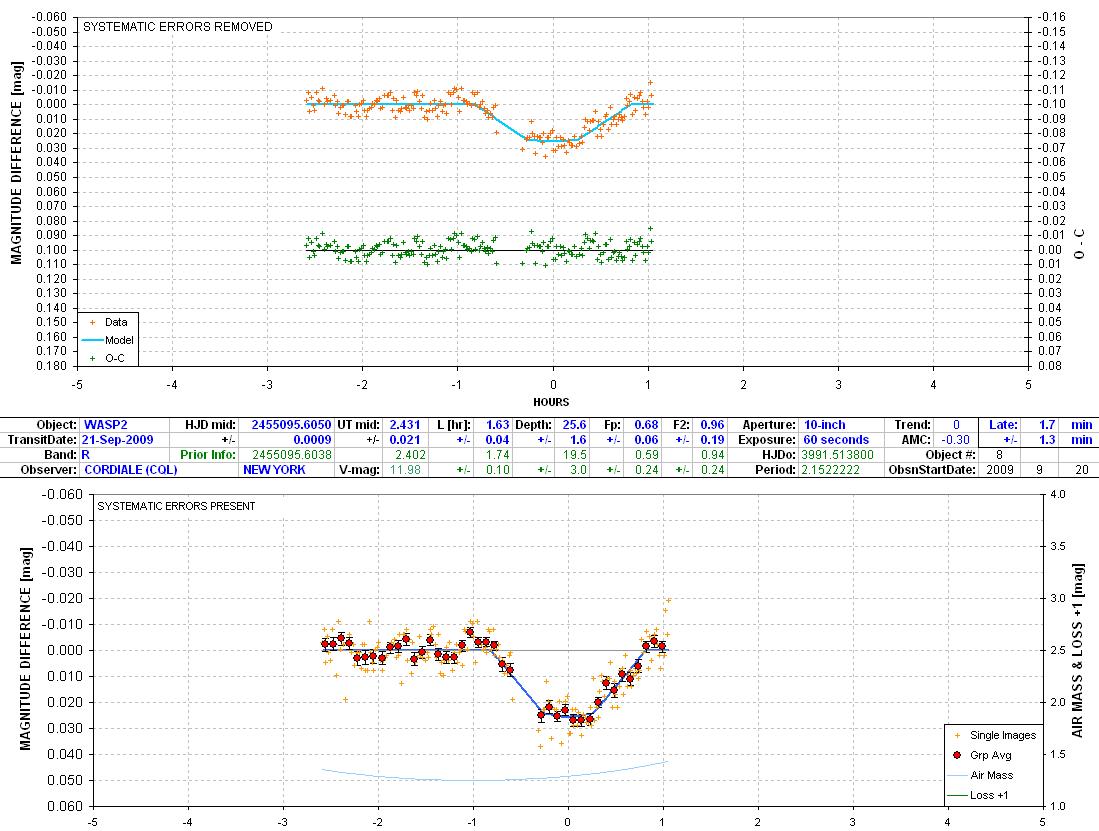
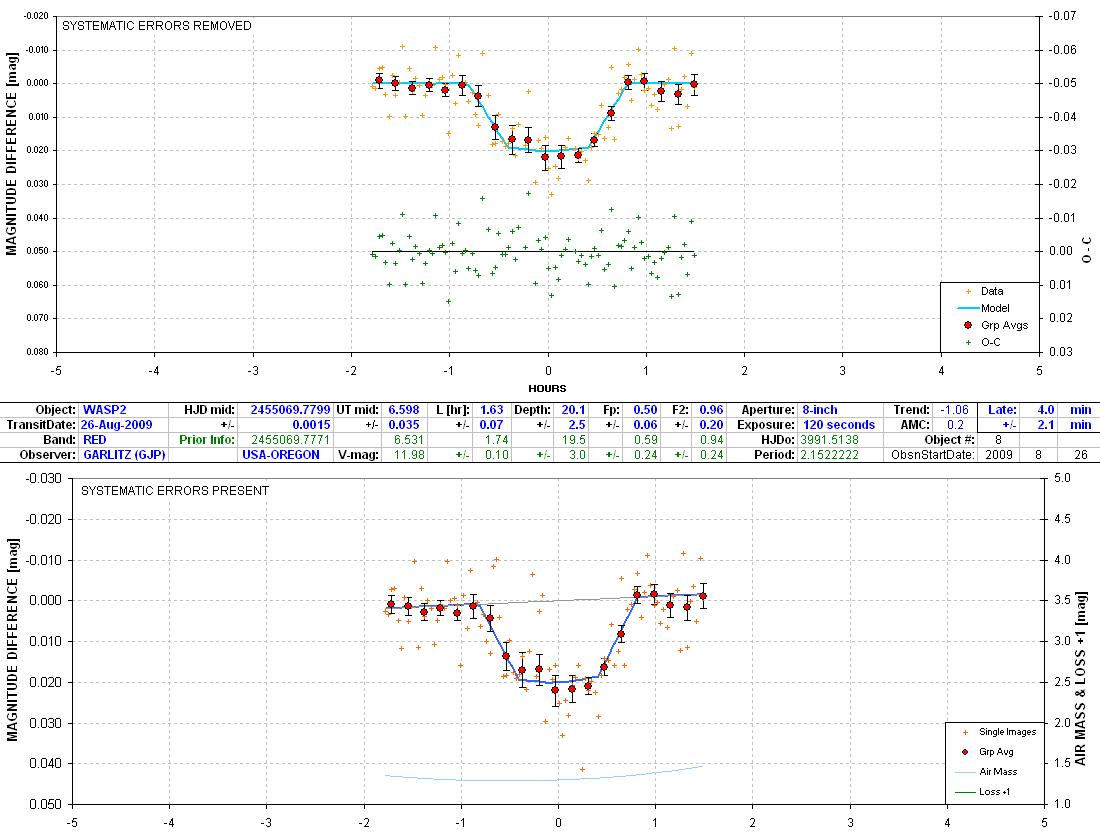
Period is close to correct. Limb darkening is small.
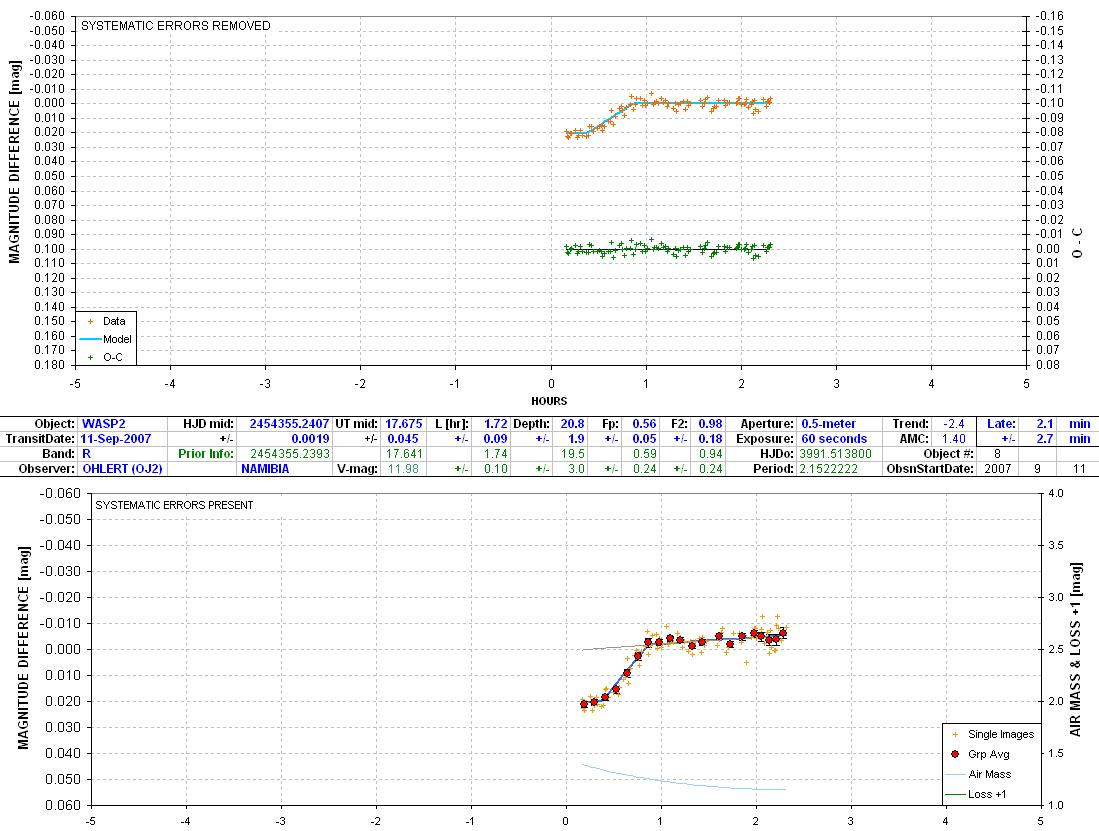
Basic Data -
Updated 2009.10.06
RA = 20:30:54.1, Decl = +06:25:46
Season = July 31
V = 11.98 ±
0.??, B-V = 1.02 ± 0.05, R ~ 11.48
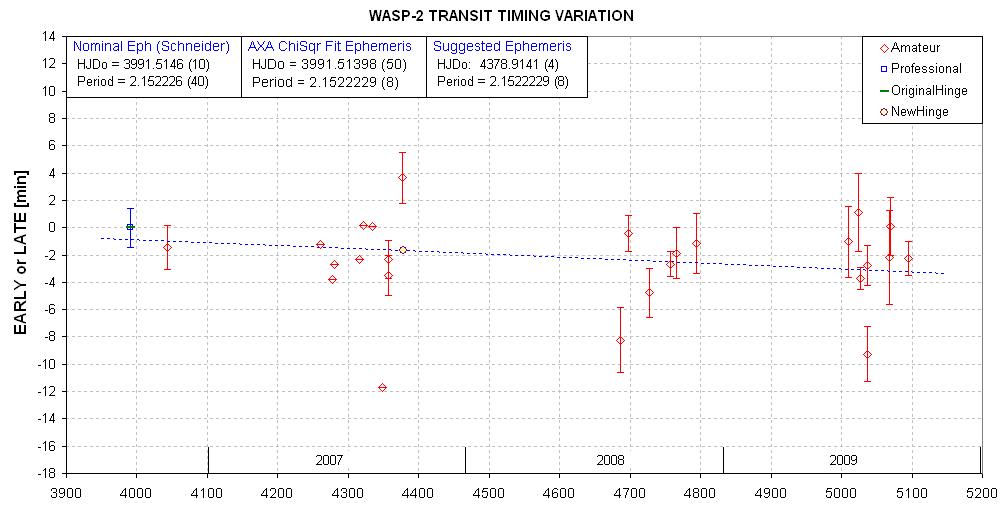
HJDo = 3991.5146
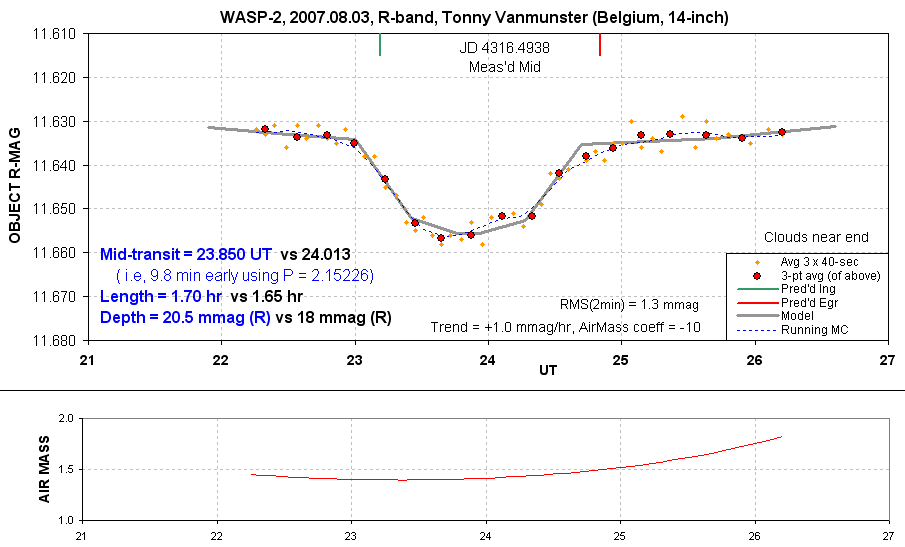
(10), P = 2.152226 (40) days (as listed in
Schneider's Extrasolar
Planets Encyclopaedia)
HJDo = 3991.51398 (50), P
= 2.1522229 (8) days (AXA solution); better
yet: HJDo = 4378.9141 (4), P = 2.1522229
(8) days (AXA suggestion)
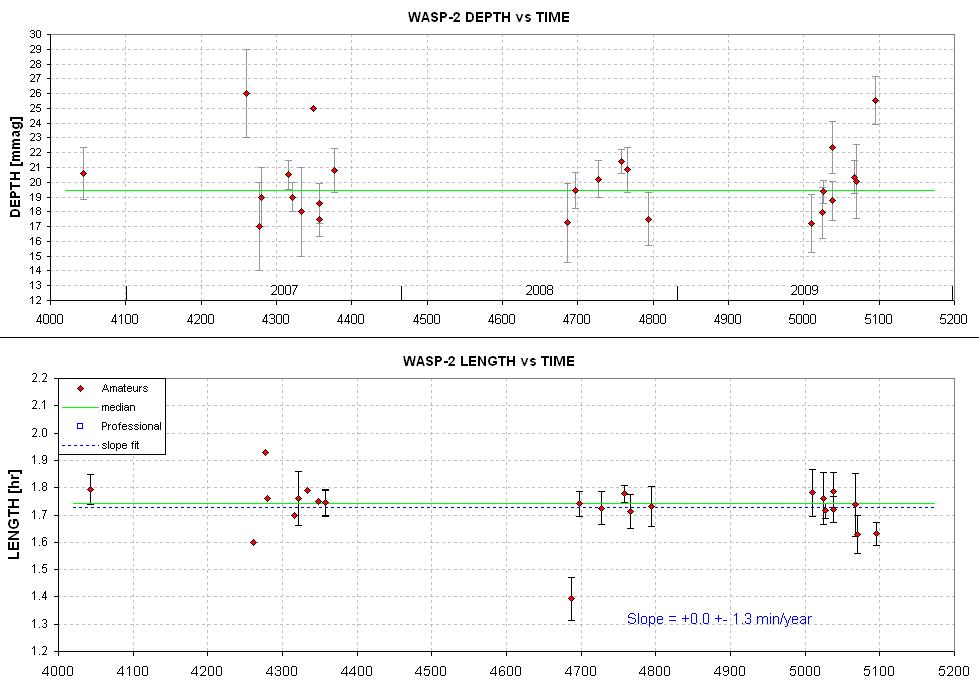
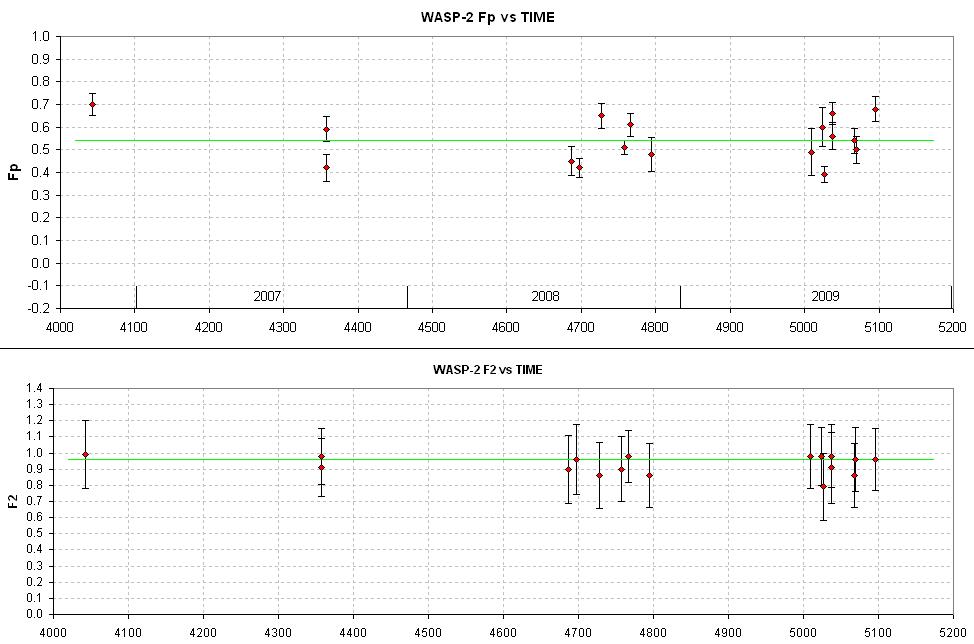
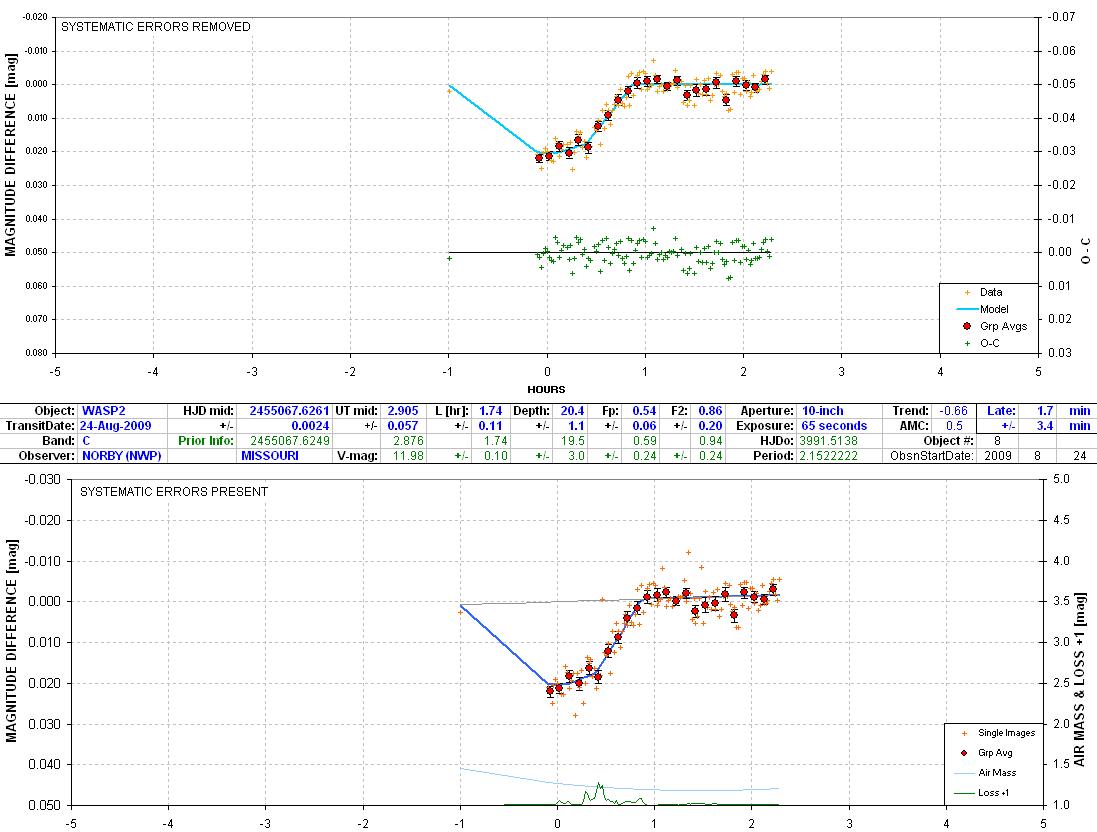
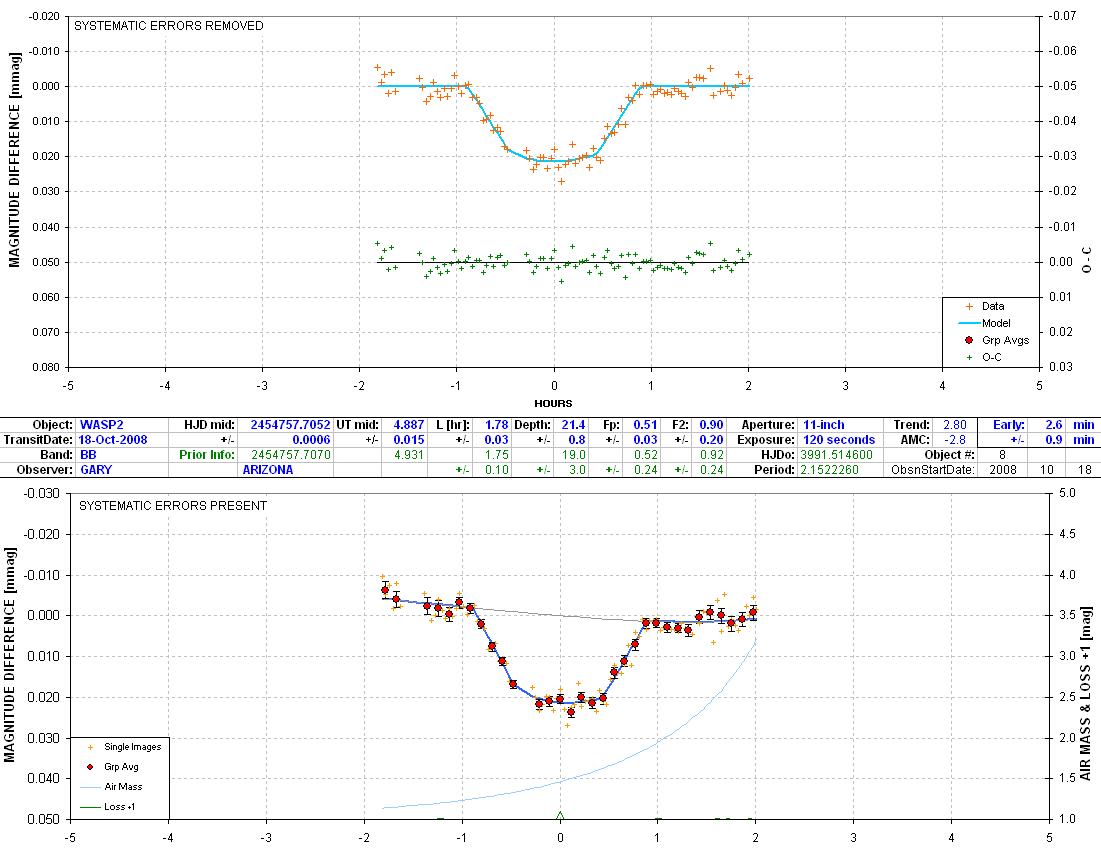
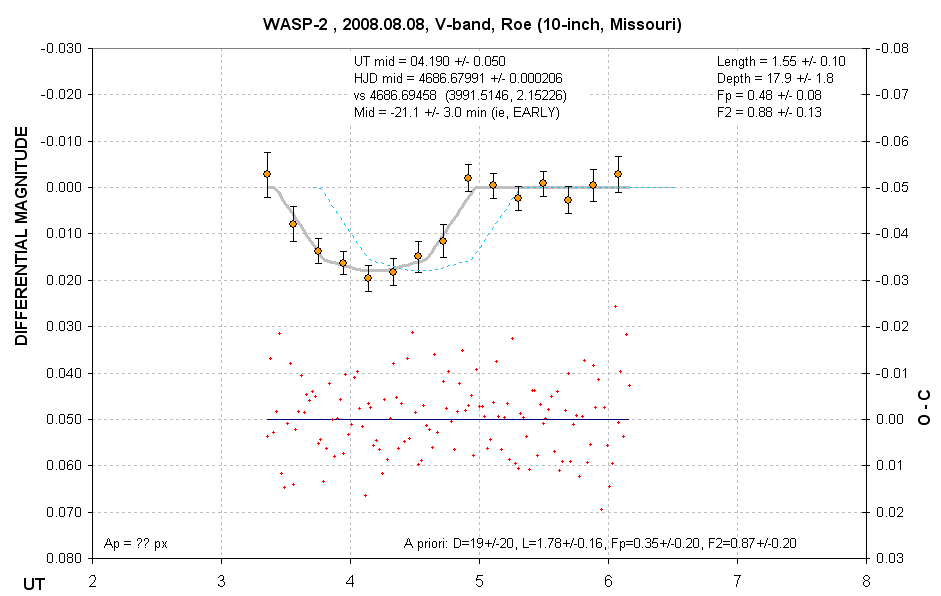
Depth = 19.4 ±
1.0 mmag (R-band)
Length = 1.74 ±
0.04 hr
Fp = 0.54 ±
0.07, F2 = 0.96 ± 0.08
b = 0.39
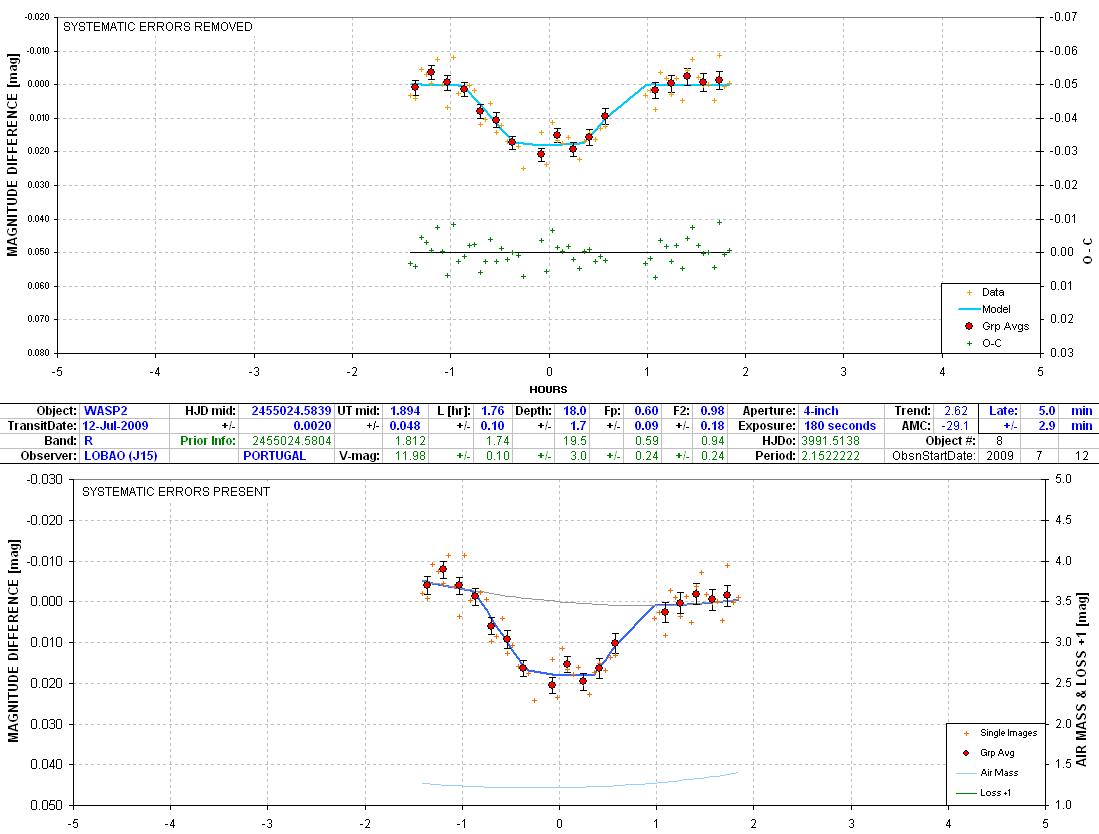
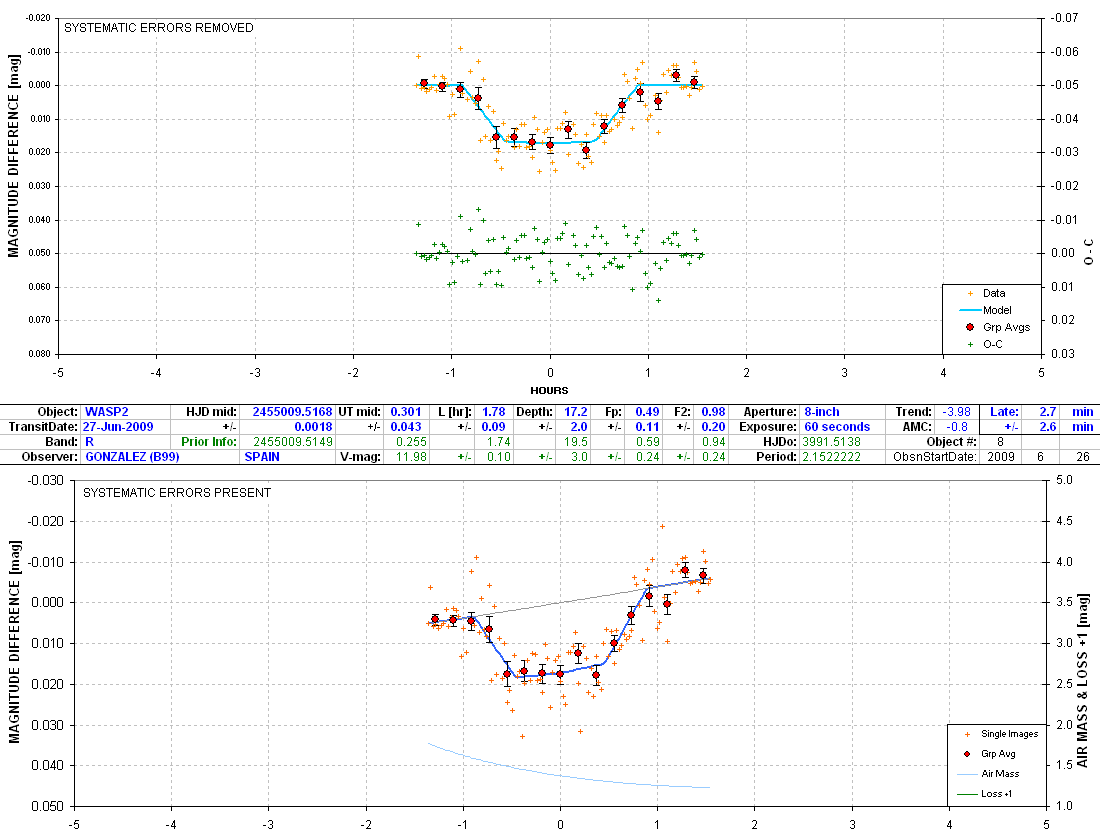
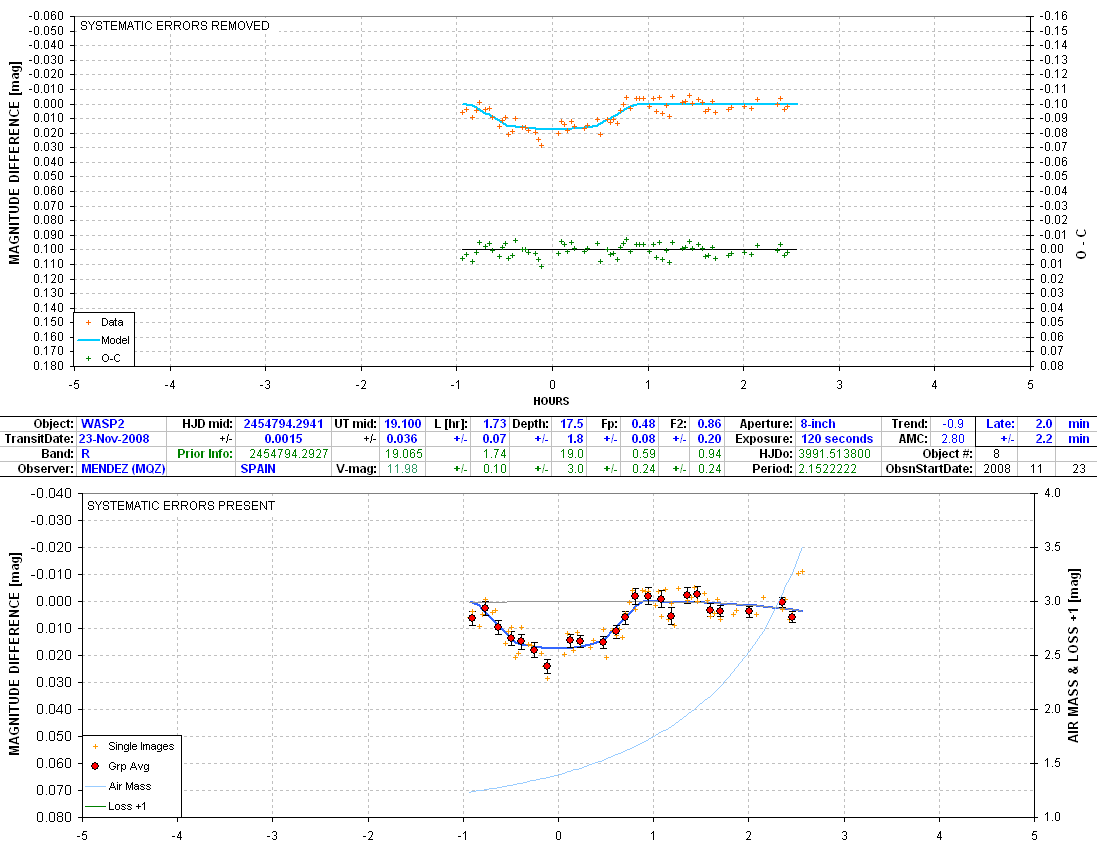
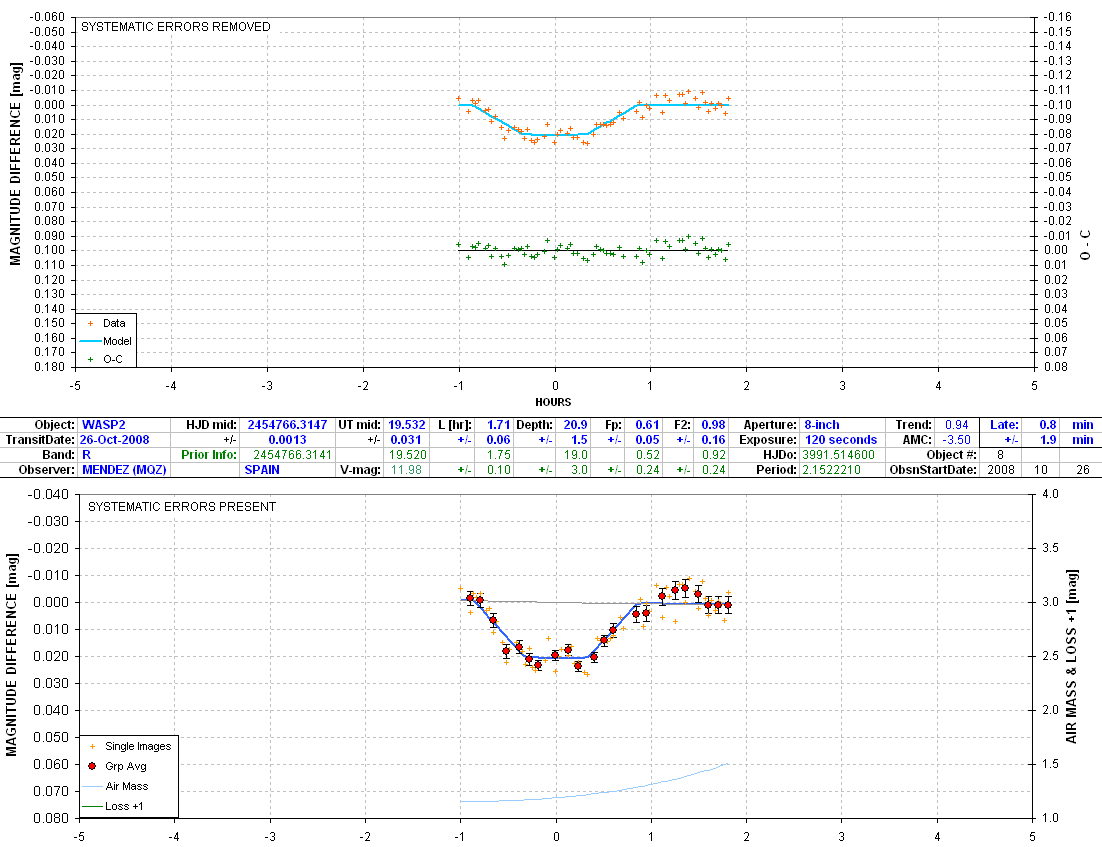
Summary of Transit Measurements
- Updated 2009.10.06
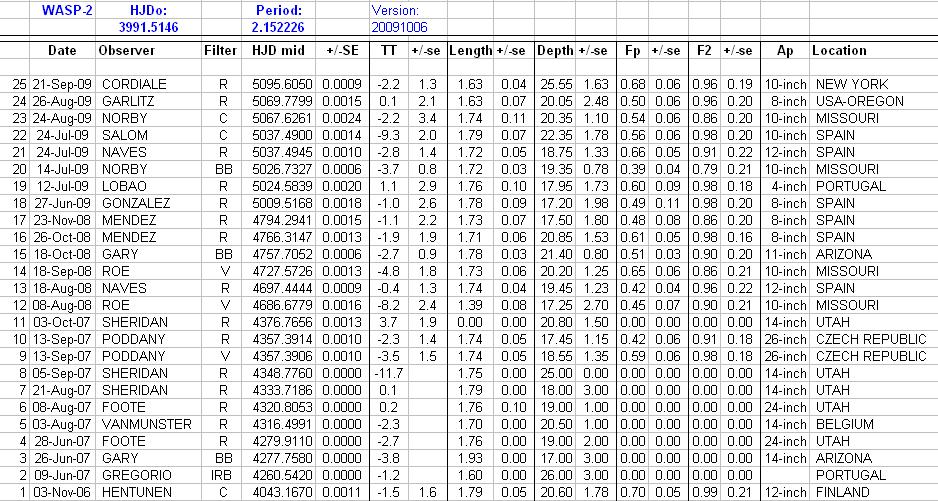
These LCs haven't been included in table & plots (above)

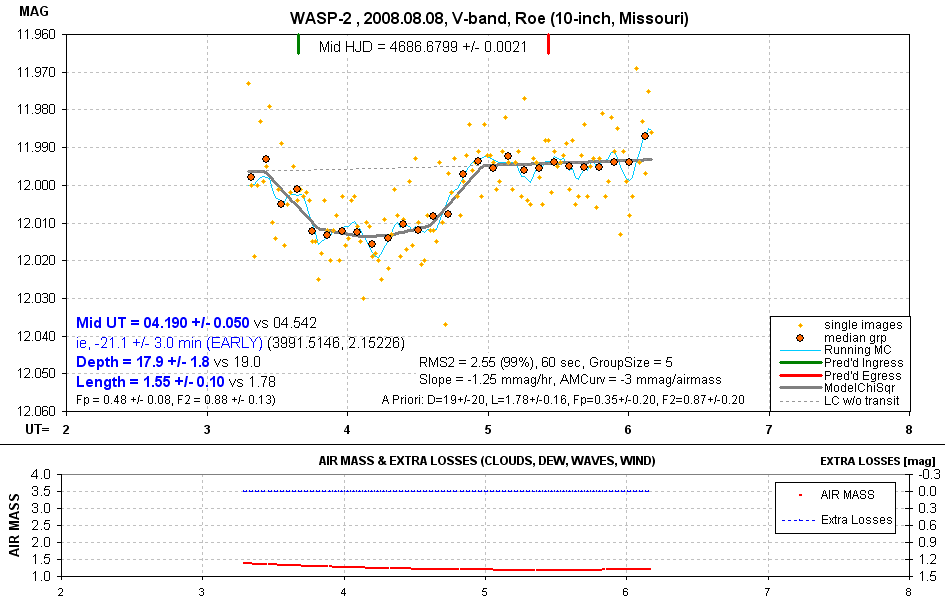
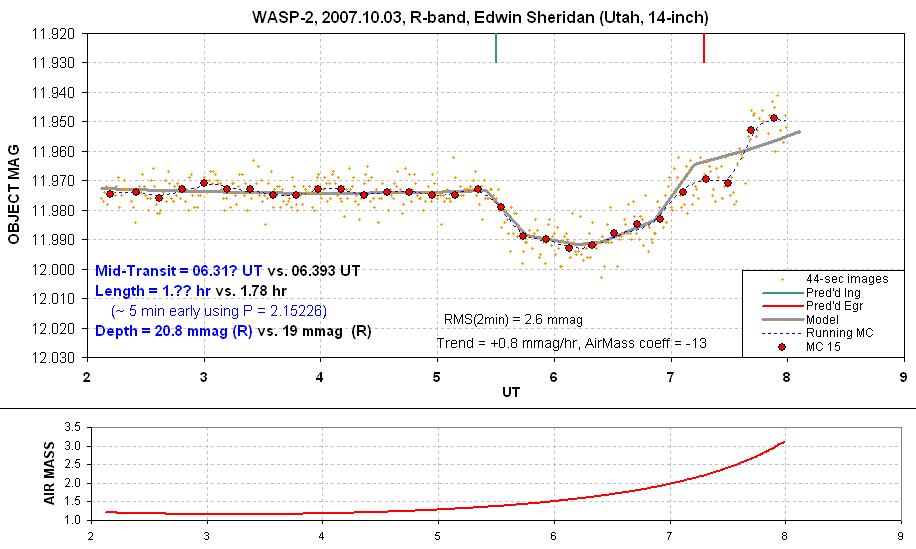

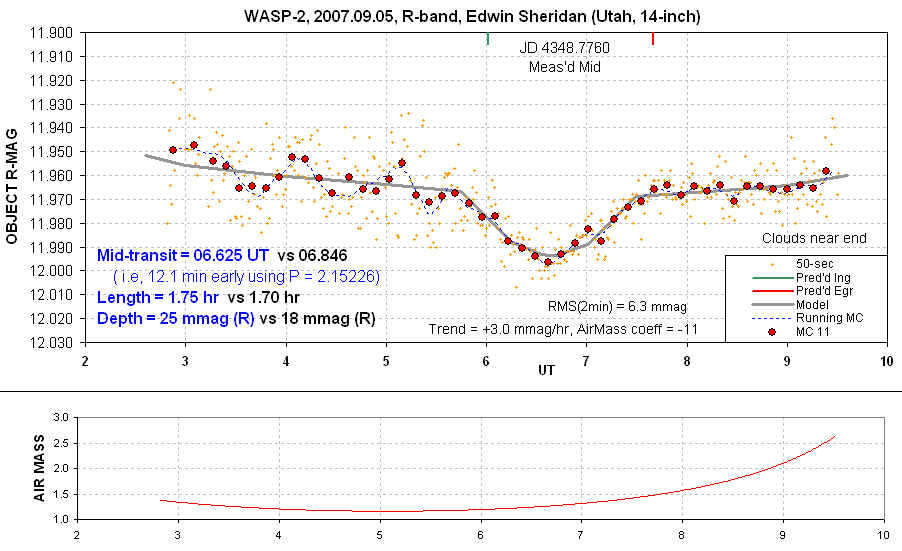
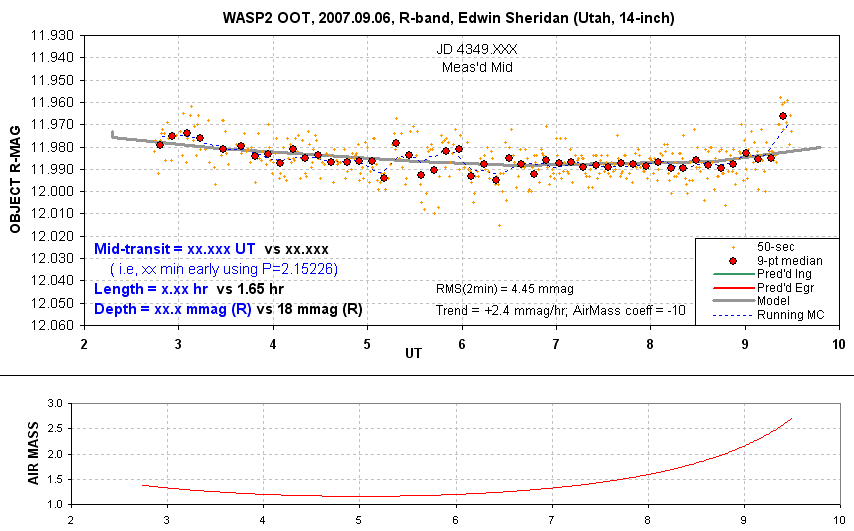
Edwin Sheridan's first exoplanet light curve! Congratulations!
Almost perfect!
A little short on OOT baselines but good otherwise.
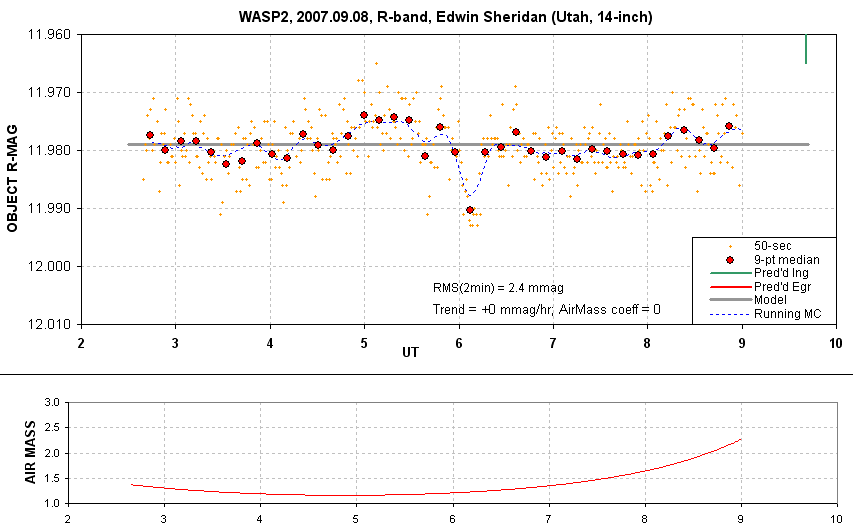
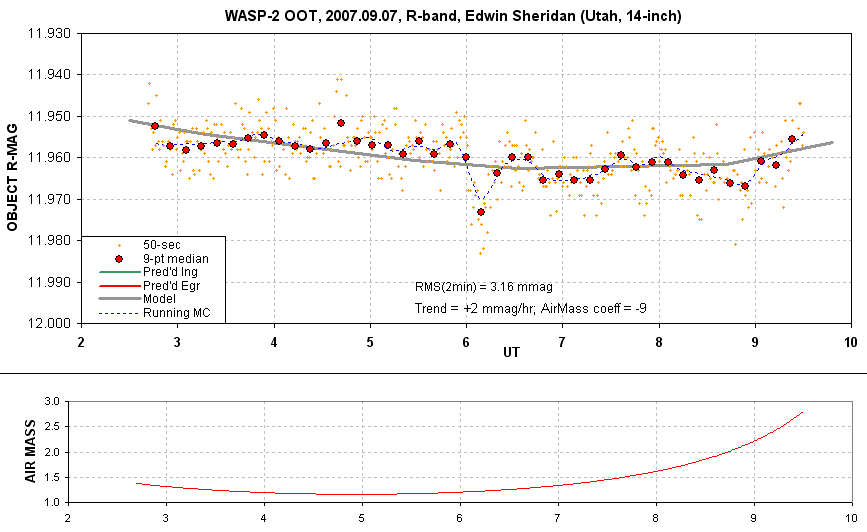
Out-of-Transit (OOT)
Light Curves
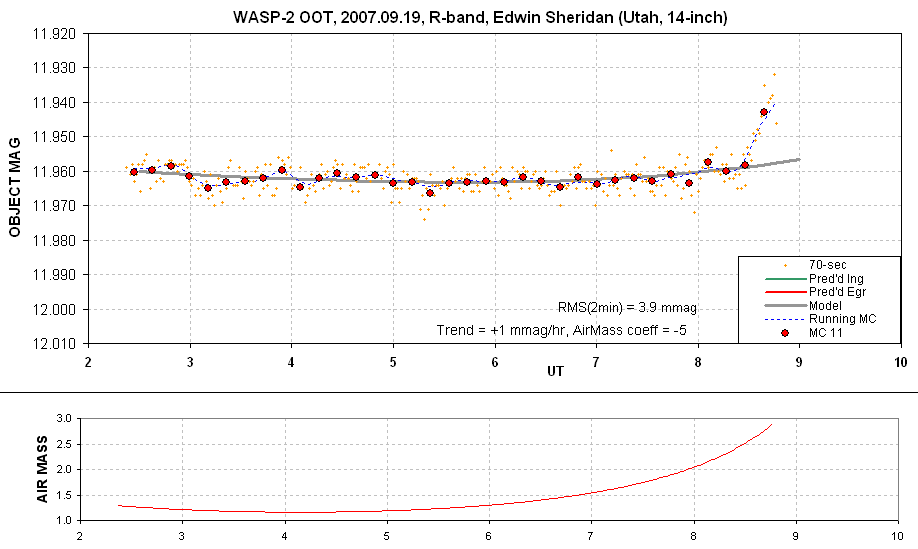
Same dip at 06.1 UT. Must be a systematic.
OOT.
OOT.
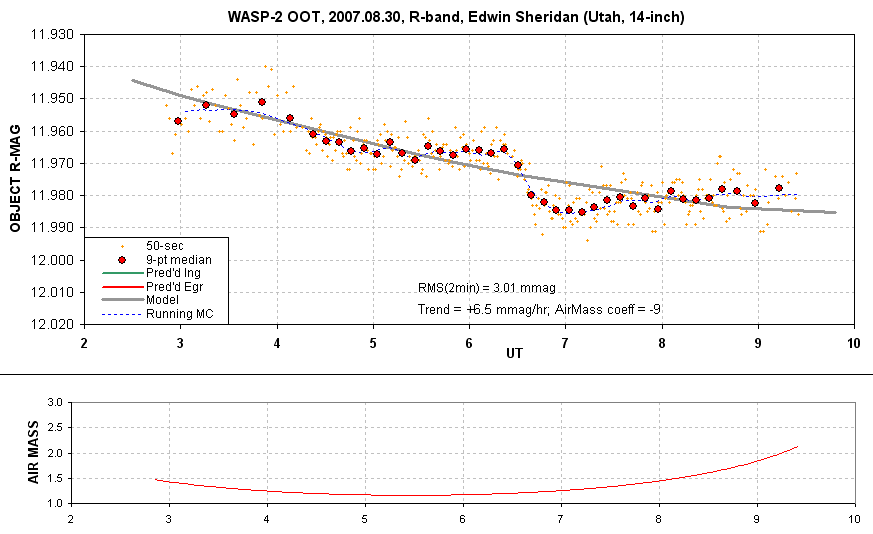
OOT. Something systemtic going on.
WebMaster: Bruce
L. Gary. Nothing on this web page is copyrighted. This site opened: August 07, 2007. Last Update: 2009.11.06