HAT-P-3
Light Curves & Finder Chart
Links internal to this web page
Comments
Basic data
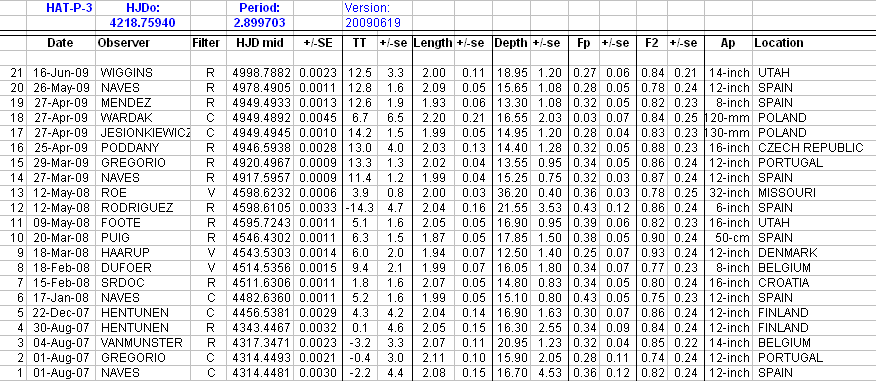
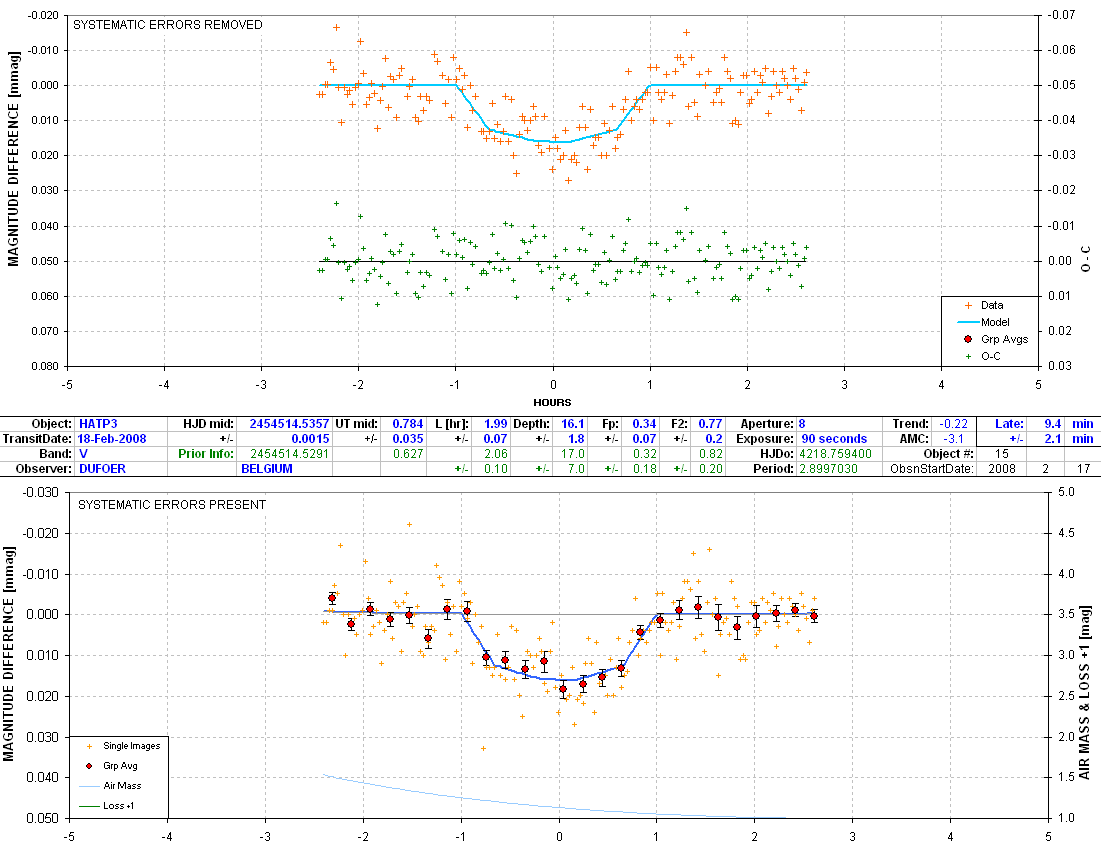
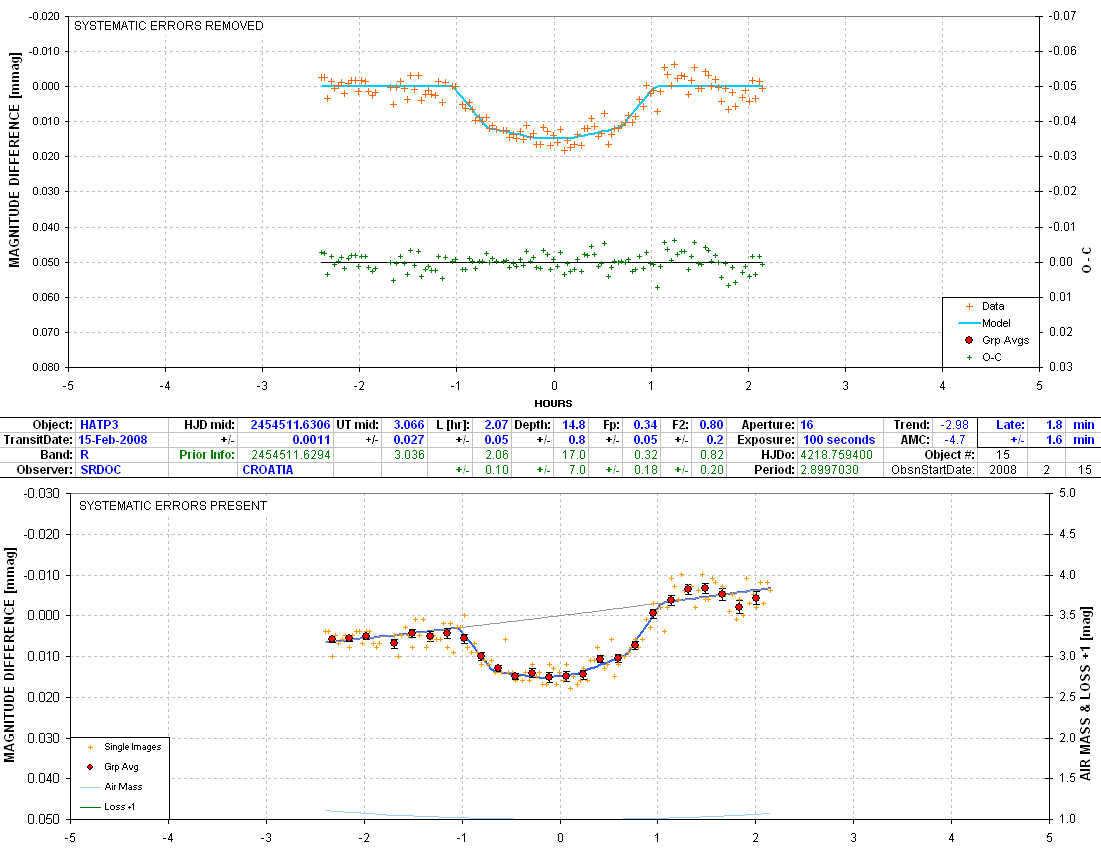
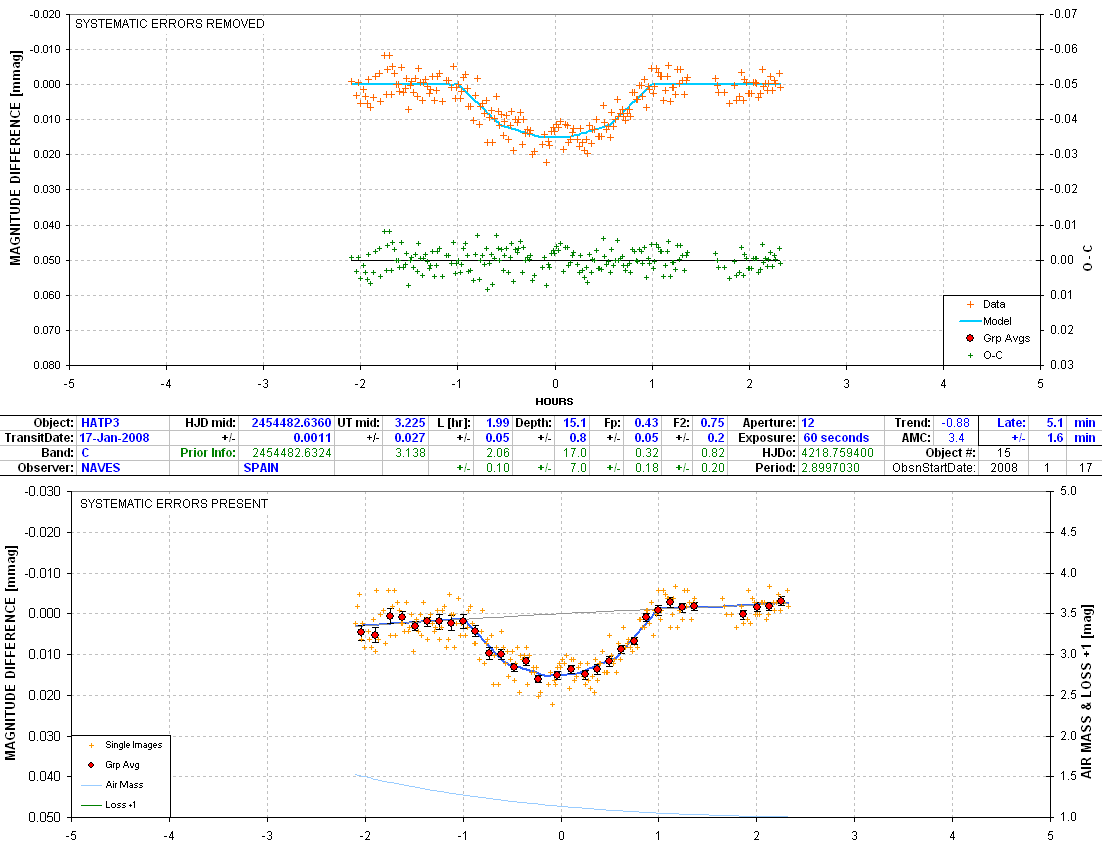
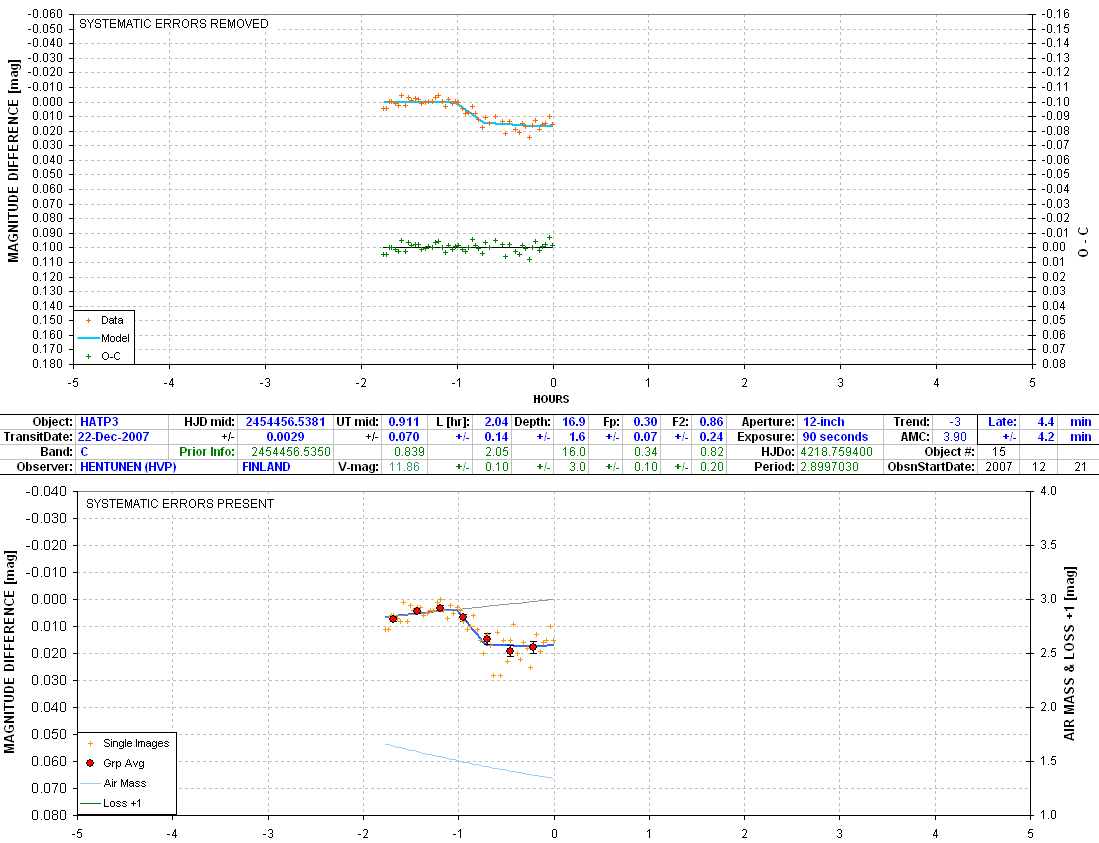
Summary of transit measurements
Transit
LCs
OOT LC
Finder image
Comments
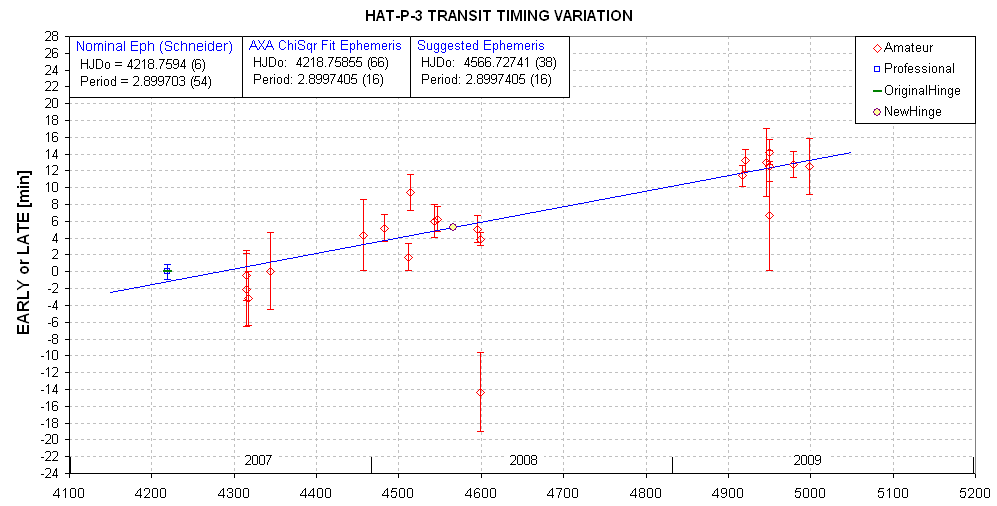
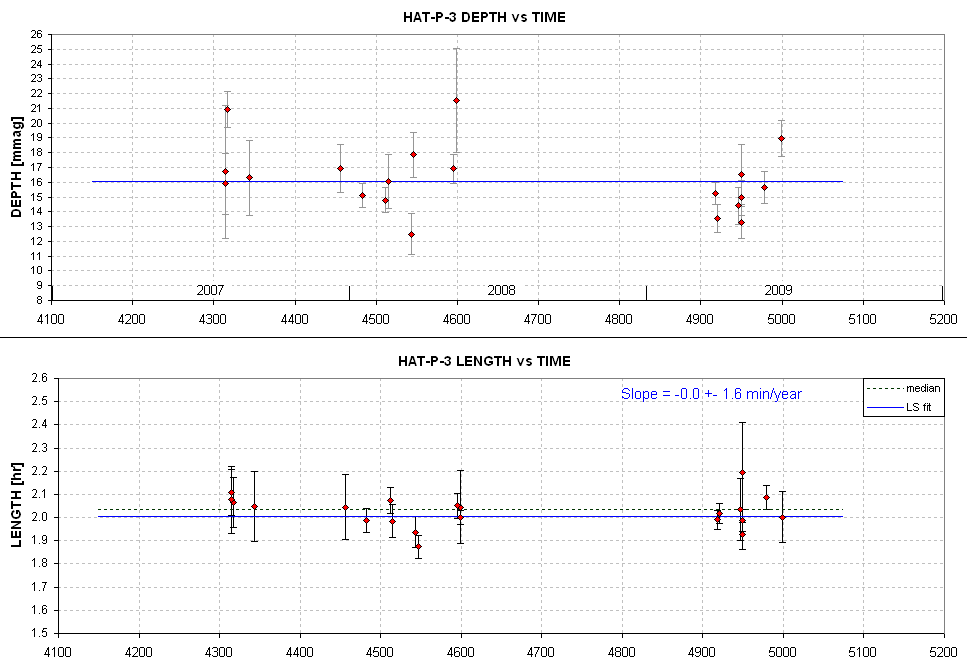
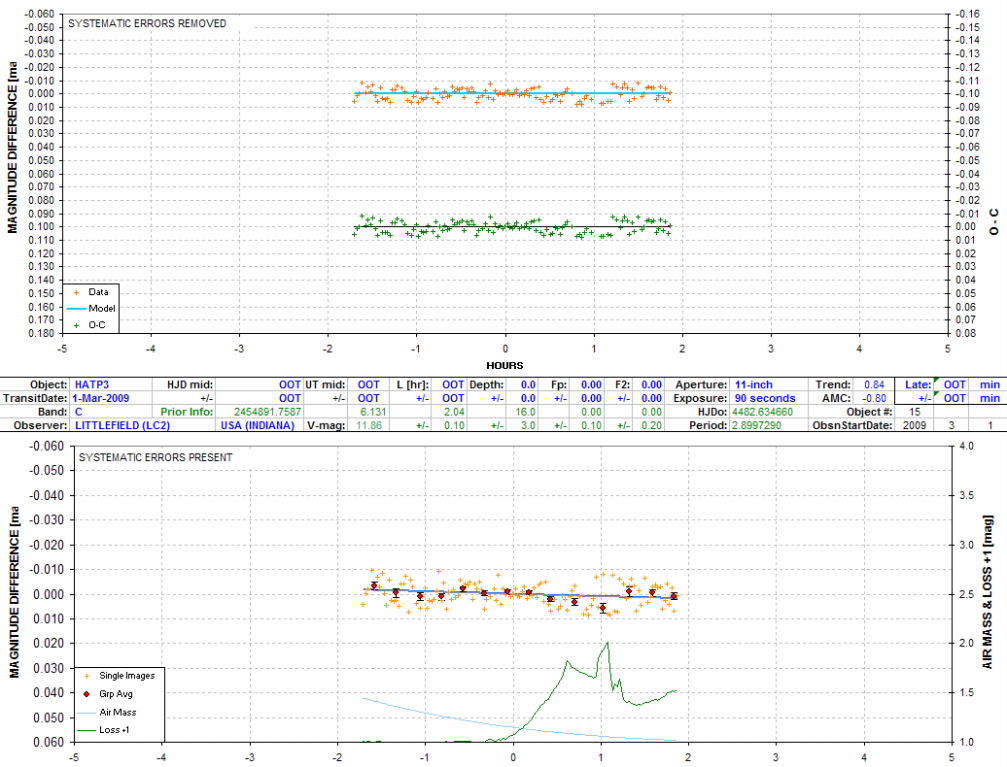
The period should be increased. Length is constant.
Depth might decrease with wavelength.
Basic Data
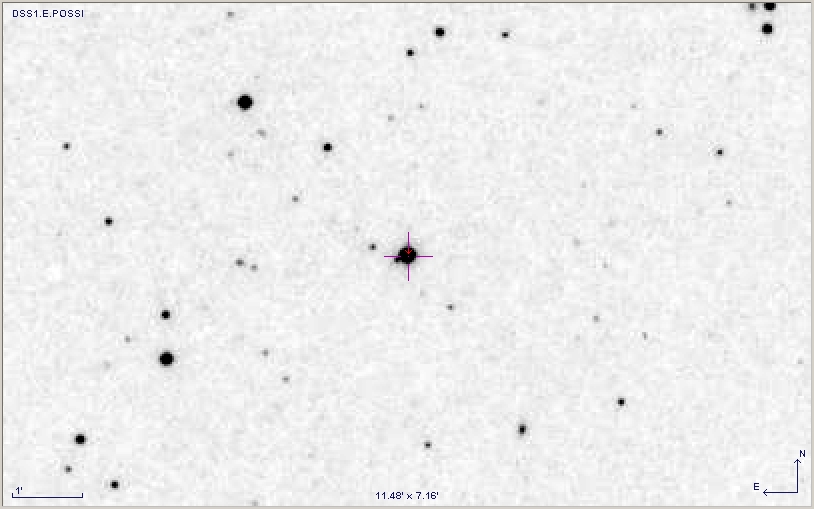
RA = 13:44:22.6, DE = +48:01:43
Season = April 15
V = 11.86, B-V
= 0.80 (?)
HJDo = 4218.7594, AXA fit
= 4218.7566 (21)
P = 2.899703 day , AXA fit = 2.90088 (52)
HJDo = 4218.7594 (6)
and P = 2.899703 (54) days (as listed in Schneider's Extrasolar Planets Encyclopaedia)
HJDo = 4218.75855 (66) and P
= 2.8997405 (16) days (as derived from AXA submitted
data); or even better: JDo = 4566.72741 (38), P = 2.8997405 (16)
Depth = 16.0
± 0.8 mmag (R & C-band), 14
mmag (i-band)
Length = 2.01
± 0.04 hr
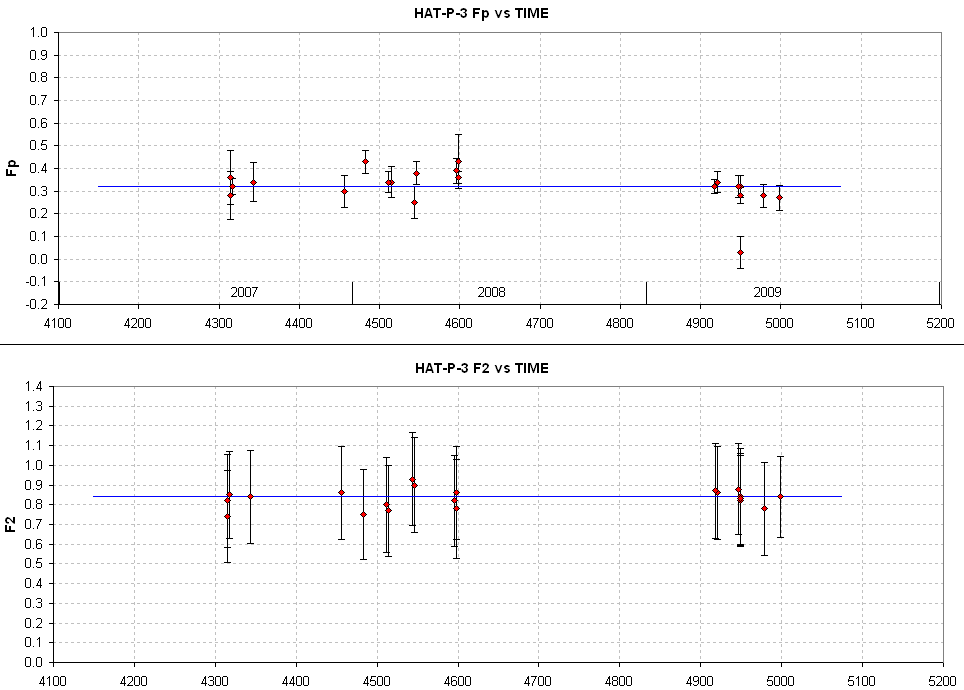
Fp = 0.33 ± 0.04, F2 =
0.83 ± 0.08
Summary of Transit Light
Curves
Transit Light Curves
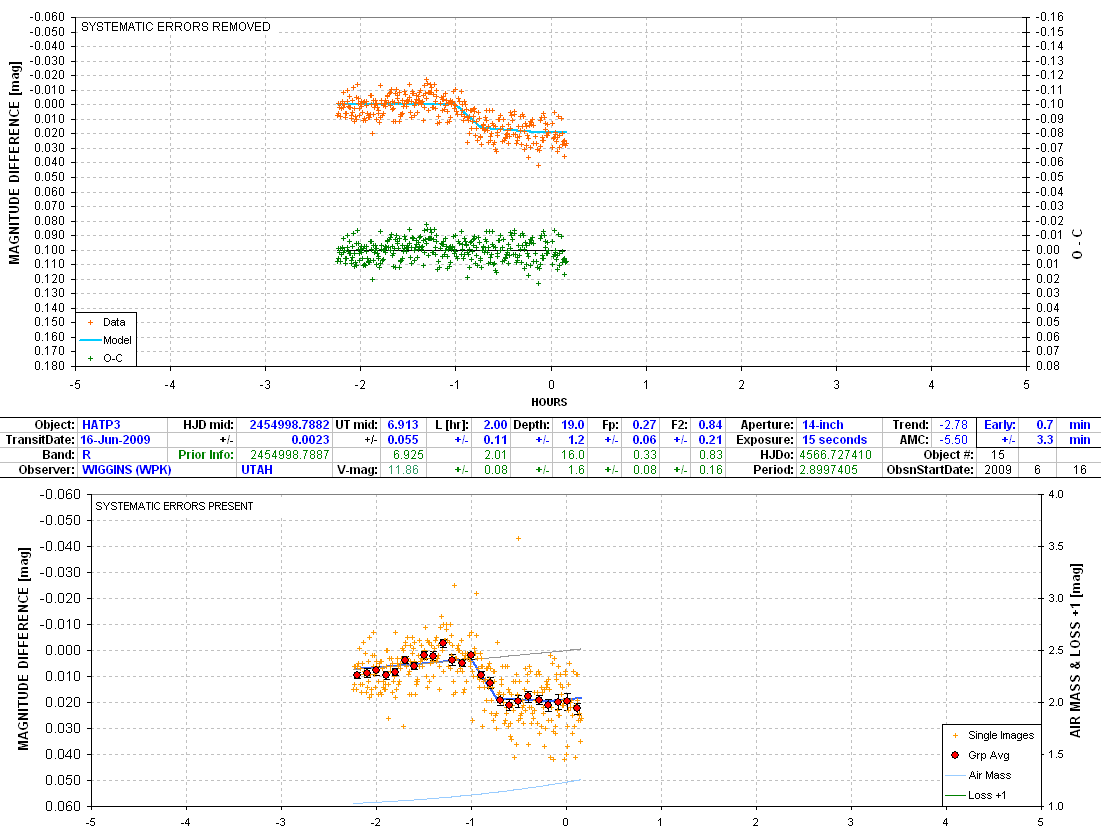
9616WPK
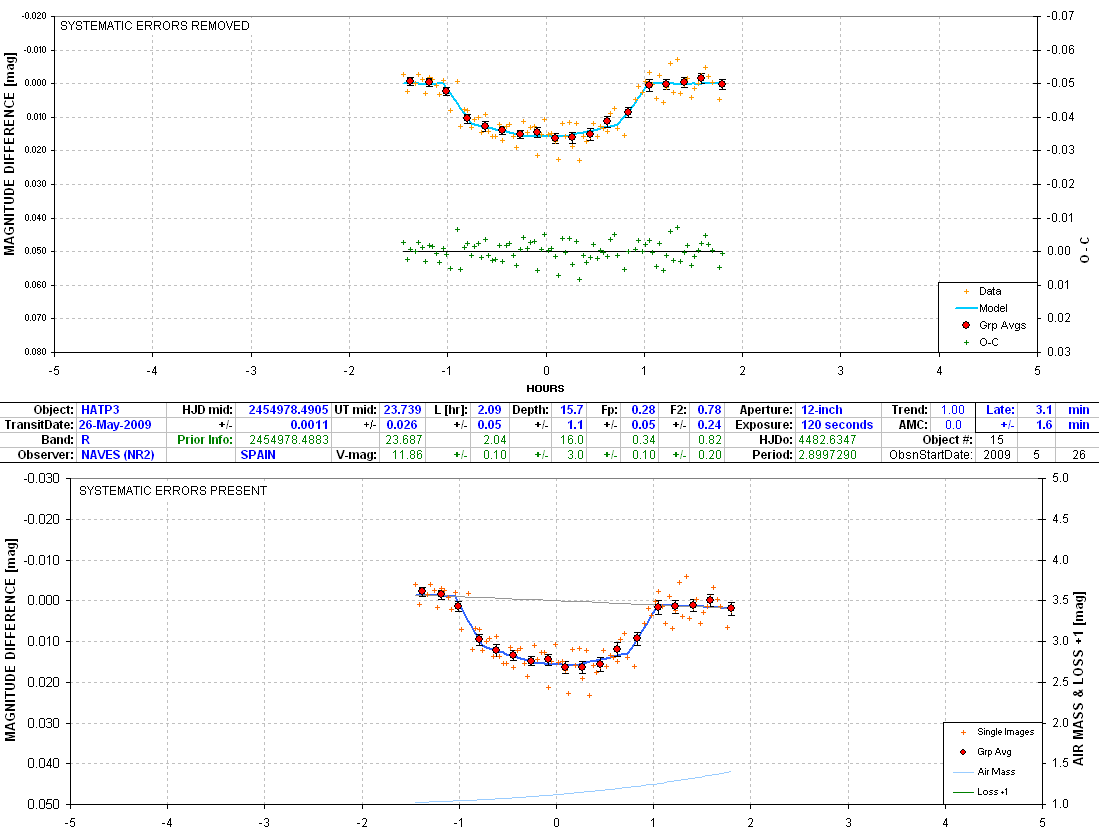
9526NR2
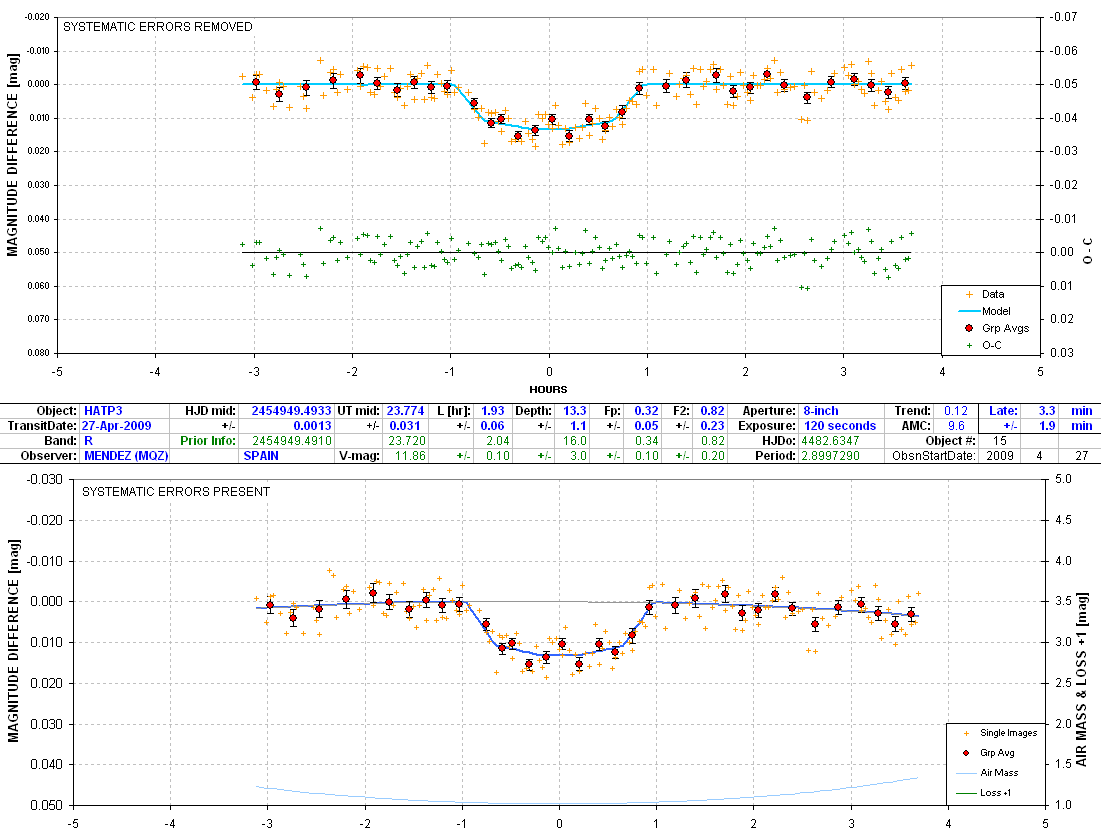
9427MQZ
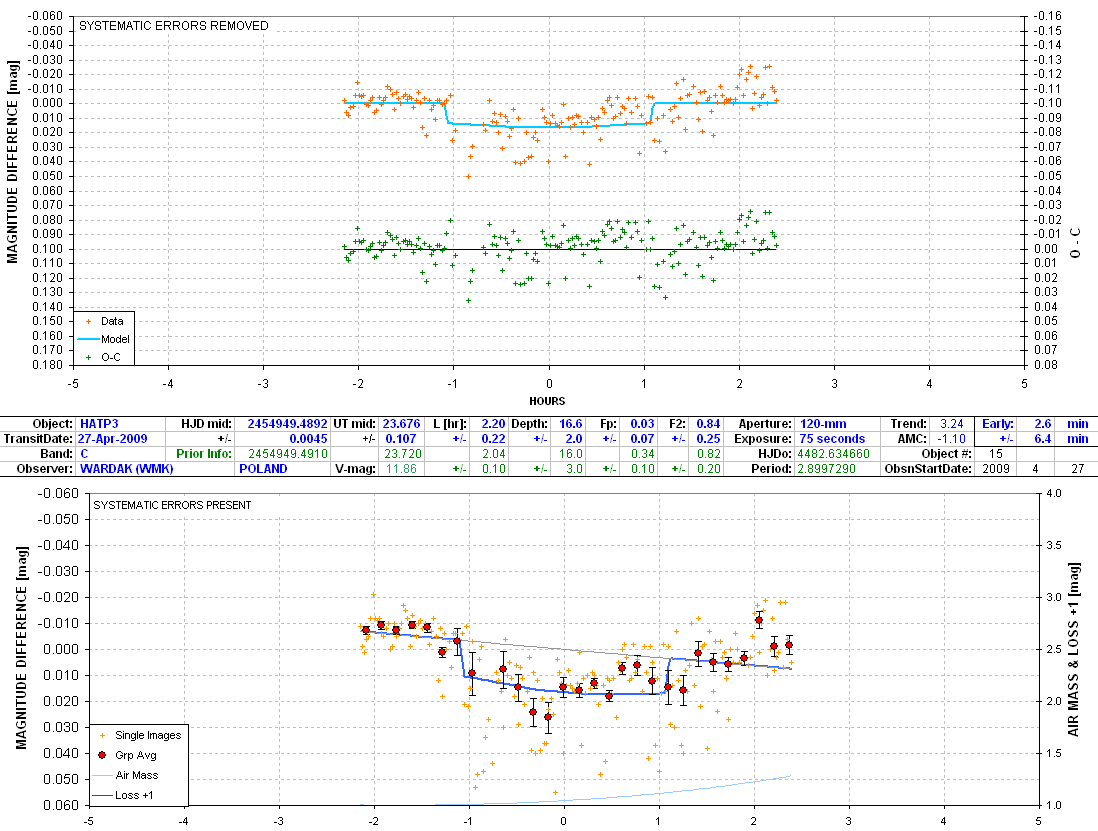
9427WMK
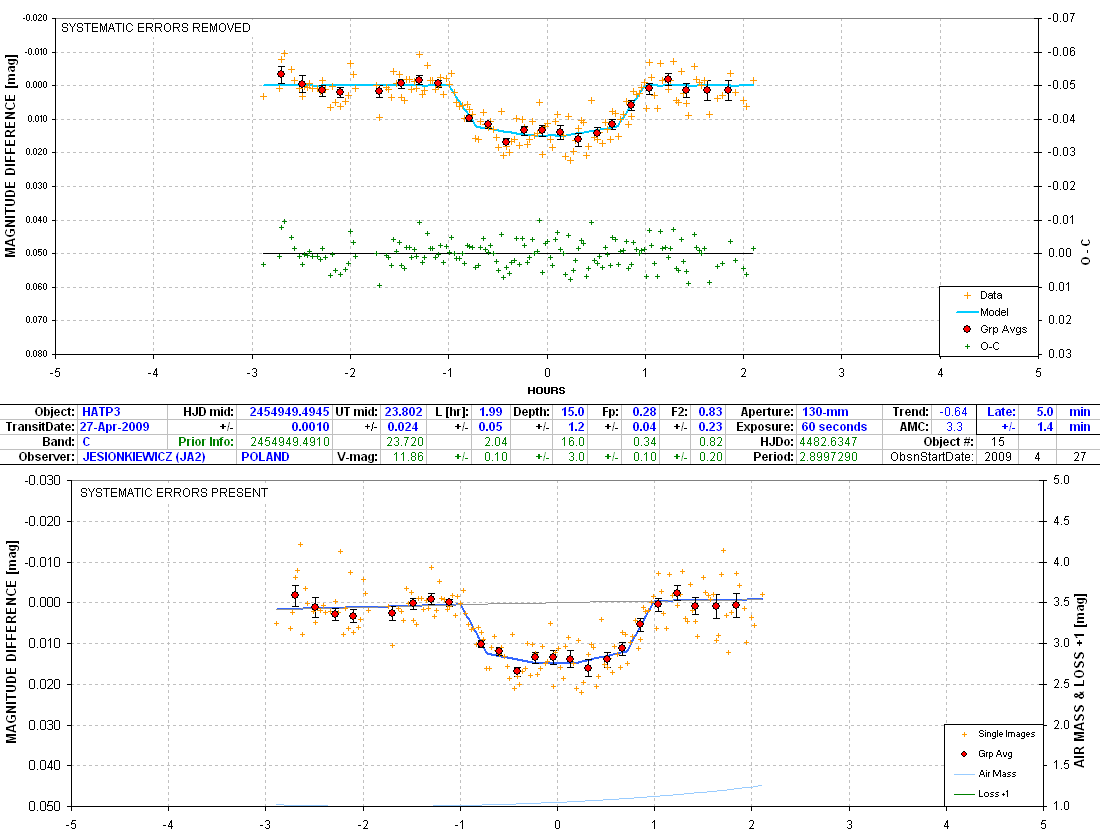
9427JA2
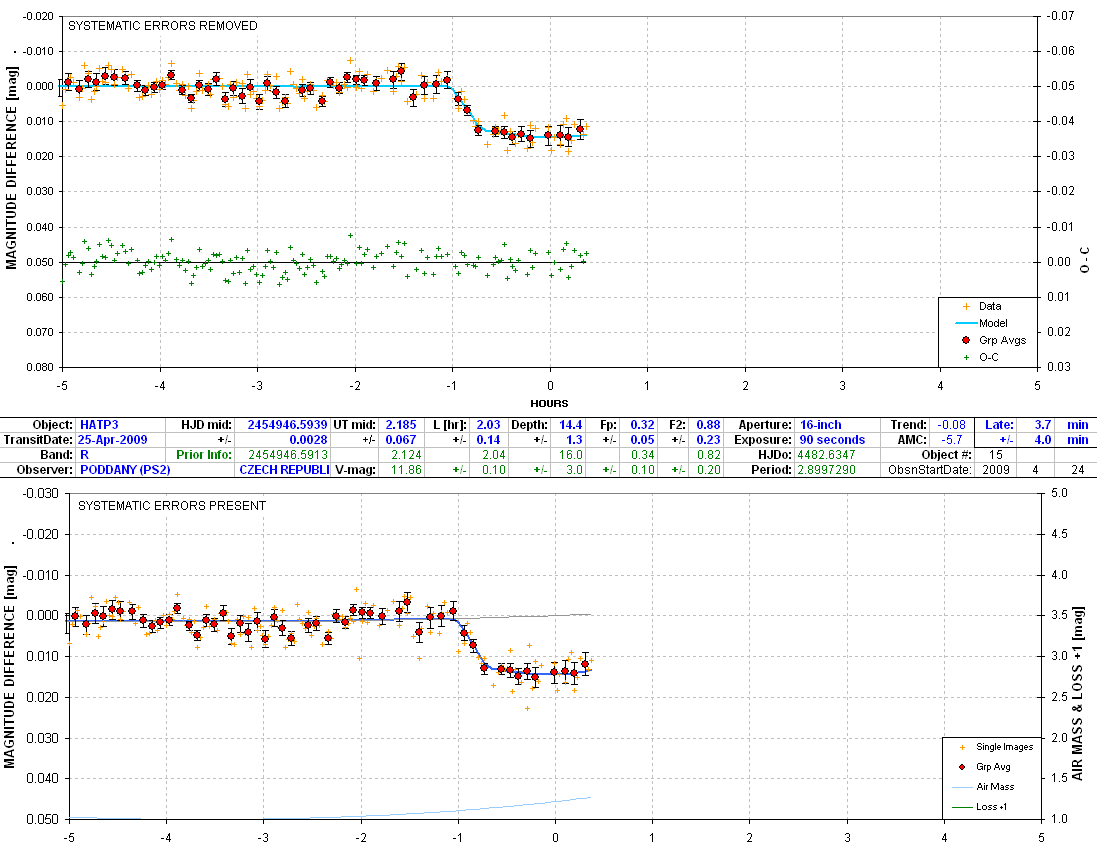
9424PS2
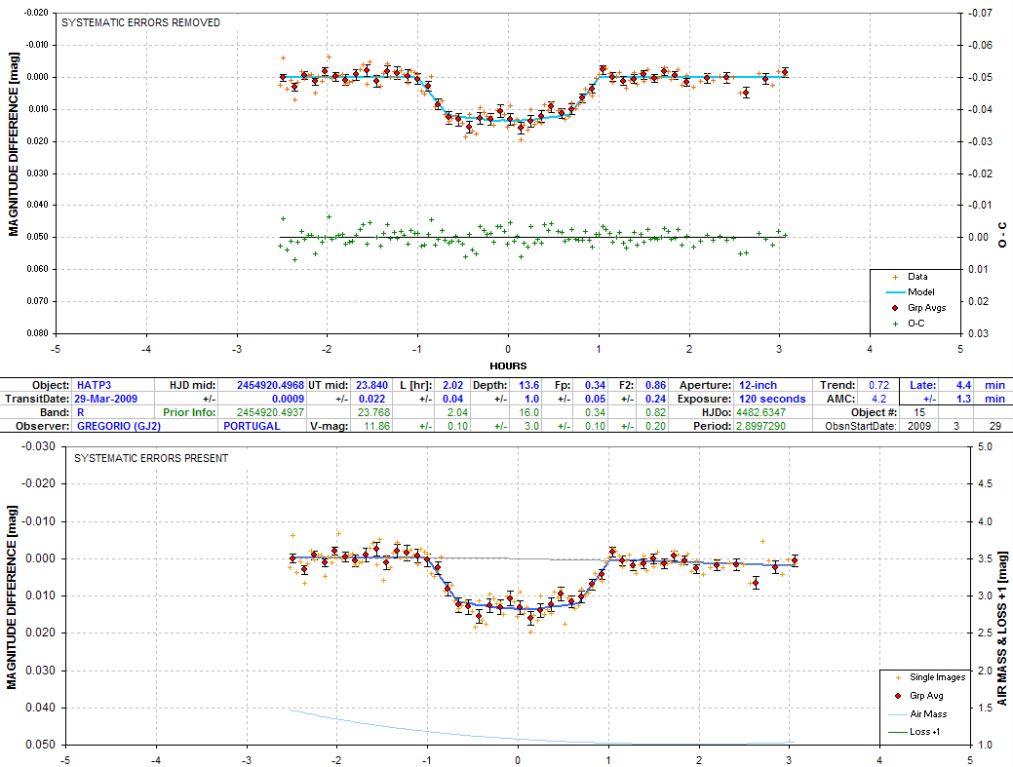
9329GJ21
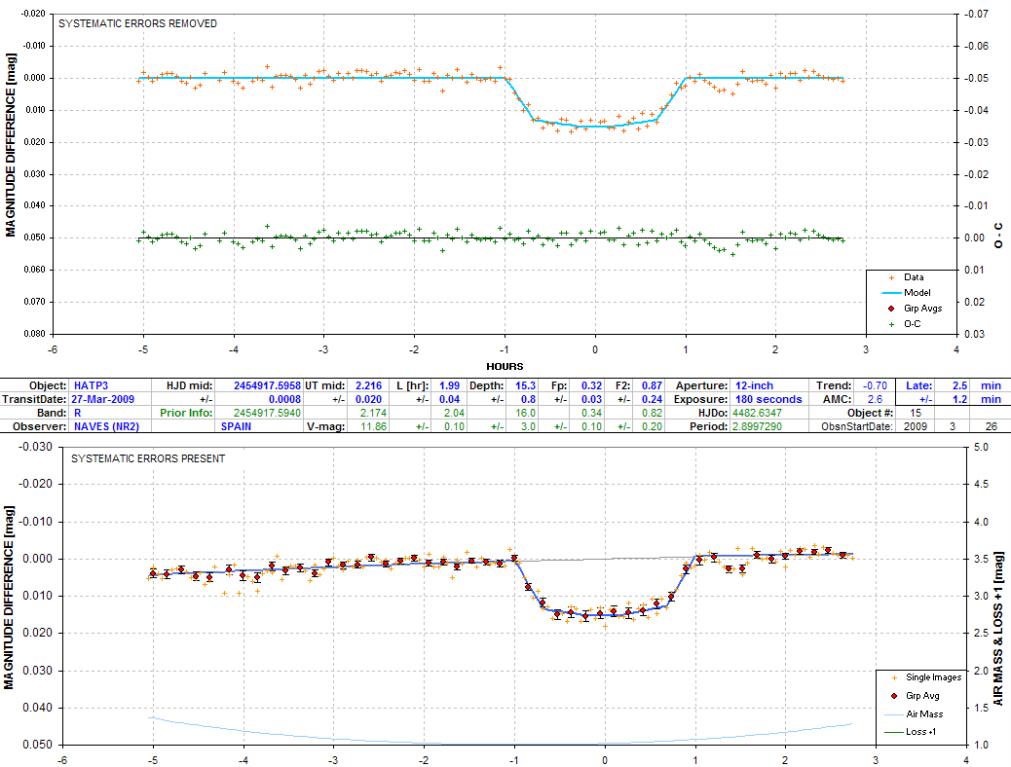
9326NR21
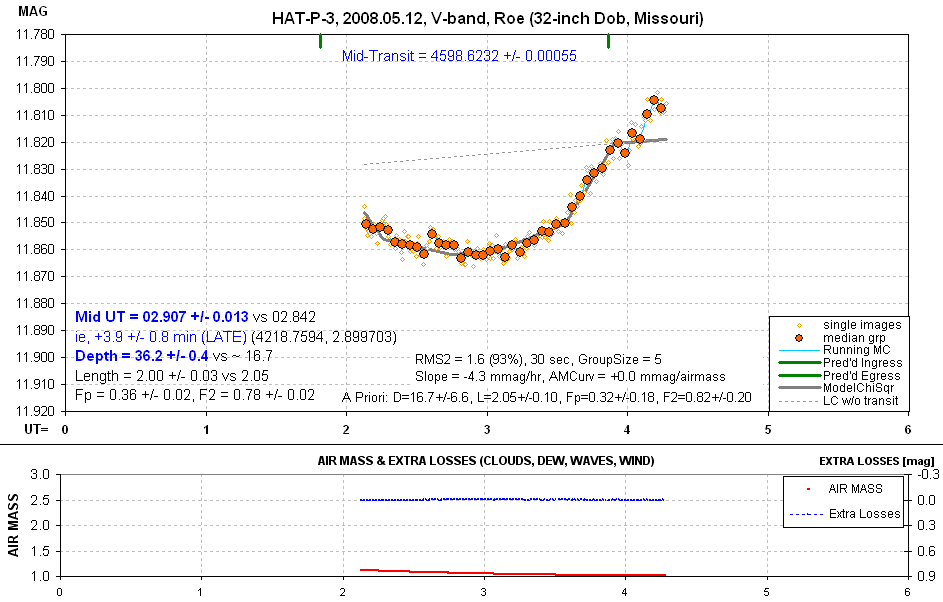
8512roe2 Note: It's very difficult
to observe exoplanet transits with a Dobsonian because of large image
rotation.
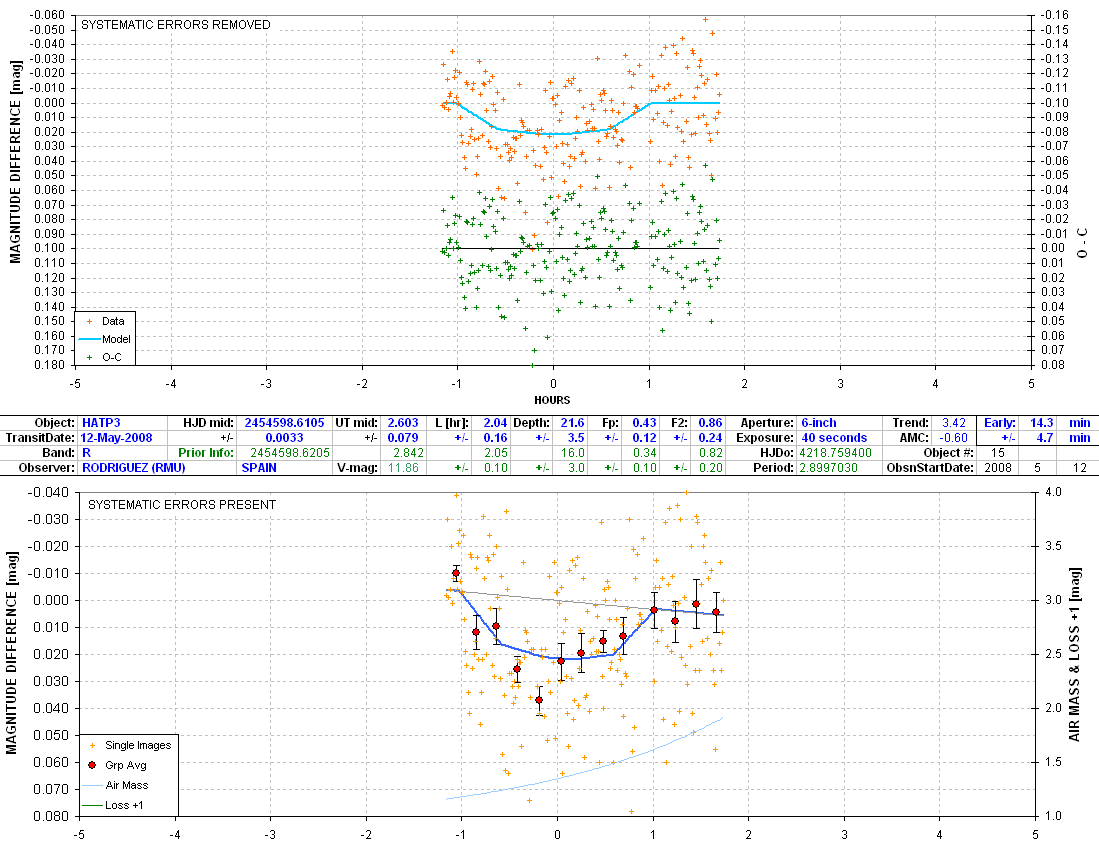
8512RMU1
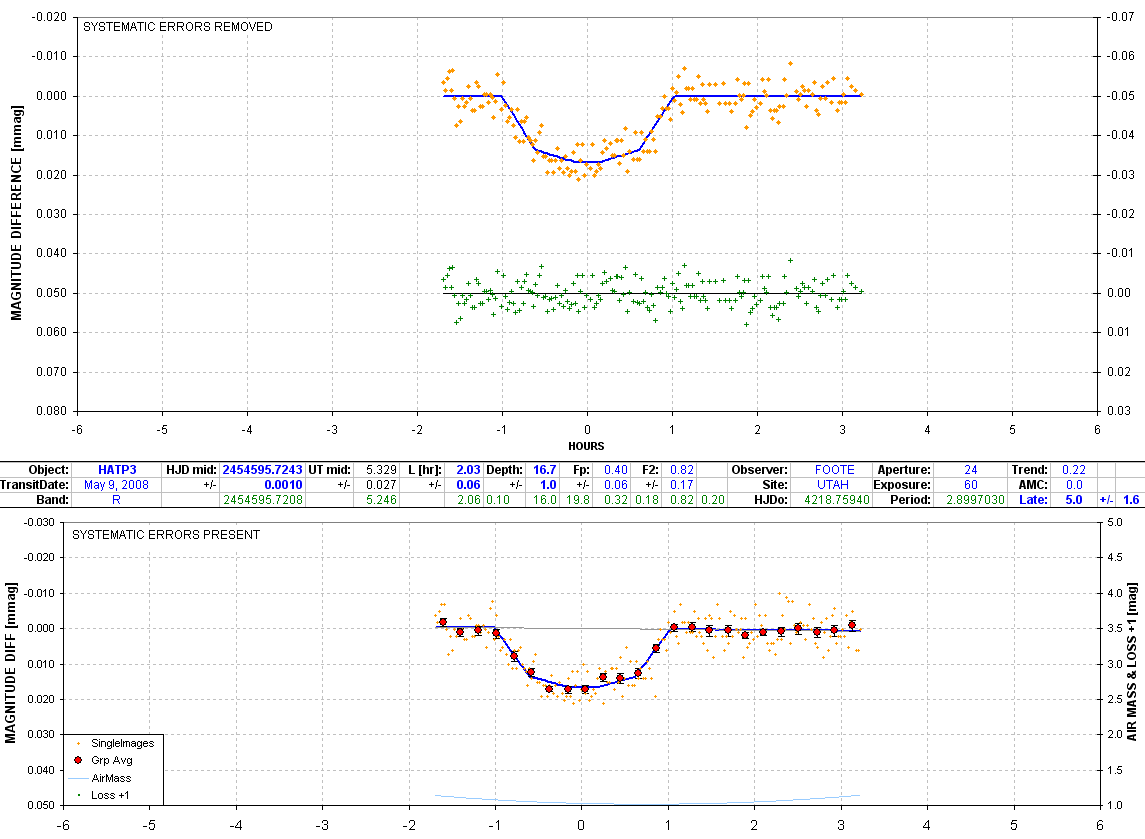
8509fcn1
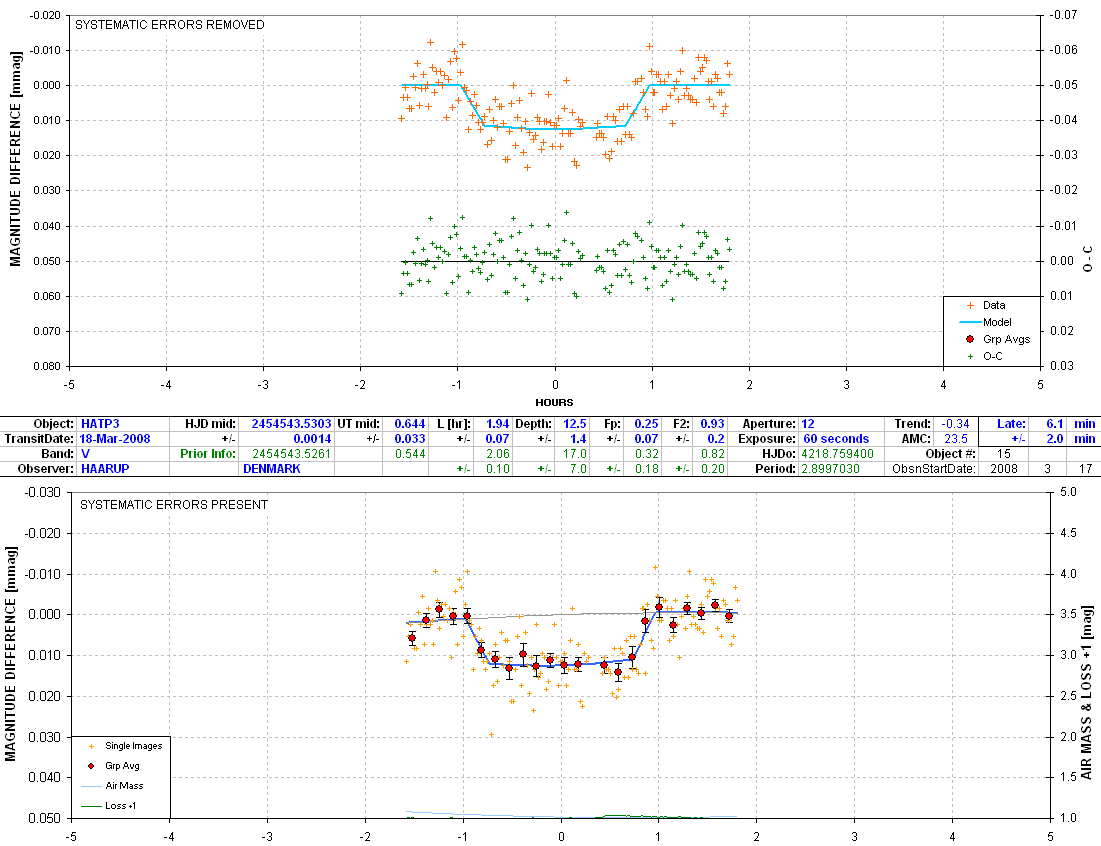
8317hnx1 This data has been shifted
-1 hour to acommodate what must have been a 1 hour clock error; without
this correction mid-transit would have been 66 minutes late.
8217dsx1
8215sgx1
8117nra1 Good!
7c21HVP1
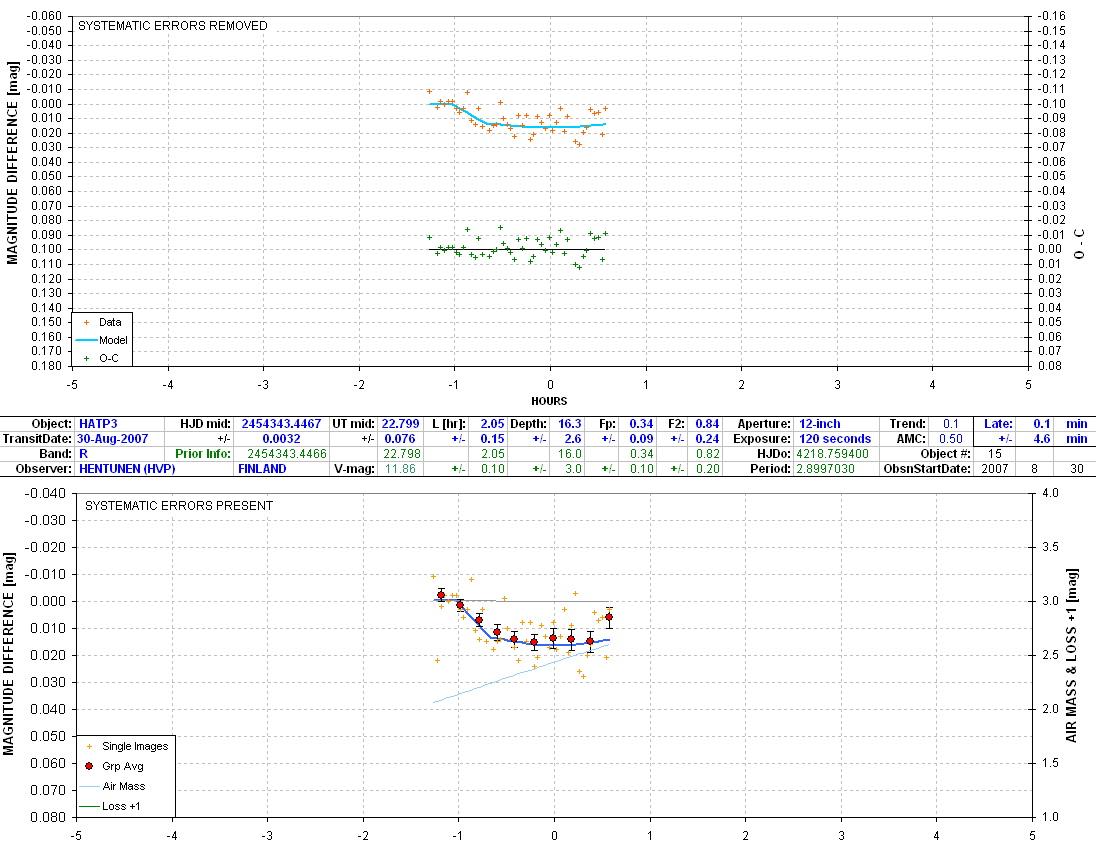
7830HVP1
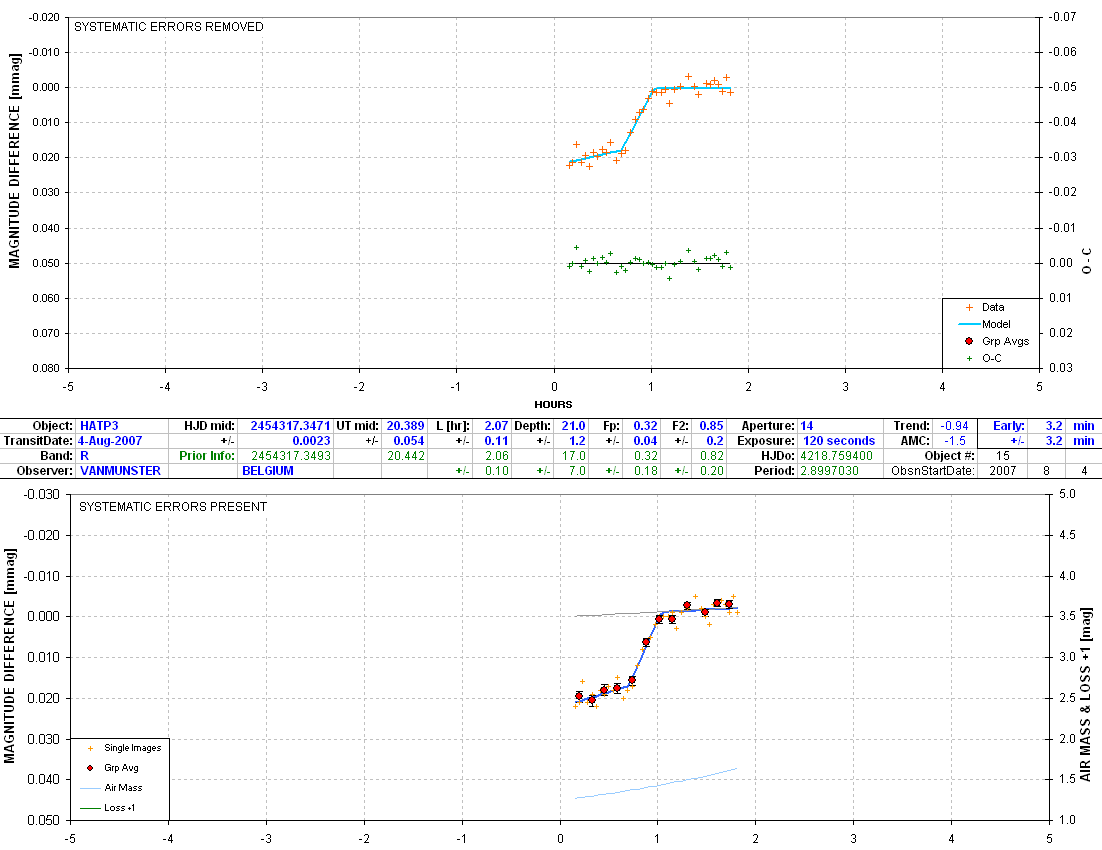
7804vmt1 Partial transits are useful
for investigating the presence of anomalous brightenings after egress
(or before ingress) that could be caused by the hot Jupiter having a
ring system or dust cloud (i.e., forward scattering).
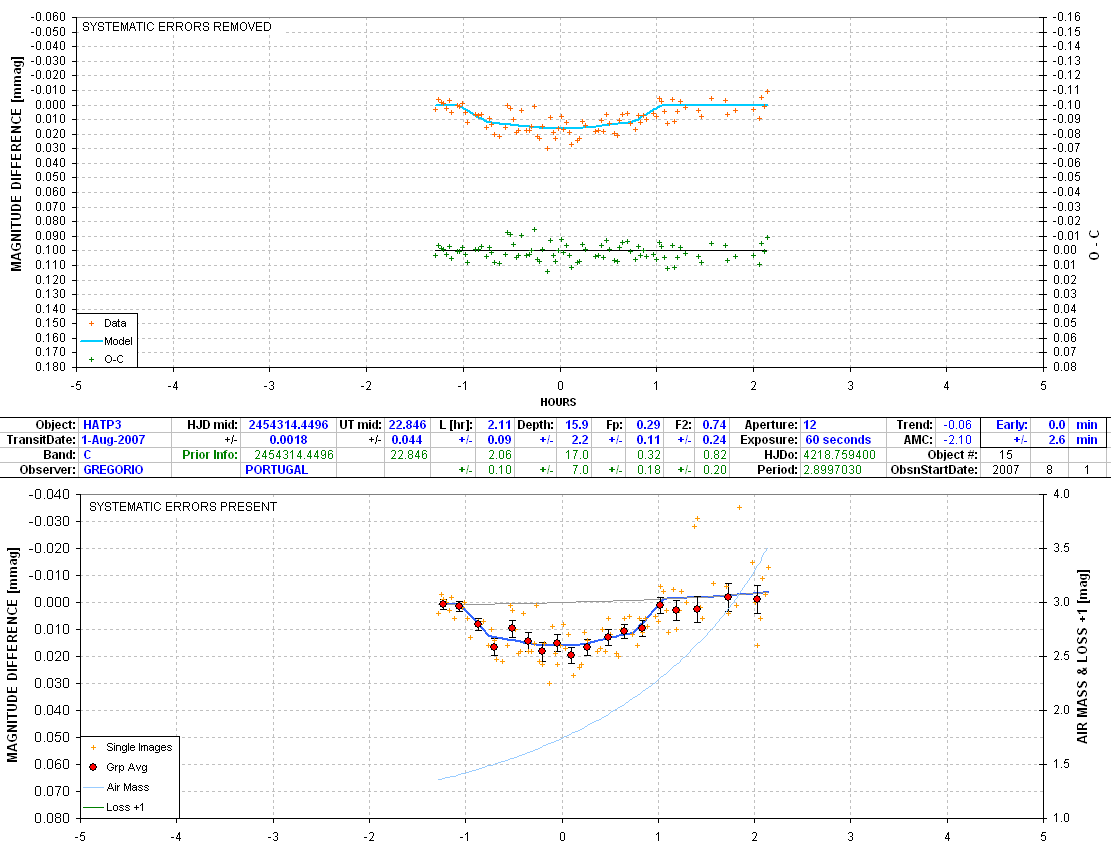
7801gjl1 Valiant effort 3.5 months
after the object's "season." Large air mass seems OK. Length &
mid-transit are uncertain due to lack of pre-ingress OOT. Depth differs
from discovery paper's 14 mmag but the filter bands are at opposite
ends of the visible spectrum (IR-blocking versus Sloan i-band). [Based
on revised submission, 7903]
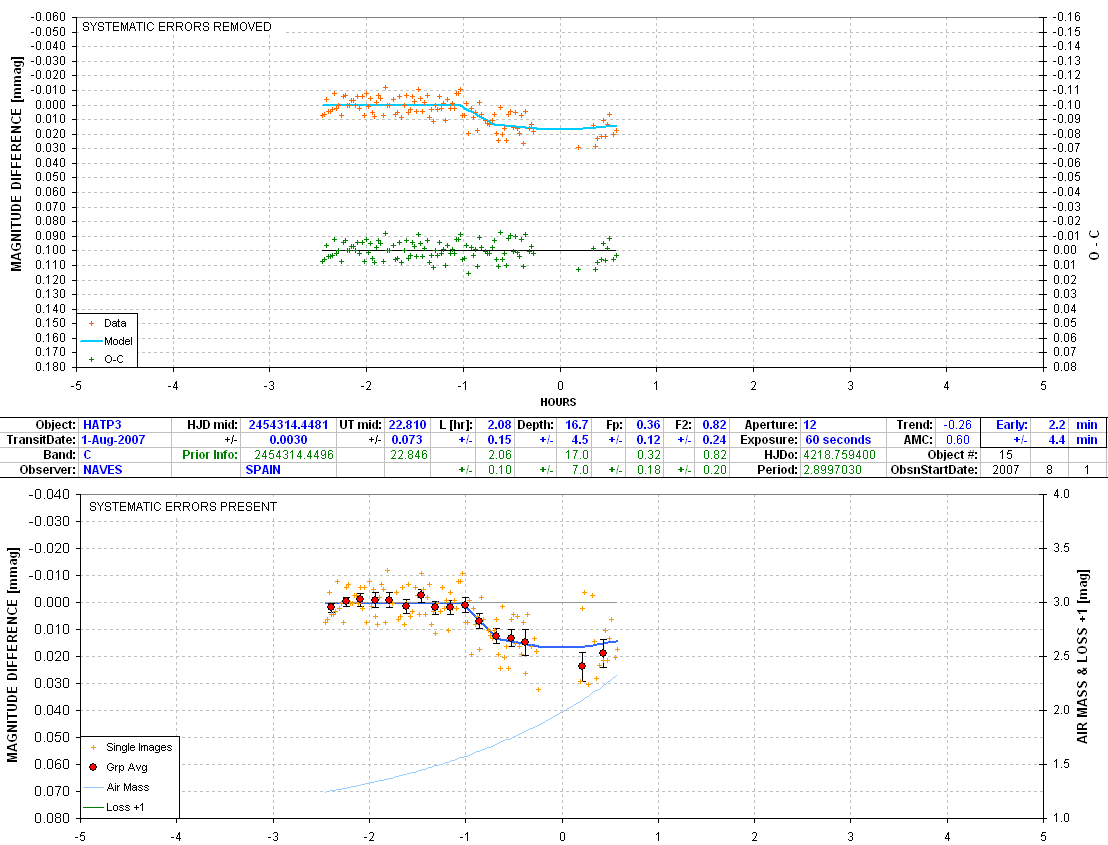
7801nra1
Out-of-Trransit
(OOT) Light Curves
9301LC21
Finder Image
Return to calling web page AXA
WebMaster: Bruce
L. Gary. Nothing on this web page is copyrighted. This site opened: August 06, 2007. Last Update: 2009.06.19