Asteroid 285263 (1998 QE2) will pass within ~ 15 times the distance to the moon on 2013 May 31. It's diameter is estimated to be ~ 2.7 km and will be as bright as V-mag ~ 11.0. Observability shifts from southern hemisphere to northern when it crosses the celestial equator on 2013 June 5. A rotation light curve was obtained by Kevin Hills during 2013 May 02 - 10; the shape was sinusoidal, the period was 5.281 hours and the semi-amplitude was ~ 90 mmag.
I began photometric monitoring on May 24, using a 11-inch
aperture Celestron telescope at my Southern Arizona observatory
(Hereford Arizona Observatory, HAO, G95). All observations
to date are with a r'-band filter and magnitude calibrations for
each star field are based on APASS magnitudes (in the UCAC4
catalog). My FOV is 22x14 'arc (changed to 18 x 12 'arc June 2,
when I removed a focal reducer lens), so each night requires
several FOV moves. This means that a different set of APASS stars
are used for calibration for each of the half dozen FOV's per
observing session. Joining the several LC segments for an
observing session therefore can require magnitude adjustments for
each FOV. Based on the internal consistency of APASS star
calibrations (RMS ~ 25 mmag for N ~ 15) the FOV adjustments should
be accurate to better than ~ 15 mmag. Since the asteroid's
variation with rotation is much larger, of order 200 mmag, it
should be possible to combine FOV LC segments to derive an entire
observing session's LC.
On May 27 I sent an e-mail (to Benner and Warner) with tentative
results for a light curve pattern that repeated with an interval
(that I associated with the asteroid's period) of 4.73 hours. I
suggested that the asteroid might be tumbling because of the
difference in apparent brightness periodicity between Kevin Hills'
observations and mine, 3 weeks later. Subsequent observing
sessions show the same periodicity (P = 4.76 hours).
Related Links
Nightly & Individual
Light Curves
Hardware, Observing
and Processing Procedure
Mosaic
Flattening Equation (MFE) method for flat fielding (when the
standard flat field is severely affected by reflected light)
Summary of Results To Date
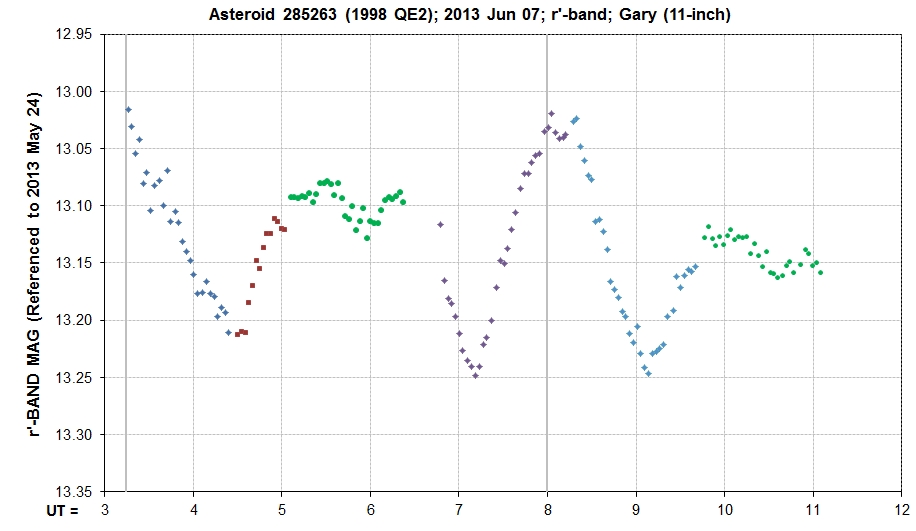
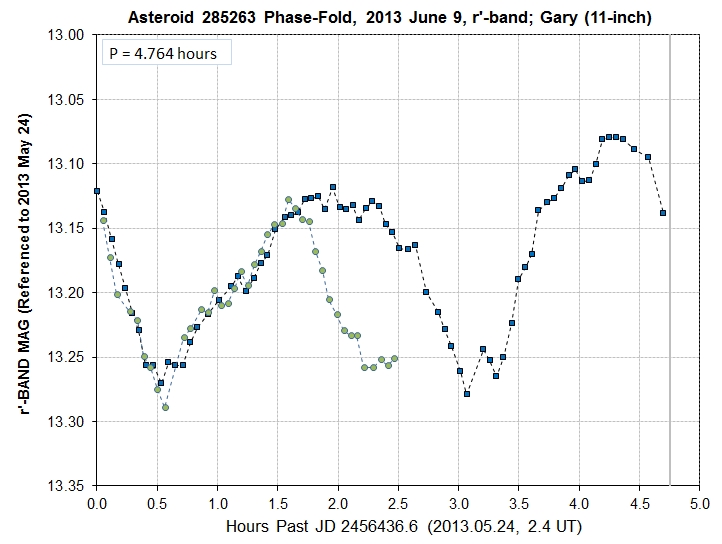
This asteroid appears to be rotating with a period of 4.764 ±
0.020 hours. This result is based on 6 observing sessions (another
9 remain to be processed). Observations made in early May by Kevin
Hills have been analyzed a couple times by Brian Warner, yielding
periods of P = 5.281 hours and 2.3736 ± 0.0003 hours. My
data exhibits a repeating pattern with an interval of 4.764 hours.
I have no explanation for these discrepancies.
The easiest way to show that my LCs exhibit a repeating pattern
with an interval of 4.764 hours is to present a LC for observing
session longer than this interval and show how data after the
first 4.764 hours exhibits the same shape as the earlier data.
Here's one example:
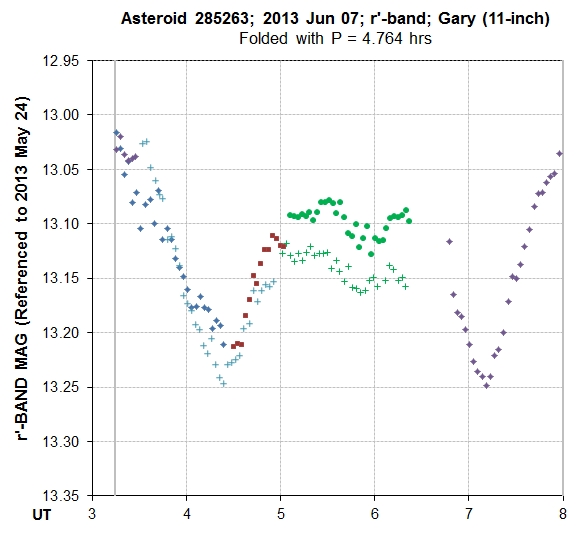
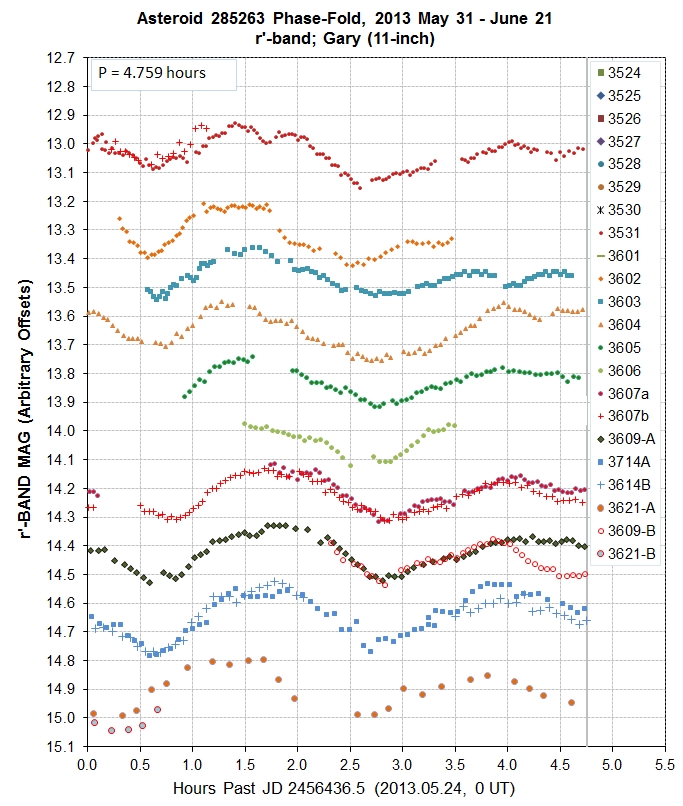
The pattern is the typical asteroid one of 2-peaks and 2
valleys. Notice that for the earliest data (at top) the deeper
minimum is at ~ 3.0 hours in the figure, whereas a week later the
deeper minimum is the one at 0.5 hours.
I tentatively conclude that the LC shape has a shape that repeats at intervals of ~ 4.7 hours.
Related Links
Description of
hardware, image processing and photometry analysis procedures
Display of individual LCs
____________________________________________________________________
WebMaster: Bruce L. Gary. Nothing on this web page is copyrighted. This site opened: 2013 May 29.