Summary
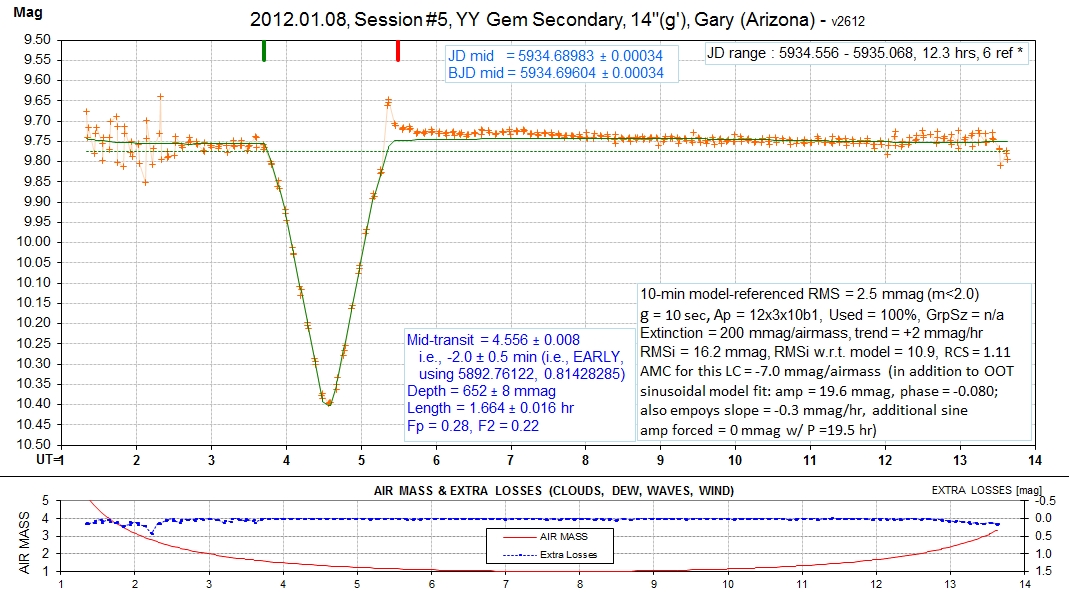
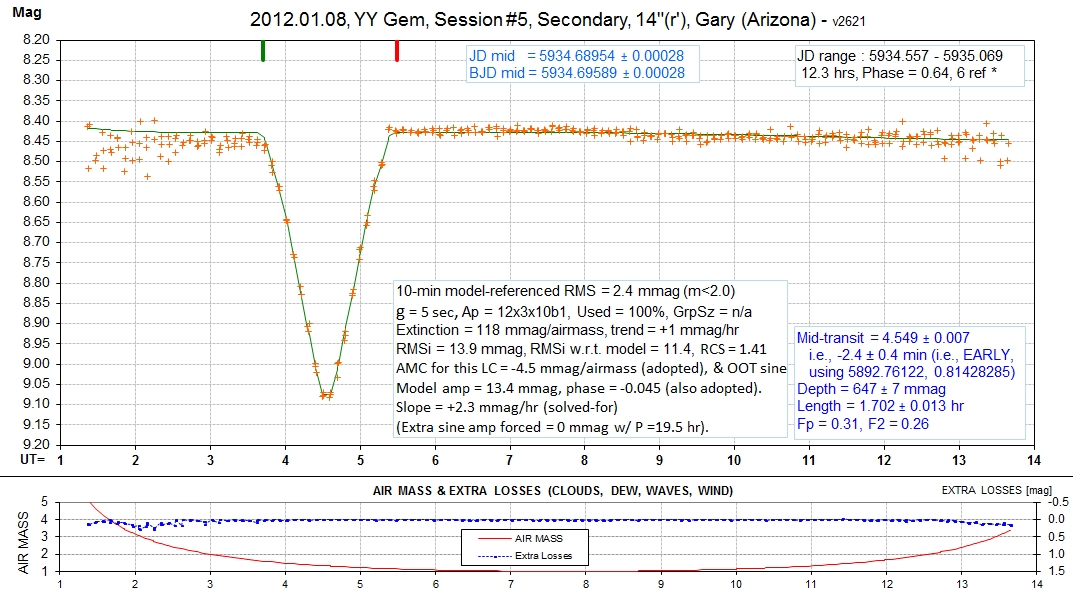
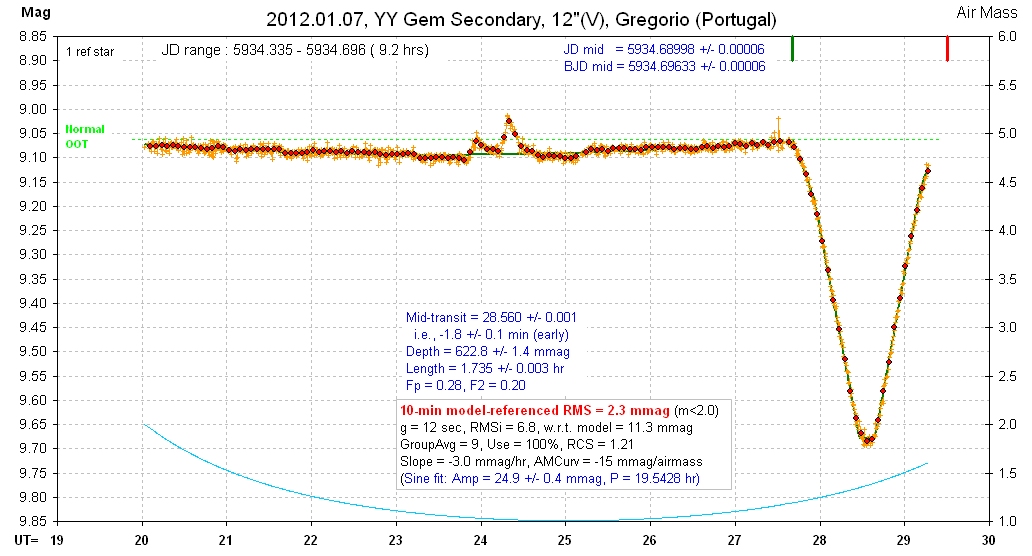
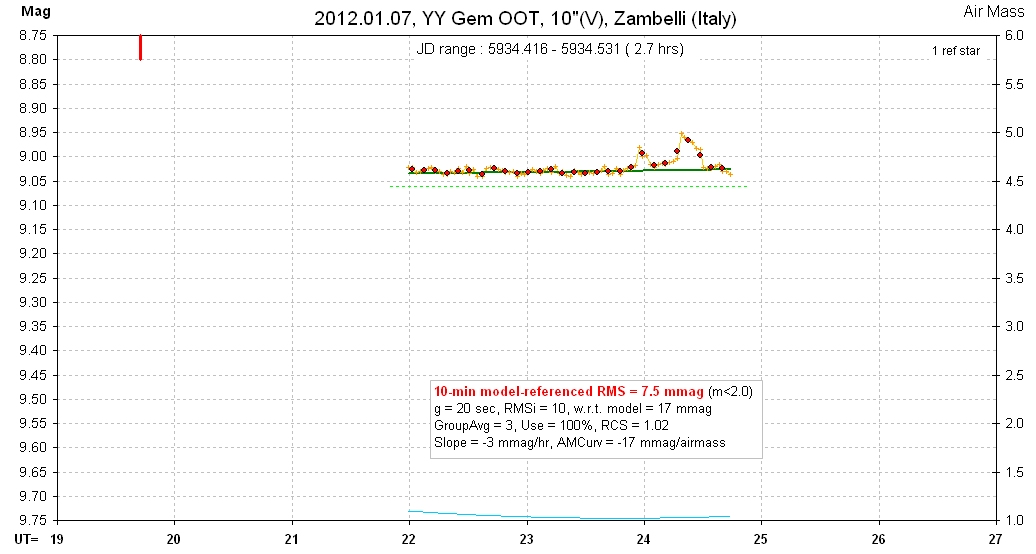
Flares at 23.9 & 24.3 UT, 40 & 80 mmag (V).
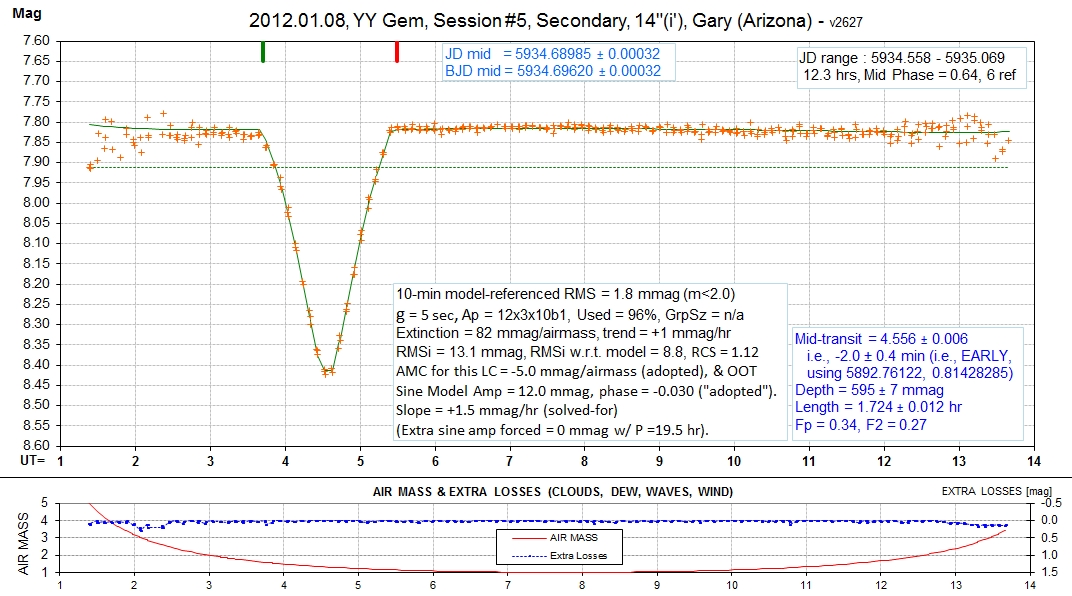
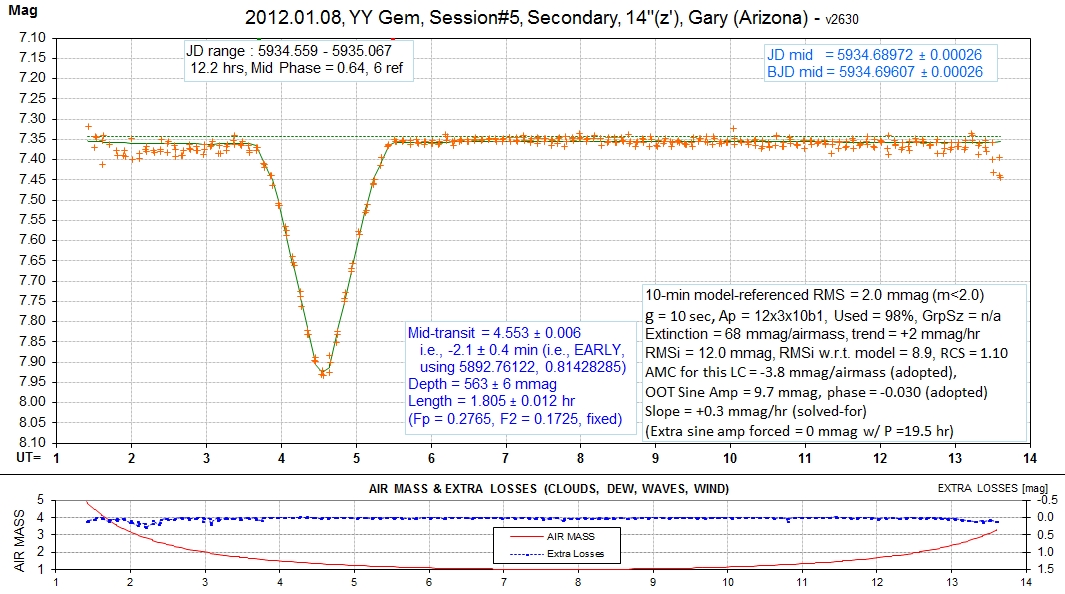
YYYYMMDD    JD start - JD end    Len[hr]  Band  Observer     Event    Flares       Sine Amp      Comments

2012.01.08  5934.556 - 5935.068 12.3 hrs   g'   Gary         S        1 flare ?                  Pre-ingress ~ expected; post egress & flare too bright
2012.01.08  5934.557 - 5935.069 12.3 hrs   r'   Gary         S        1 flare      45 mmag
2012.01.08  5934.558 - 5935.069 12.3 hrs   i'   Gary         S        No flare     25 mmag
2012.01.08  5934.559 - 5935.067 12.2 hrs   z'   Gary         S        No flare     26 mmag
2012.01.07  5934.335 - 5934.696  9.2 hrs   V    Gregorio     S        2 flares     25 ± 1 mmag   OOT low (?)
2012.01.07  5934.416 - 5934.531  2.7 hrs   V    Zambelli     OOT      2 flares     none          Same essential structure as Gregorio
____________________________________________________________________
WebMaster: B. Gary. Nothing on this web page is copyrighted. This site opened: 2012.01.08. Last Update: 2012.06.30, 16:50 UT