Summary
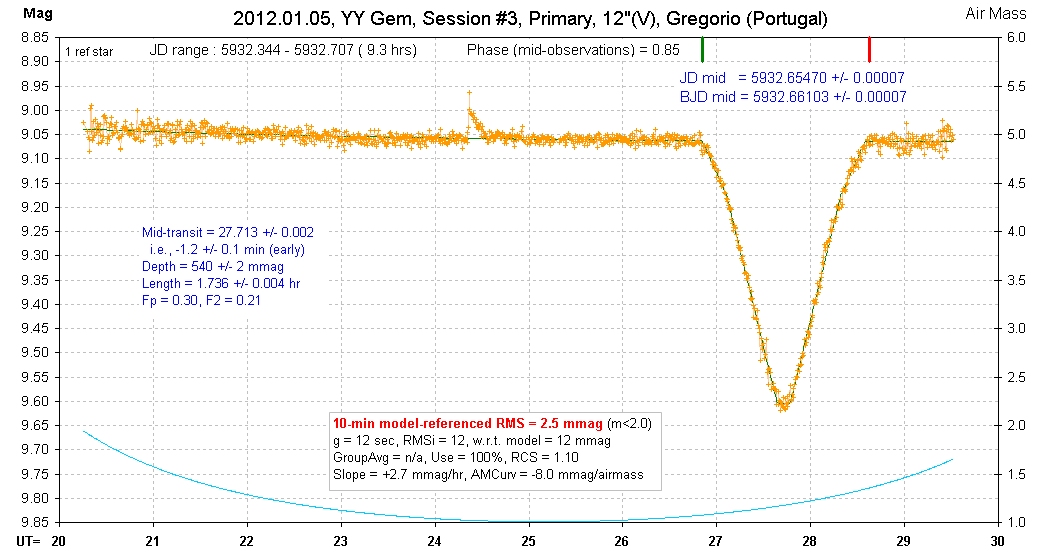
Flare at 24.3 UT, 80 mmag (V) & maybe 04.2 UT.
YYYYMMDD JD start - JD end Len[hr] Band Observer Event Flares & Comments
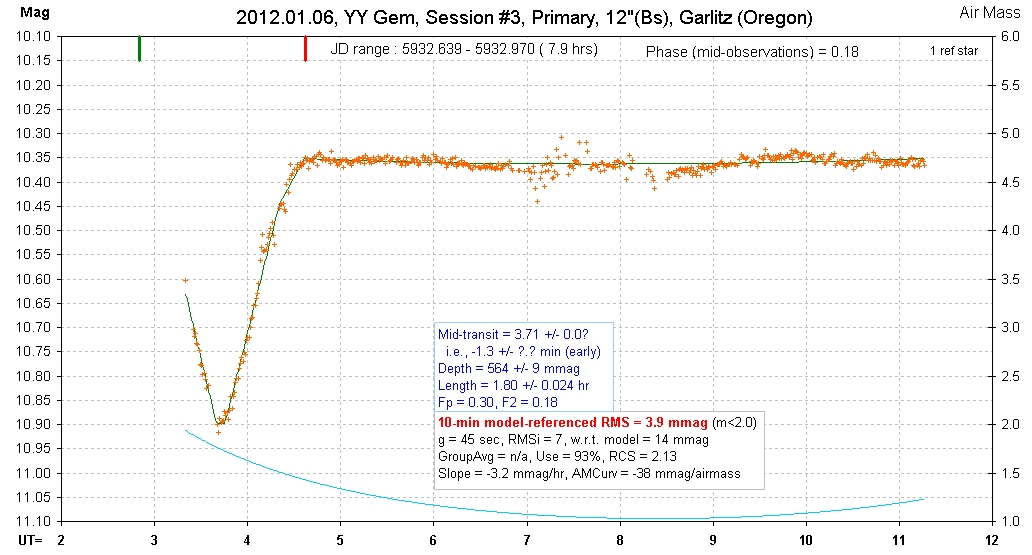
2012.01.06 5932.639 - 5932.970 7.9 hrs Bs Garlitz P Maybe tiny flare at 4.3 UT
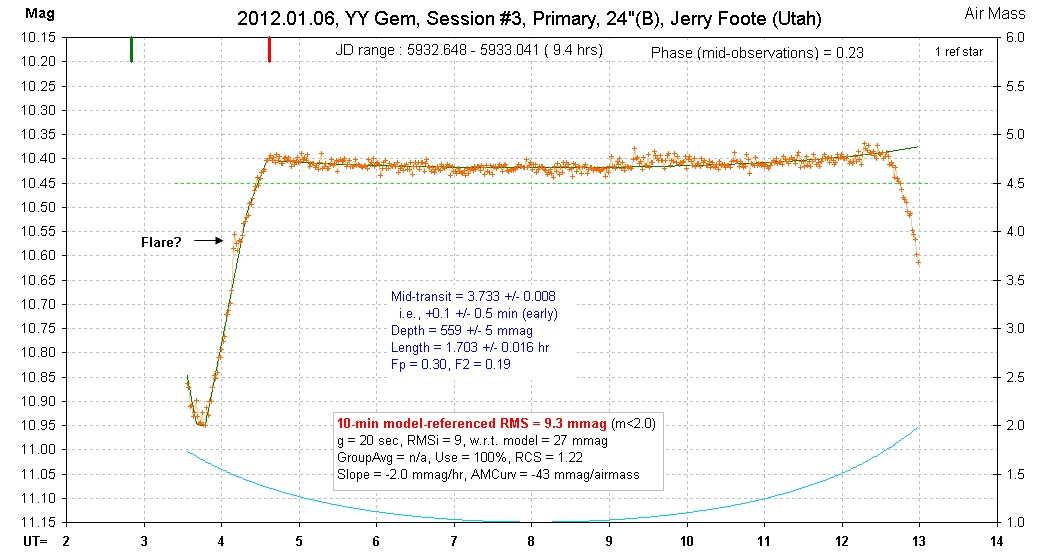
2012.01.06 5932.648 - 5933.041 9.4 hrs B Foote J P & S maybe flare during primary egress
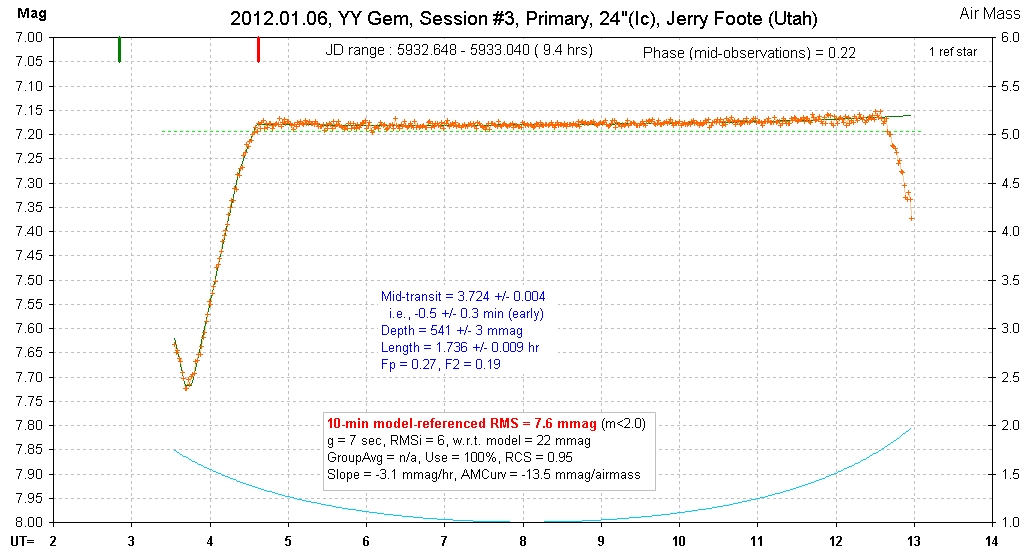
2012.01.06 5932.648 - 5933.040 9.4 hrs Ic Foote J P & S no flares
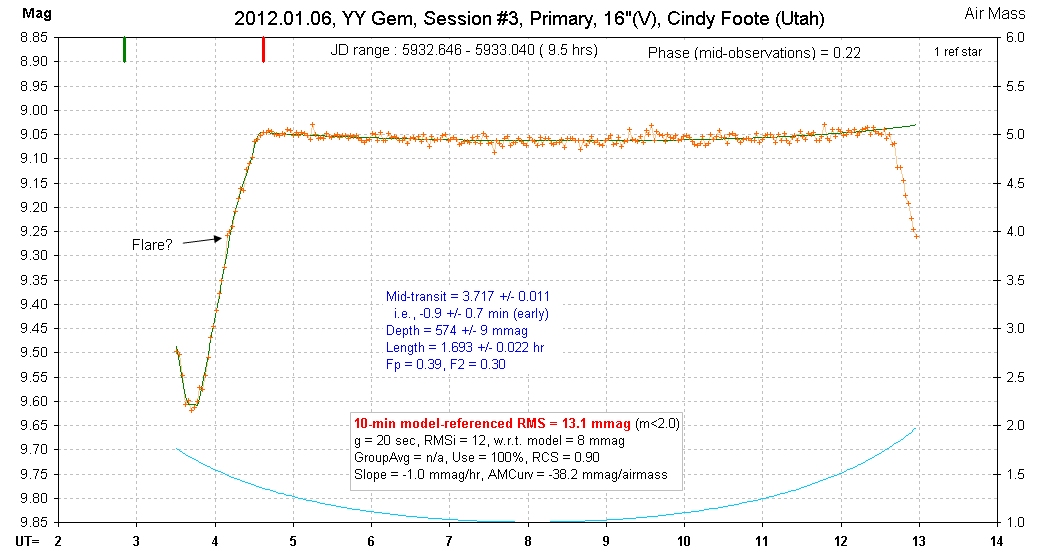
2012.01.06 5932.646 - 5933.040 9.5 hrs V Foote C P & S no flares (tho maybe a tiny one at 04.2 UT)
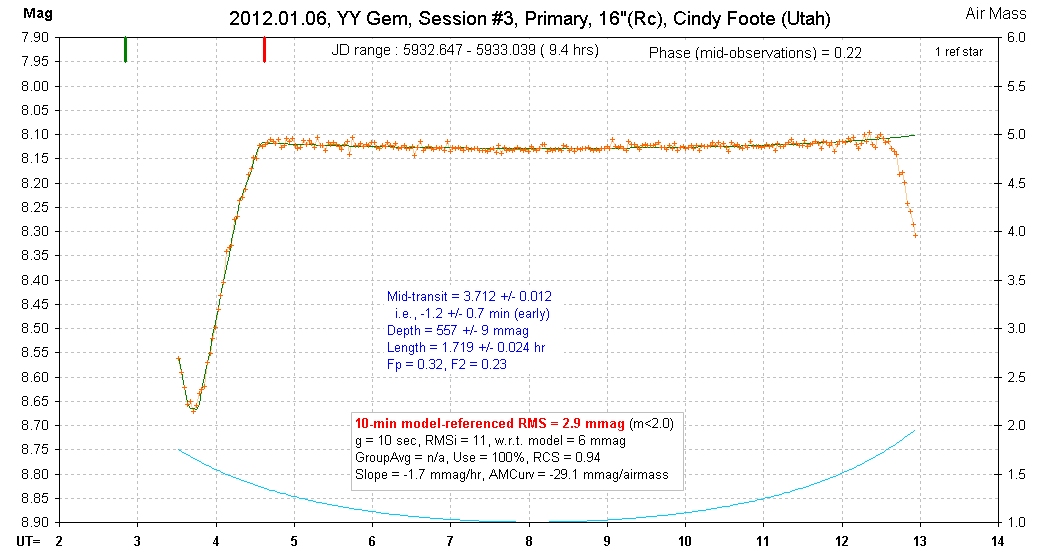
2012.01.06 5932.647 - 5933.039 9.4 hrs Rc Foote C P & S no flares
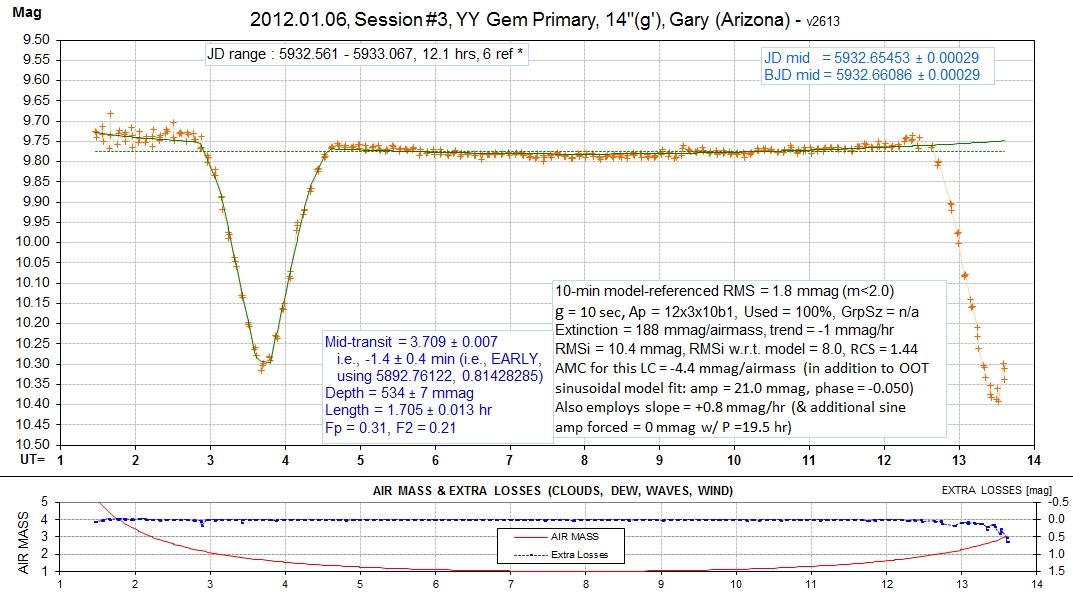
2012.01.06 5932.561 - 5933.067 12.1 hrs g' Gary P & S no flares
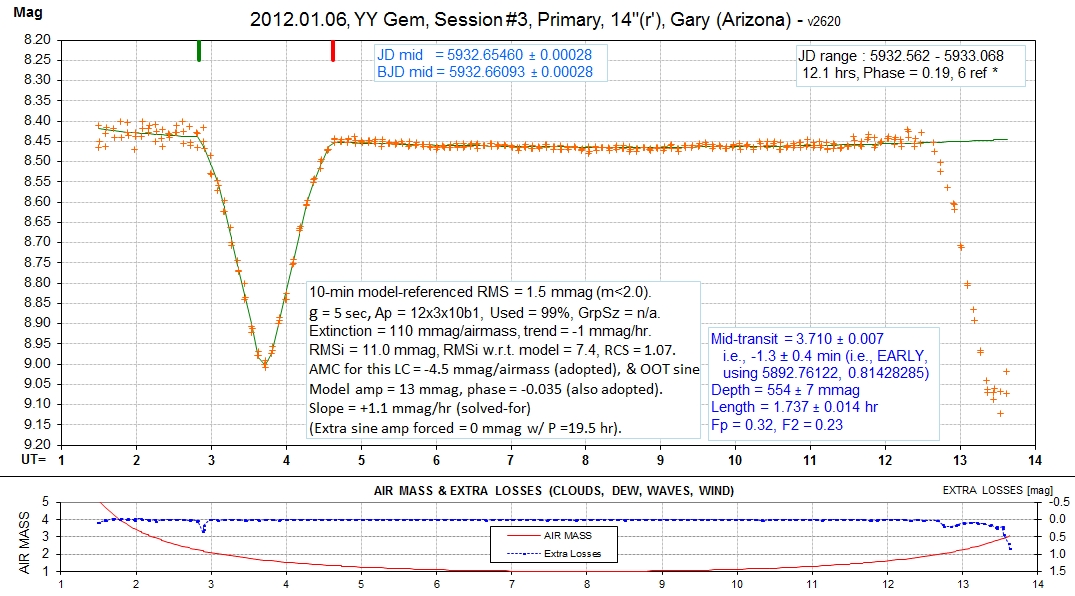
2012.01.06 5932.562 - 5933.068 12.1 hrs r' Gary P & S no flares
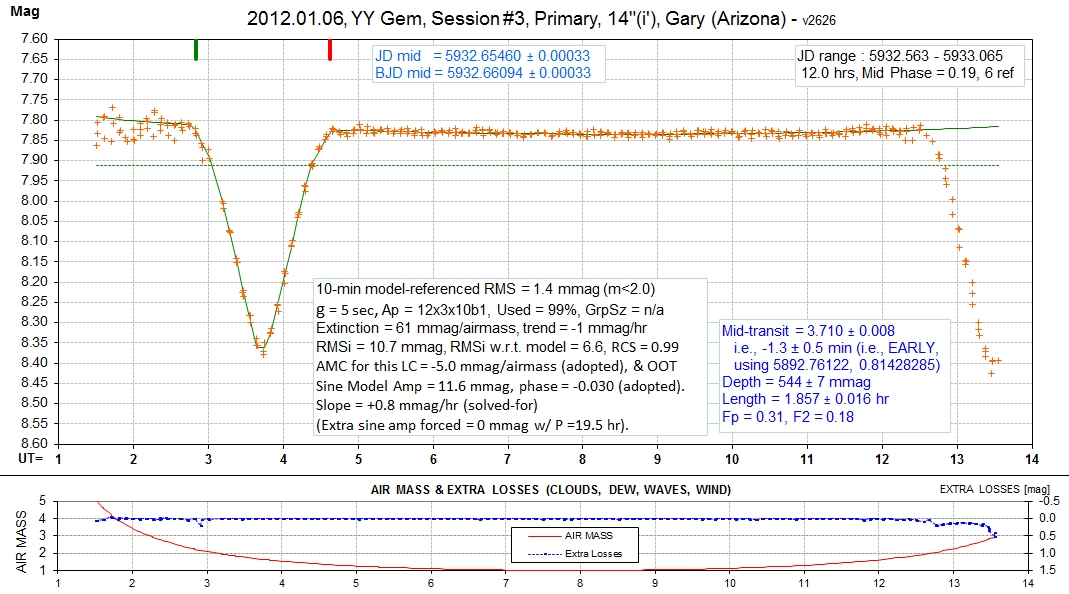
2012.01.06 5932.568 - 5933.066 12.0 hrs i' Gary P & S no flares
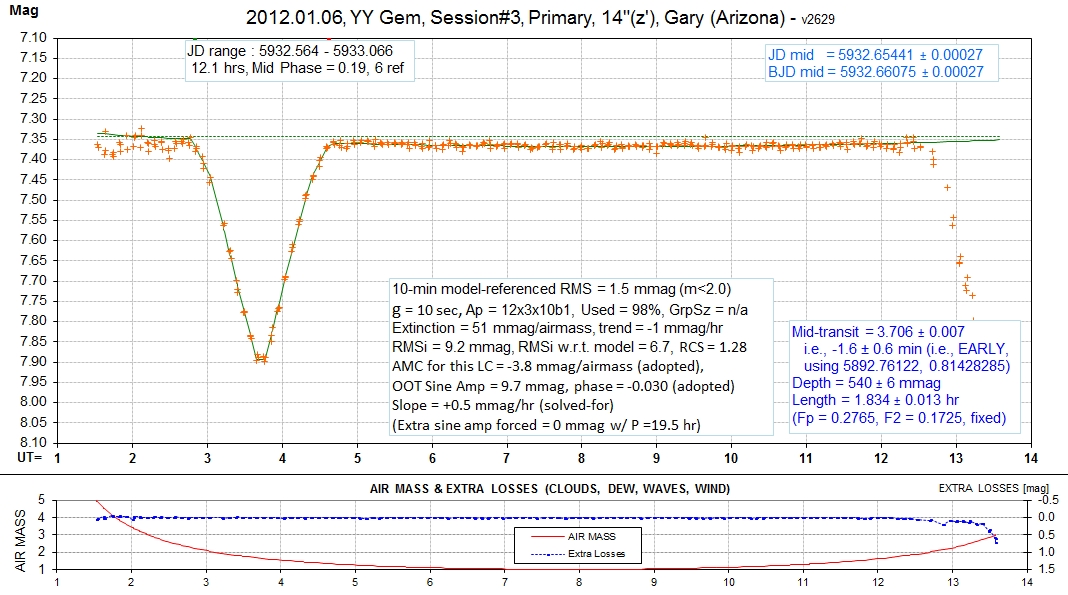
2012.01.06 5932.564 - 5933.066 12.1 hrs z' Gary P & S no flares
2012.01.05 5932.344 - 5932.707 9.3 hrs V Gregorio P 1 flare, 24.3 UT
____________________________________________________________________
WebMaster: B. Gary. Nothing on this web page is copyrighted. This site opened: 2012.01.30. Last Update: 2012.06.30, 00:30 UT