WD 1213+528 (a.k.a. EG UMa)
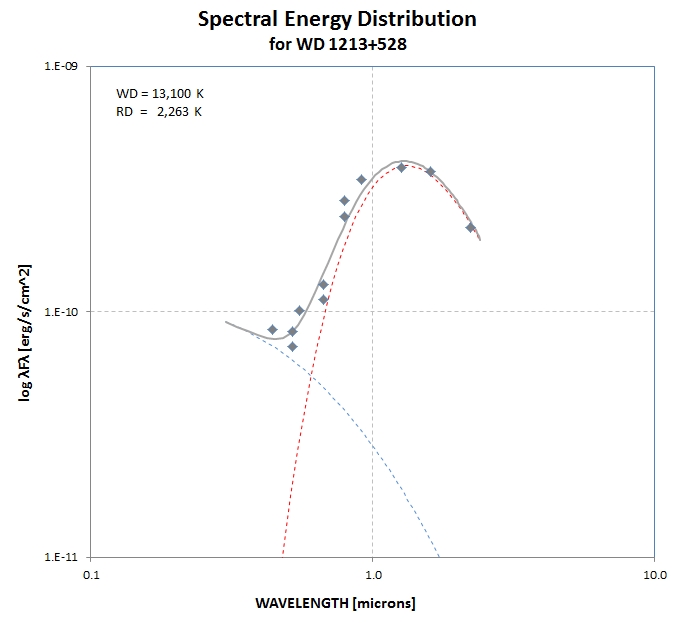
This web page is devoted to a description of observations and (amateur) modeling of the above "white dwarf/red dwarf" binary system. Since starting this web page I learned that WD 1213+528 has another name, EG UMa, and is a well-studied system. Recent observations (referring to it with the 2nd name) reveal it to be sufficiently observed and understood (flares, sizes, masses, inclination, ephemeris, etc) to not warrant further observations by amateurs. Therefore, this web page has been "frozen" at a state where I was just learning these things. Please disregard everything on this web page.
Links Internal to This Web Site  
  
Phase-folded Light curves
    Explanation Possibilities
    Modeling the Red Dwarf Hot-Side Explanation
    Modeling Red Dwarf Starspot Explanation
   Follow-up Observations

Background

WD 1213+528 was discovered to be a DA white dwarf by Stephenson (1960) using a UV prism. Greenstein (1965) determined that the WD must have a non-WD companion based on emission lines.
Stephenson (1971) determined that the companion was a red dwarf, having a spectral type of dM2. Lanning (1982) obtained a RV plot from measurements of dM2's H-alpha emission line and showed that WD1213+528 is a spectroscopic binary with a period of 16.0236 (24) hours.  Sion et al (1984) derive a temperature for the WD component of 13,000 (500) K.  Shimanskii and Borisov (2002) state that the red dwarf rotates faster than the synchronous rate by a factor of 2 or 3. Bleach et al (2000) conclude that no reflection effects are present, and give the following ephemeris: HJD = 2449800.79131(58) + E × 0.66765930(57).  They also give Teff for the white and red dwarfs of 31125(125) and 3150(150) K. The red dwarf is thought to be a spectral type dM4.0-4.5. It is believed that this binary has evolved through a "common envelope" phase (with considerable mass loss) and is destined to become a cataclysmic variable.
 
Present Light Curve Observations


The individual light curves for WD 1213+528 (hereafter referred to as "WD1213") can be found at the PAWM2 web site: link.
In the phase-folded light curves that follow I adopt the Kaminskii & Borisov (2002) or Lanning (1982) ephemerides; whereas the K&B ephemeris is accurate enough for establishing the phase of contemporary observations, the ephemeris of Lanning isn't. The next three graphs are phase-folded light curves (LCs) using a Cb, g' and i' filters.


Figure 1a. Phase folded LC for Cb filter (clear with blue blocking) using data from 2 observing dates.


Figure 1b. Phase folded LC for g'-band filter using data from 3 observing dates. Magnitude scale is set by 18 APASS stars.


Figure 1c. Phase folded LC for i'-band filter using data from 2 observing dates. Magnitude scale is set by 18 APASS stars.

The red dwarf occasionally flares. On 2013.04.14 a flare was observed.


Figure 2. Flare event on 2013.04.14. Peak ~ 20 mmag, 1/2-life ~ 0.6 hr.


Possible Explanations for Variability

Ellipticity of the red dwarf is possible, but it could not account for the variations seen since an elliptic star rotating in synchrony with its orbital revolution would produce two peaks and two minima per orbital period. We know the orbital period from RV measurements, and we observe only one peak and one minimum per orbital period.

A hot spot on the WD from infalling dM2 gas (e.g., cataclysmic variable) would produce super-hump brightenings for every WD rotation. These brightness variations are irregular in timing and brightness, and they have periods of typically 1.5 hours. None of these properties are present for WD1213.

The red dwarf might be hotter on the side facing the white dwarf, and this would produce the observed single peak and minimum. So far, this is a viable interpretation (investigated below).

Starspots on dM2 would produce variations that repeat in a regular manner with the dM2 rotation period. Normally such starspot variations are greater at shorter wavelengths, but for WD1213 the opposite could exist due to the WD's dominance at short wavelengths.

The last two of these explanations will be modeled for the remainder of this web page.

Hot Red Dwarf Modeling

Let's refer to the white dwarf as "WD" and the red dwarf as "dM2." If the brightest phase corresponds to dM2 being on the far side of WD, and if dM2 has a rotation period synchronized with the orbital period, then dM2's hotter side will be facing us at this brightest phase. Lanning derives MWD ~> 0.43 Msun and suggests RdM2 ~ 0.5 Rsun. Using this mass for WD allows an estimate for RWD <= 0.014 (0.010 - 0.015)
Rsun. A paper by Sion et al (ApJ, 279:758-762, 1984) estimates TWD = 13,000 (500) K. What temperature or dM2 should we adopt? If it were not heated by a nearby WD then we could adopt 2900 K, for example. But we should consider hotter temperatures. As for how much hotter we can be guided by the following graph of blackbody spectrae and filter passbands.

 
Figure 3. Blackbody functions for a dM2 star (2900 K & 2935 K) and a WD star (13,000 K) with radius = 0.014 x Rsun. Filter passbands for g', r' and i' are shown (adjusted for telescope optical transmission, CCD QE and atmospheric transparency; i.e. referred to top of atmosphere). 

This figure illustrates why it should be possible to make use of the brightness variation amplitude versus wavelength to solve for the dM2 disk brightness temperature variation as it rotates.
For i'-band essentially all the measured flux comes from dM2, whereas at g'-band less than half the flux comes from dM2. This indeed is what has been found, as Fig.'s 1b and 1c show. (B-band would be even more favorable for this task if SNR wasn't a consideration, since it has a passband centered at 430 nm, passing 370 to 500 nm; however, B-band is expected to have at least twice the noise level as g'-band. u'-band would be even better except for the fact that my aperture is too small to detect a 13,000 K WD star this faint.)

For the example used in the above figure, employing dM2 disk brightness temperatures of 2900 and 2935 K, the i'-band total flux produces a 73 mmag variation versus phase. This, indeed, is what is measured in the i'-band LC. The g'-band filter will see a smaller variation due to the increased presence of WD flux. For 2935 K the g'-band variation will be 39 mmag. This also is close to what is observed (~ 35 mmag). The ratio of i'-band to g'-band variation, which I'll refer to as "wavelength amplitude ratio" = 2.1 ± 0.3 (preliminary result).

An alternative to fixing RWD to
0.014 x Rsun and then solving for dM2's temperature range is to reverse the fix/solve relationship. For example, we could fix dM2 temperature minimum to 3000 K and solve for the temperature maximum and RWD .


The Fig. 1b and 1c phase-folded plots are preliminary, but for illustration purposes let's interpret the "wavelength amplitude ratio" of 2.1 ± 0.3 using the above figure to imply a WD radius = 0.022 ± 0.004 × solar. How does this compare with a radius predicted from the WD's mass? Consider the following plot relating WD radius to mass.


Figure 4. Radius/mass relationship for a few WDs with "known" values.

Lanning's mass for the WD component => 0.43 × Msun, and the above chart leads to a predicted radius of 0.014 ± 0.003 × Rsun. This suggests to me that the ratio of amplitudes (i' to g') can't be used to infer WD radius. This may be due to a lack of knowledge of the dM2e Teff. 

Now let's
evaluate the importance of dM2 disk brightness temperature variation with phase...


Figure 5. Spectral Energy Distribution (SED), using blackbody functions, fitted to measured magnitudes (from public catalogs).

I plan on conducting all-sky observations, at bands BVg'r'i'z', and expect to achieve accuracies of 0.025 for most bands. In addition, we should try to acquire a u'-band magnitude and search for an existing far IR satellite measurement. Using blackbody functions for SED fitting isn't good enough; we should employ an atmospheric model for the red dwarf (e.g., NextGen models by Hauschildt et al, 1999). These improvements will produce a more credible SED solution. 

Needed Follow-Up Observations

It's important to know if the peak brightness occurs when the red dwarf is on the far side of the white dwarf, as predicted by the "red dwarf hot side" model. This will require RV measurements with a professional telescope. I'm searching for a professional astronomer with an interest in collaborating in follow-up observations.

It might be worthwhile to obtain an all-sky magnitude in either U-band or u'-band.
A search should be made for satellite measurements at wavelengths longer than K-band.


References


Bleach, James N., Janet H. Wood, M. S. Catalan, W. F. Welsh, W. L. Robson and W. Skidmore, 2000, MNRAS, 312, 70-82.
Kaminskii & Borisov, 2002, Astronomy Reports, 46, 5 406-416.
Lanning, Howard R., 1982, AJ, 253:752-755.
Sion, E. M., F. Wesemael and E. F. Guinan, 1984, ApJ, 279, 758-762.


Return to PAWM2 web page

WebMaster:
B. Gary.  This site opened:  2013.04.08 Last Update:  2013.04.20, 17 UT