Sample Data with Autocorrelation & Power Spectrum Plots
This web page illustrates
measurements used to characterize isentrope "wrinkle" statistics in the
Southern Hemisphere stratosphere. The results of that study are
presented in an article that will be submitted to the Atmospheric Chemistry and Physics
on-line journal. The same analysis procedure was used in a study of
Northern Hemisphere stratosphere wrinkles, also called "mesoscale
temperature fluctuations," which was published in 2006. http://www.atmos-chem-phys.net/6/4577/2006/acp-6-4577-2006.html
It was discovered that the SH differs from the NH by having smaller amplitude wrinkles. The wrinkle amplitude varies in the same way with season, but thry are only ~27% the amplitude of those in the NH.
The SH analysis is based on 22 ER-2 flights that produced 81 straight-line flight segments without an altitude change. 75 of these flight segments were over ocean, and most were based in Christchurch, New Zealand.
The rest of this web page consists of sections devoted to a few specific flight segments. The author can provide similar data for the other flight segments. The first flight daate section has more graphs than the others in order to convey the analysis that was done for all flight segments.
1994.10.13 -----------------------------------------------------------------------------------------------------------------------------------------------
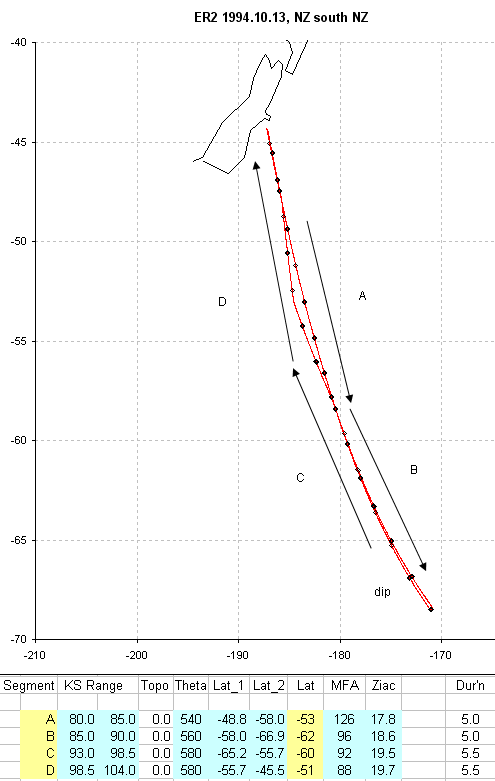
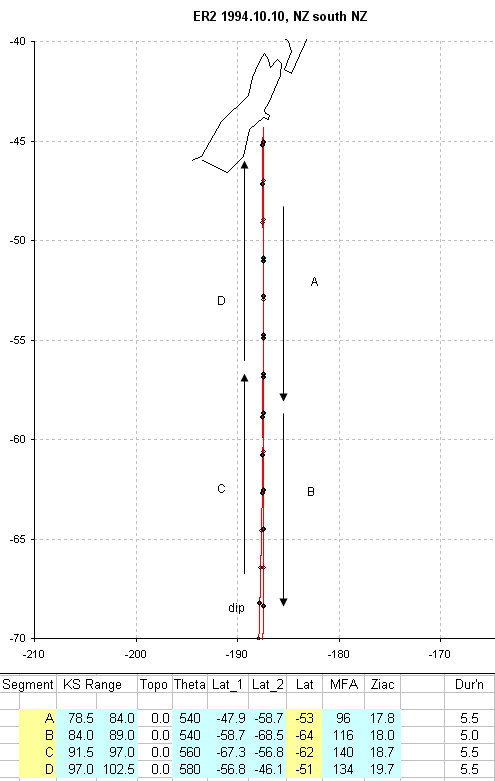
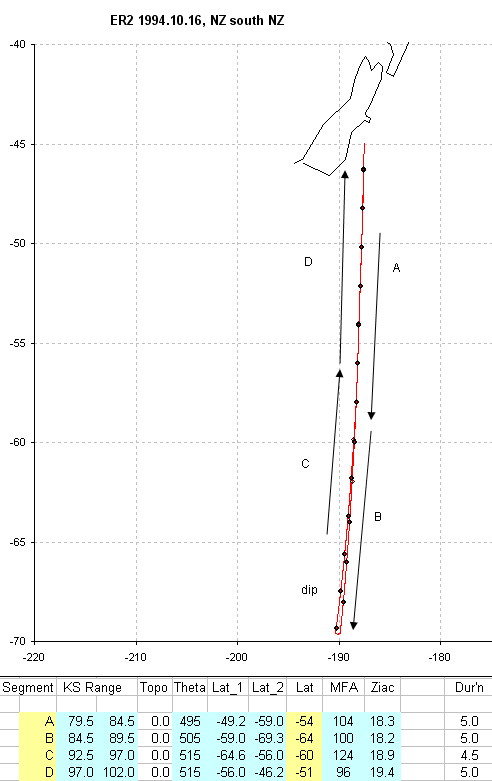
Flight track and flight segment assignments for ER-2 flight of 1994.10.13.
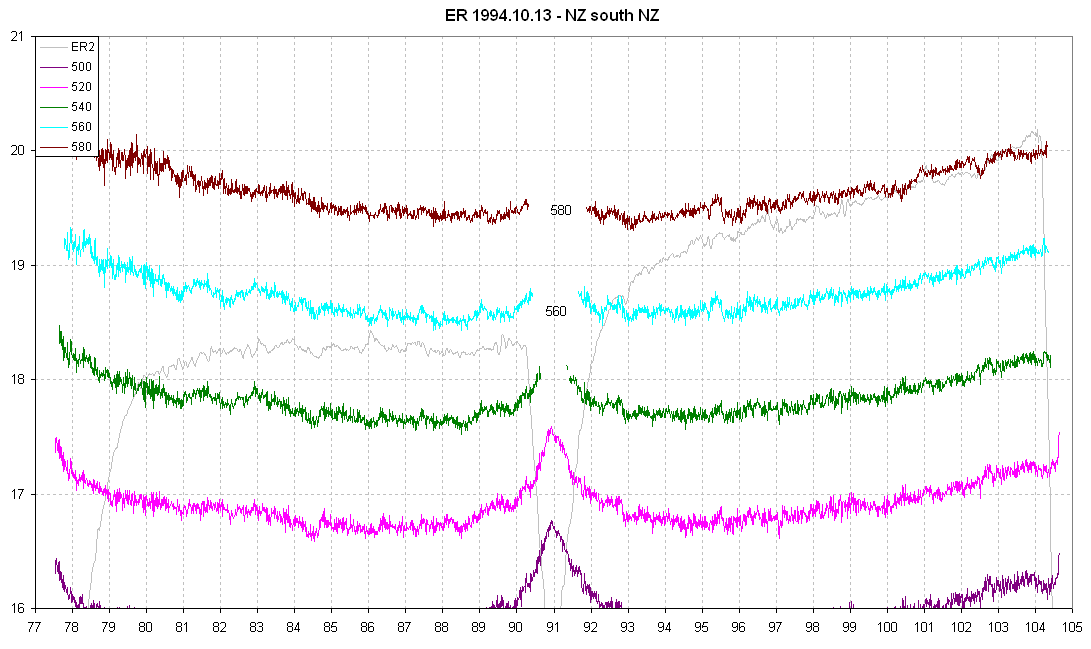
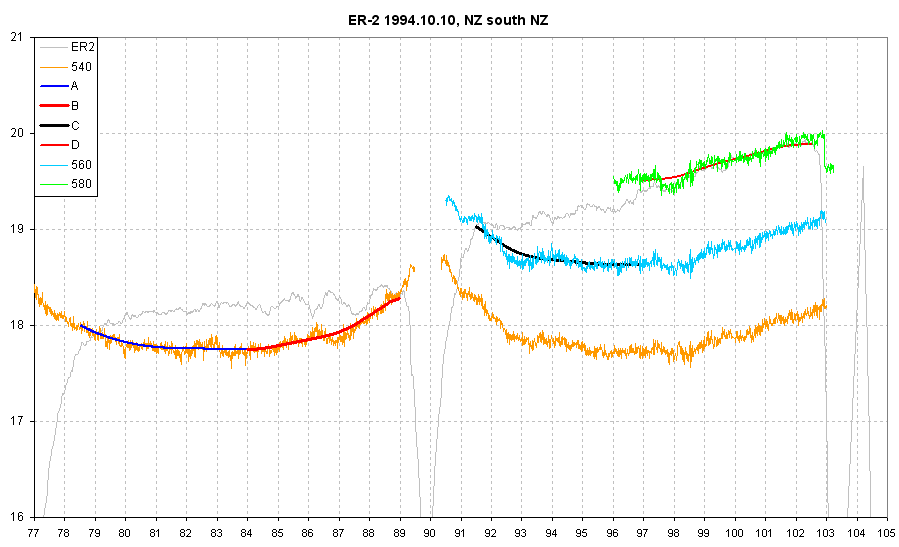
Isentrope altitude cross-section (IAC) for the ER-2 flight.
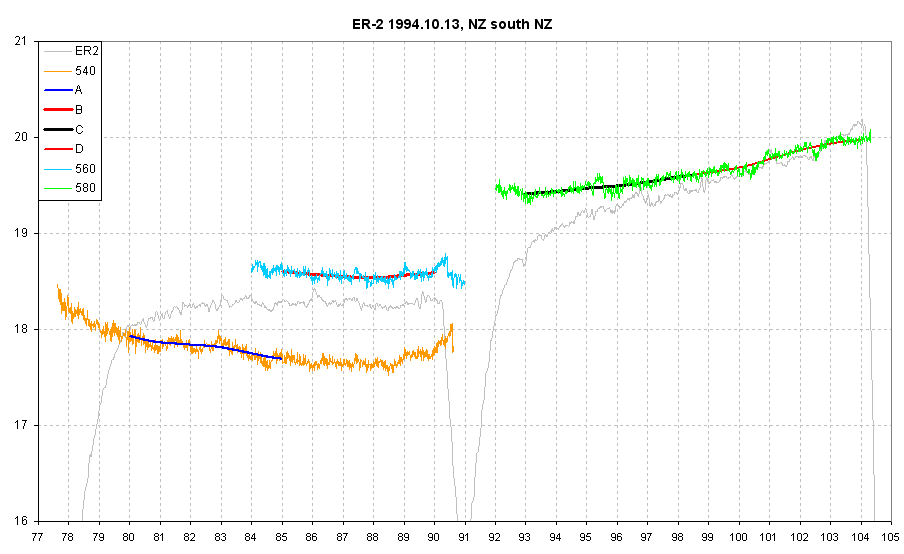
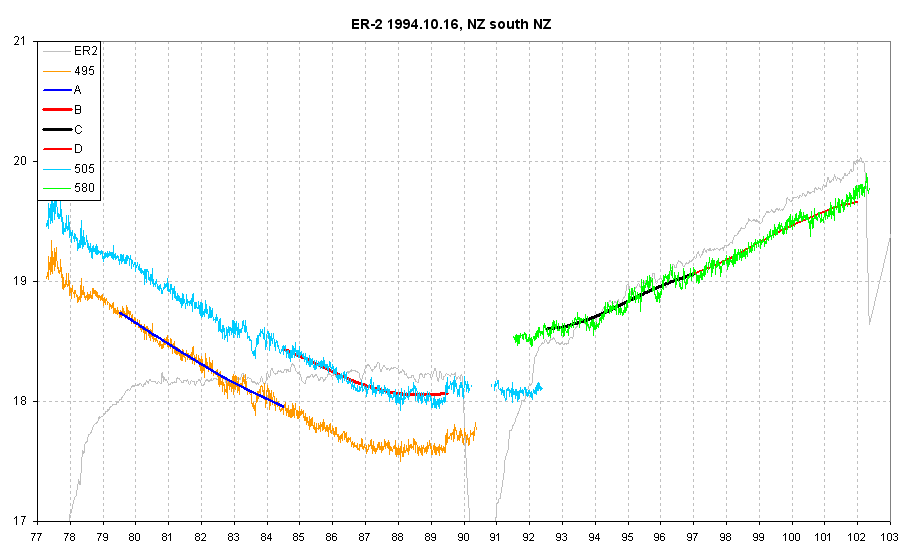
Selected isentropes showing flight segment assignments. The upper-right (green) isentrope (580 K) was chosen for the following analyses.
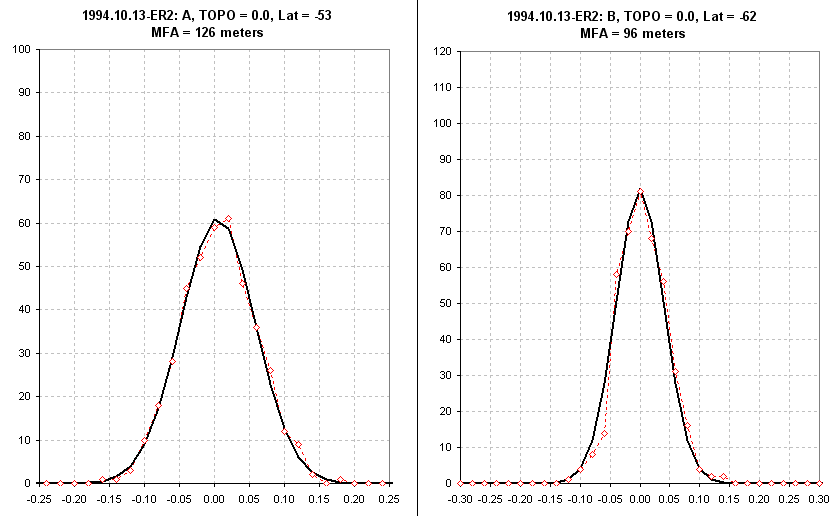
Histograms of departures of isentrope altitude form a synoptic )"smoothed") representation of the same isentrope altitude data for flight segmetns A and B.
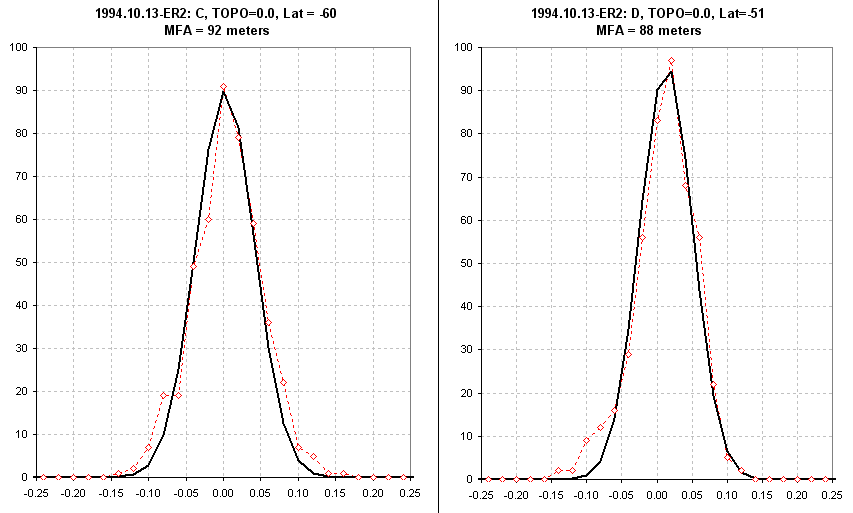
Same as above but for flight segments C and D (of the same flight).
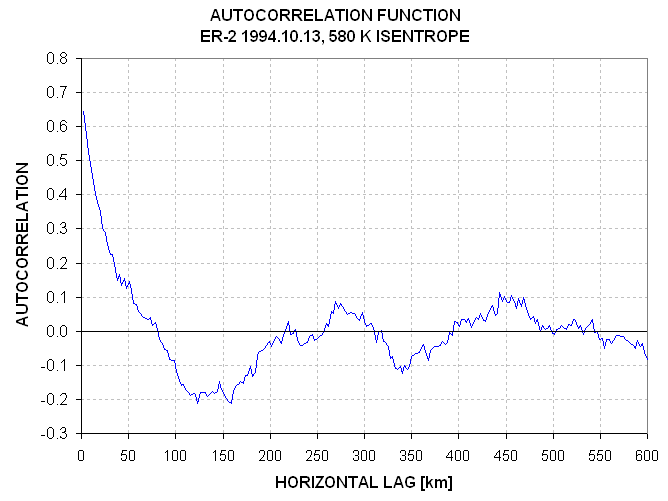
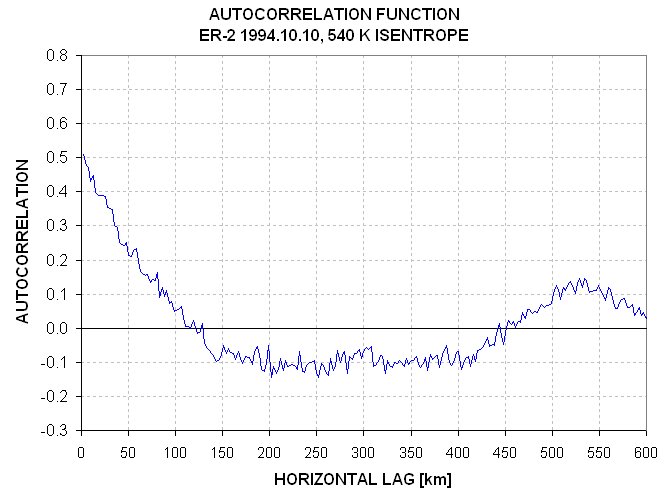
Autocorrelation function of 580 K isentrope (flight segments C and D).
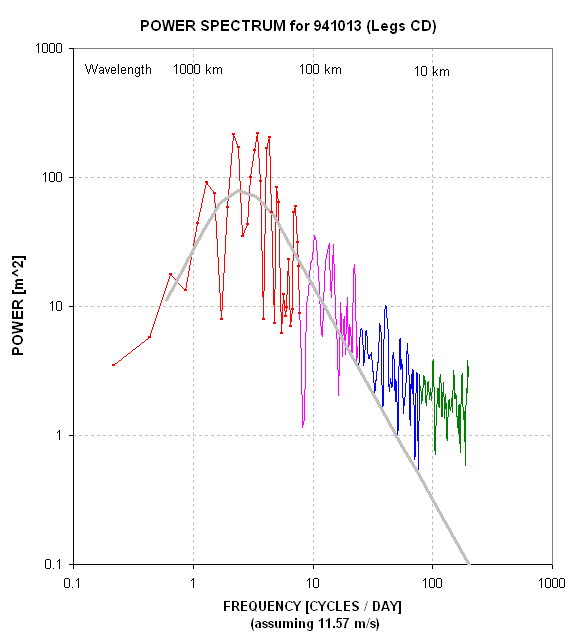
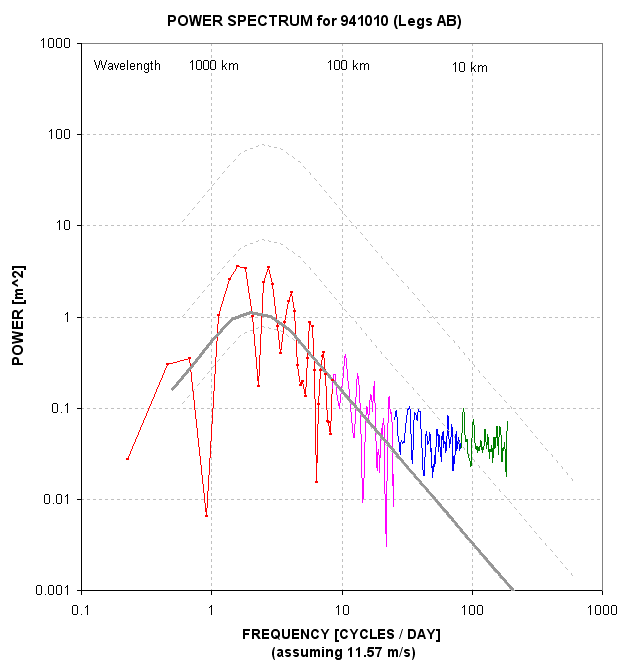
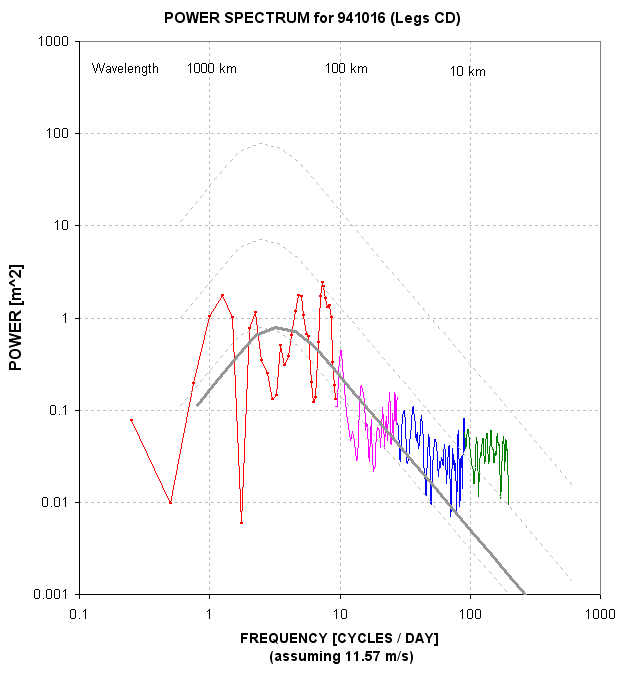
Power spectrum of 580 K isentrope (flight segments C and D).
1994.10.10 -----------------------------------------------------------------------------------------------------------------------------------------------
1994.10.16 -----------------------------------------------------------------------------------------------------------------------------------------------
It was discovered that the SH differs from the NH by having smaller amplitude wrinkles. The wrinkle amplitude varies in the same way with season, but thry are only ~27% the amplitude of those in the NH.
The SH analysis is based on 22 ER-2 flights that produced 81 straight-line flight segments without an altitude change. 75 of these flight segments were over ocean, and most were based in Christchurch, New Zealand.
The rest of this web page consists of sections devoted to a few specific flight segments. The author can provide similar data for the other flight segments. The first flight daate section has more graphs than the others in order to convey the analysis that was done for all flight segments.
1994.10.13 -----------------------------------------------------------------------------------------------------------------------------------------------
Flight track and flight segment assignments for ER-2 flight of 1994.10.13.
Isentrope altitude cross-section (IAC) for the ER-2 flight.
Selected isentropes showing flight segment assignments. The upper-right (green) isentrope (580 K) was chosen for the following analyses.
Histograms of departures of isentrope altitude form a synoptic )"smoothed") representation of the same isentrope altitude data for flight segmetns A and B.
Same as above but for flight segments C and D (of the same flight).
Autocorrelation function of 580 K isentrope (flight segments C and D).
Power spectrum of 580 K isentrope (flight segments C and D).
1994.10.10 -----------------------------------------------------------------------------------------------------------------------------------------------
1994.10.16 -----------------------------------------------------------------------------------------------------------------------------------------------
WebMaster: Bruce L. Gary. Nothing on this web page is copyrighted. This site opened: March 02, 2002 Last Update: March 02, 2008