ASTEROID STAR-SUBTRACTION AND TRACK-STACK
Bruce L. Gary, 2007.07.02
Introduction
When dealing with faint asteroids in a crowded star field it may be
worth the effort to perform a labor-intensive analysis that greatly
fades the star field while retaining the asteroid's brightness. The
procedure to be described is recommended for only those peoiple who
love image analysis. When an initial set of 30 images are used the
final image affords a limiting magnitude improvement of 1.1 magnitude
(SNR greater by 2.9). This improved SNR is modest, considering that it
is based on a 30-image initial set, but the most important improvement
is the 100-fold fading of the star field. Thus, even when an asteroid
passes close to (unsaturated) stars this objective procedure promises
to make use of the asteroid's "information" in each image. This
procedure is NOT recommended when the star field is uncrowded or when
the asteroids are bright enough to be seen in each image.
Links internal to this web page:
Star-Subtract and Asteroid Track-Strack Procedure
Sample Images
Related Links
Star-Subtract and Asteroid Track-Stack Procedure
Calibrate 30 images
Align all using stars
Median combine groups of 3; call these "small groups" and use filenames a, b, c, ... h
Avg small grps a & b, c & d, etc, creating "large groups" ab, cd, ... gh
Perform PinPoint plate solutions for a and e
Perform "star subtraction" of all small groups using appropriate large grps
a - gh = a_ss
b - gh = b_ss
c - gh = c_ss
d - gh = d_ss
e - ab = e_ss
f - ab = f_ss
g - ab = g_ss
h - ab = h_ss
Choose blank region in a_ss and note x/y location (such as 600/400). Place "white dot" there.
Calculate interval between small grps (eg, 5.6 min)
Calculate asteroid pixel velocity from ephemeris (eg, 0.53 "arc/min * 5.6 min / 1.09 "arc/px = 2.7 px/min)
Calculate "white dot" pixel location for all images (eg, x = 600, 603, 605, 608, ... 619 for a_ss, b_ss, etc)
Place "white dot" at each of these x/y locations
Median combine the first 4 small grps using the white dot for alignment, creating abcd_ssdot
Repeat median combine for last 4 small grps of images, creating efgh_ssdot
(Both abcd_ssdot & efgh_ssdot
should retain the plate solutions associated with "a" and "e")
Try blinking these two images and try to see the asteroid from its motion.
(Each image has SNR twice as
great as one of the 30 initial images, and the stars should be greatly
faded)
If you can't see the asteroid, average the last two
images created using the white dot for alignment, creating a-h_ssdot
(This image should retian the plate solution information associated with image "a" above)
Calculate the predicted location for image "a" and
search a-h_ssdot at that location for the asteroid. If you see it there
you can measure its coordinates
and magnitude. Note that this image has SNR ~3 times greater than fora
single
image from the initial 30 images. Also, the stars should be greatly faded.
Sample Images
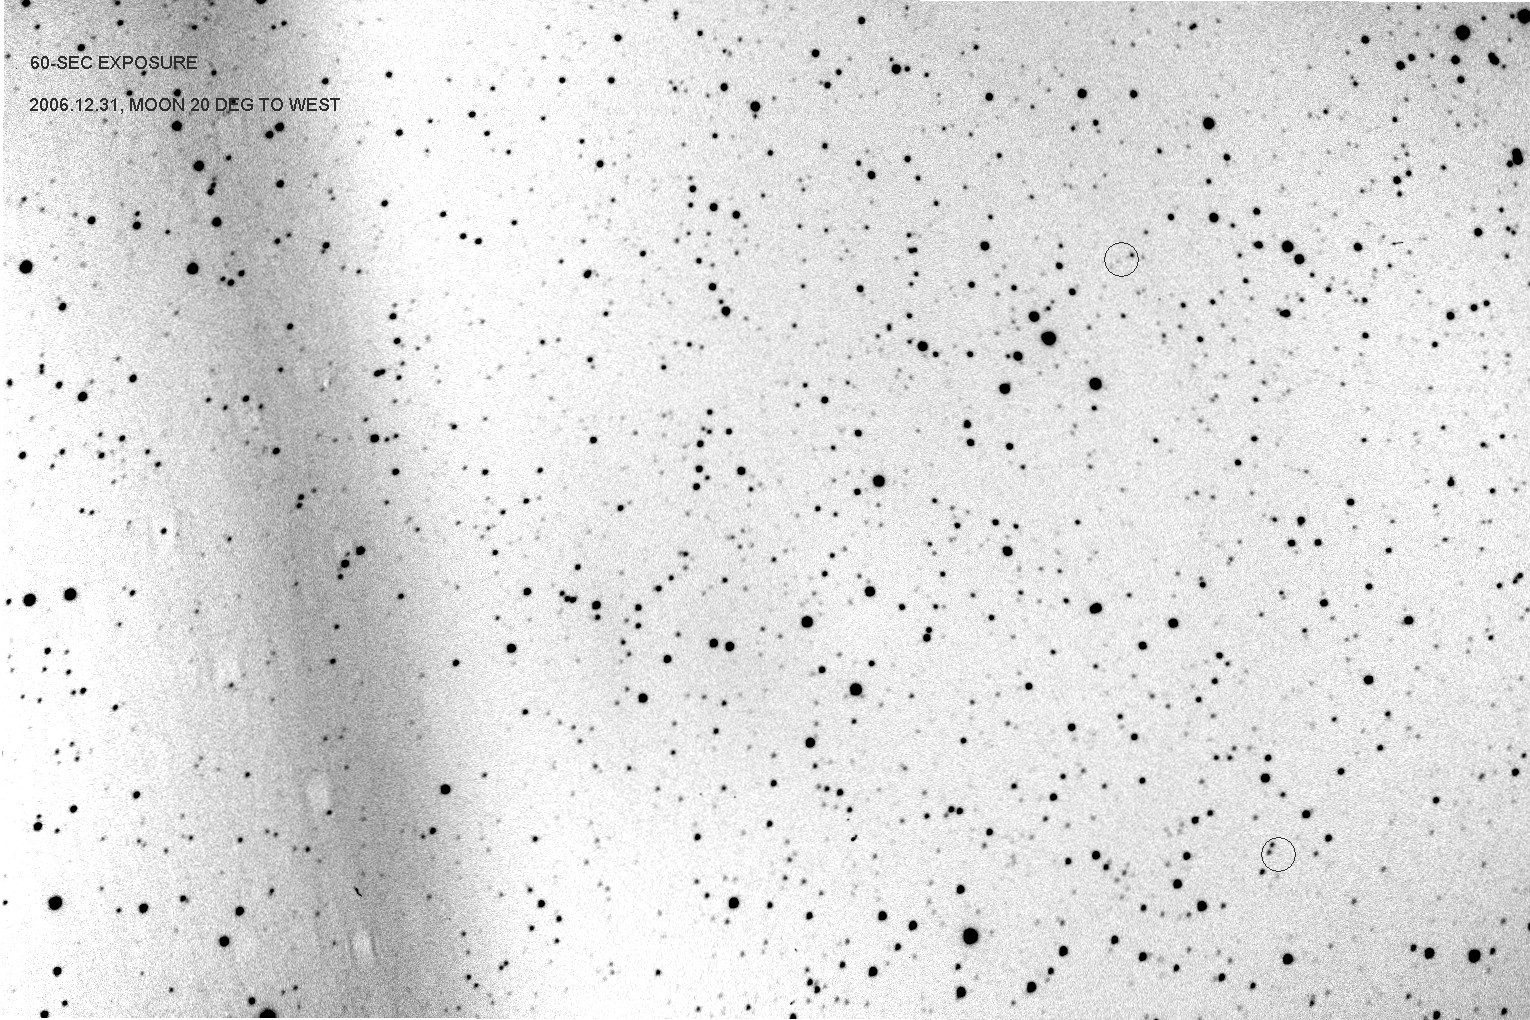
Figure 1. One of the initial images after dark frame
and flat frame calibration. The moon was only 20 degrees away which
accounts for the bright band on the left. FHWM ~3.5 "arc. Limiting
magnitude ~18.5 (which is ~0.7 mag worse than normal because of the
full moon's proximity). Two circles (right side) show the
locations of asteroids based on an ephemeris. Since the asteroid
magnitudes are 18.9 and 20.0, which is fainter than this image's
limiting magnitude, all features within the circles are stars.
[Meade LX200GPS, SBIG ST-8XE, blue-blocking filter, 60-second exposure,
tip-tilt image stabilized using an SBIG AO-7; 2007.12.31 UT; Hereford
Arizona Observatory]
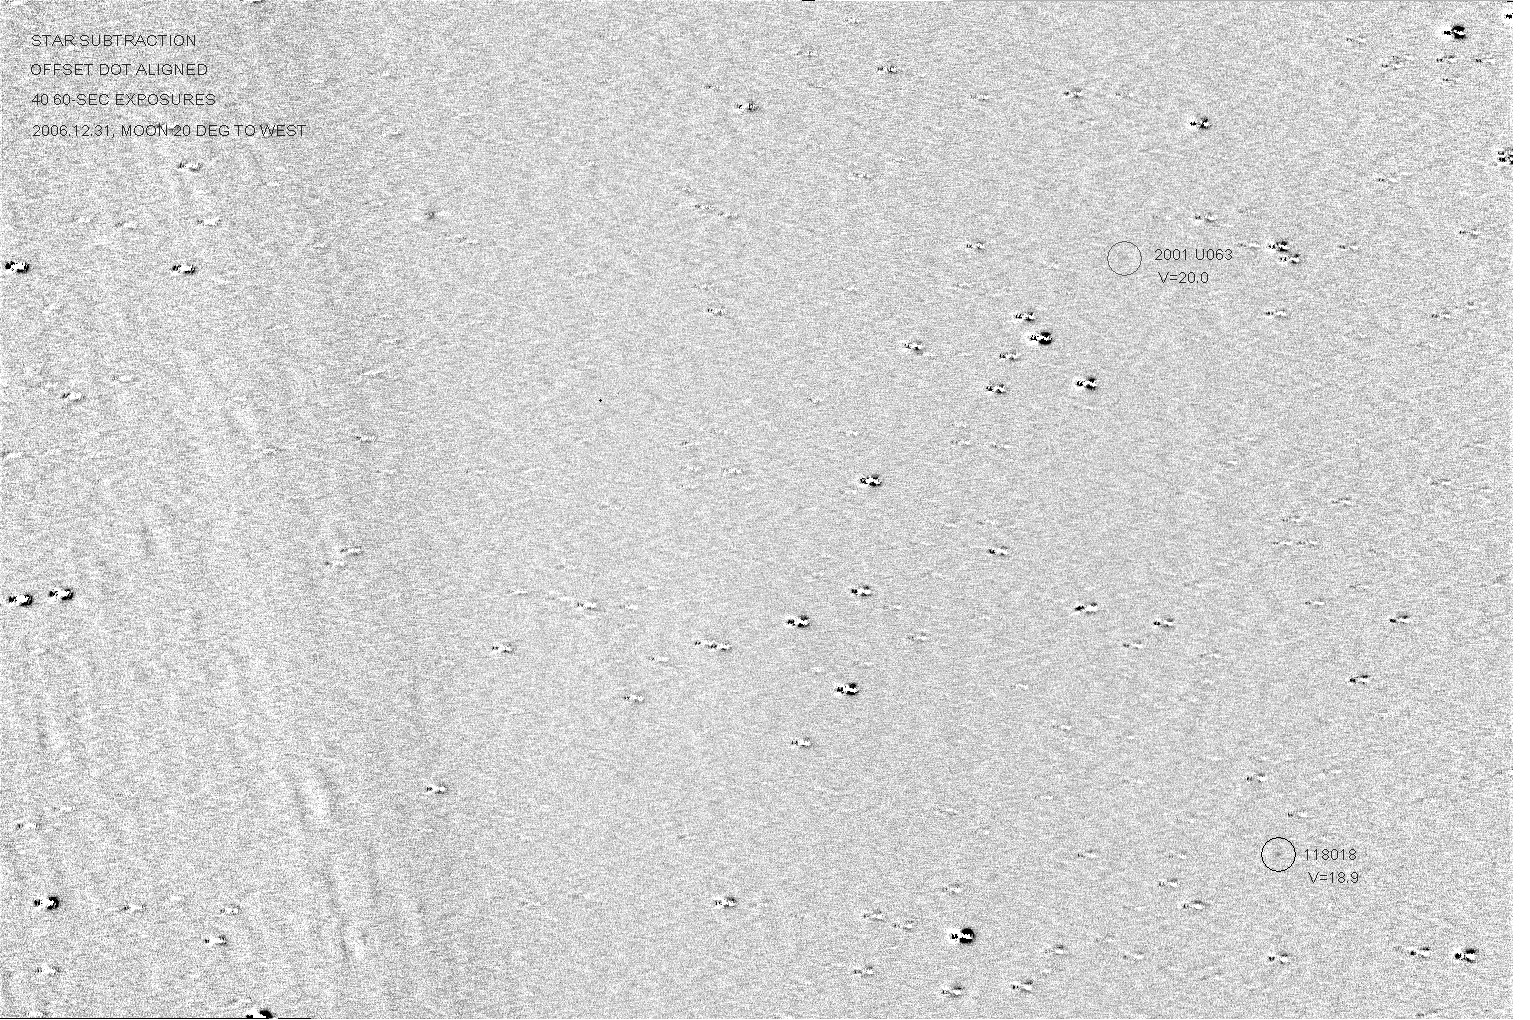
Figure 2. Final image after star-subtraction and asteroid track and stack using an initial image set of 40 1-minute exposures.
Related Links
<> Minor Planet Bulletin article "Image Subtraction Procedure for Observing Faint Asteroids"
Improved procedure for getting 3 RA/Dec coordinates from 12 images
Tutorial on Asteroid Alignment Dot Stacking
AstroPhotos - my astronomy home page
____________________________________________________________________
This site opened: January 2,
2007. Last Update: January 17,
2007