A filament of air shorn from a polar vortex exhibits a temperature field anomaly in addition to tracer anomalies. Evidence is presented that the temperature anomaly has a vertical thickness that is greater than the tracer anomaly thickness. Two examples from ER-2 flights are used to illustrate this unexpected structure. In the best documented case the temperature anomaly thickness was found to be twice the tracer thickness.
Links internal to this web page:
Filament Behavior and Potential Vorticity
Flight of 1994.05.23
Flight of 1995.05.08
Flight of 1996.12.06
Conclusions
Filament Behavior and Potential Vorticity
Introduction
The Microwave Temperature Profiler mounted in a NASA ER-2 atmopsheric research
aircraft, the MTP/ER2, has measured altitude temperature profile distortions
associated with molecular tracer filaments on several occasions. In every
case the pattern of temperature distortion compared with non-filament air
obeys the rule: "warmer above, colder below." In two cases it was possible
to compare the altitude thickness of the layer having distorted temperature
with the thickness of the layer having anomalous tracer values. In each case
the distorted temperature layer was thicker than the tracer layer.
The tracer/tracer signatures for these filaments can be explained by assuming
the filament air is moving toward the equator from a point of origin that
is likely the polar vortex edge. Conservation of potential vorticity requires
that a layer of air will undergo vertical compression as it moves toward
the equator. This vertical compression should produce an adiabatic heating
at the top of the layer and an adiabatic cooling at the bottom, assuming
that the average temperature of the layer determines its buoyancy in relation
to the air mass that it penetrates. This argument can explain the "warm above/cold
below" temperature structure associated with filaments. However, the greater
thickness of the temperature distortion in relation to the thickness of
the tracer anomaly requires that some additional physical process must be
invoked that accompanies the filament's equatorward journey. I will suggest
that friction between the original filament's upper and lower surfaces entrain
ambient air and cause it to share in the temperature distortion as potential
vorticity is conserved.
The goal of this web page is to report observations that make the case
that filaments have different thicknesses using the temperature field distortion
and tracer measures. I hope someone with a theoretical
background in atmospheric physics will be challenged to give an account
of the observations.
Filament Basics
Consider the northern hemisphere winter situation. Air over the polar region
receives no sunlight for long periods of time except for an occasional latitude
excursions beyond the arctic circle. Polar air parcels cool due to thermal
radiation to space that is greater than their absorption of terrestrial surface
thermal radiation. As the air cools, it contracts and descends. This diabatic
descent is accompanied by adiabatic heating, but the net effect is for polar
air to be cooler over time, and to be cooler than air at the same altitude
outside the vortex. By late winter the air at 20 km has descended several
kilometers, and near the bottom of the vortex the air has descended by a
slightly smaller amount.
Since ozone and N2O concentrations do not change significantly
over time scales of a few months vortex air has relatively high ozone concentrations
and low N2O concentrations compared to air at the same altitude
outside the vortex. Thus, level flight through the vortex edge into the vortex
is accompanied by a rise in ozone and a fall in N2O concentrations.
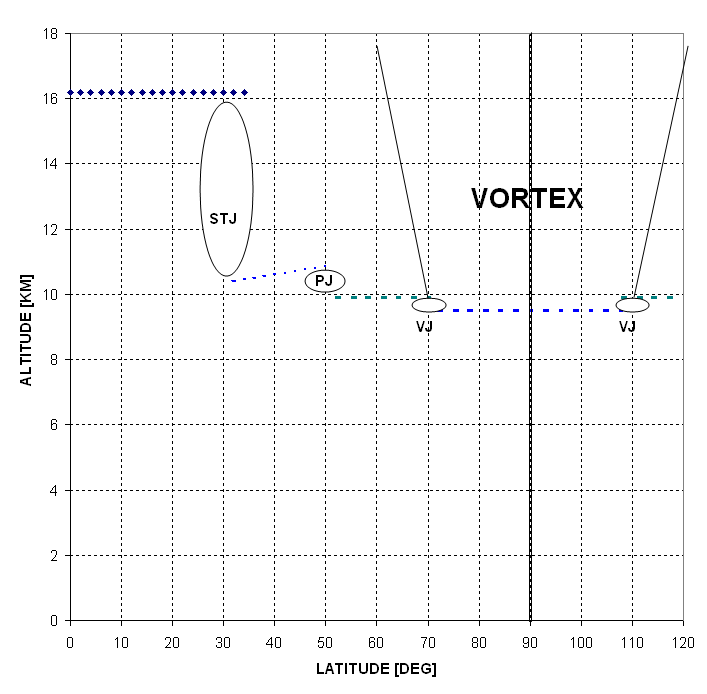
As depicted in the next figure the vortex has a larger latitude extent
at higher altitudes. The vortex edge is tilted by a greater angle than appears
in the figure, as can be imagined by expanding the horizontal scale by the
factor 700 (needed to achieve the same scale vertically as horizontally).
Figure 1. Latitude cross-section
of typical winter hemisphere showing location of vortex. Tropopause and jets
are also indicated, using symbols STJ for sub-tropical jet, PJ for polar jet
and VJ for vortex jet.
A wind maximum occurs near the vortex
edge, and is associated with the large latitude gradient of potential vorticity
that acts as a barrier to air parcel movement across the vortex edge. Imagine
a mid-latitude air stream with latitude excursions (planetary waves). At its
northern most excursion it will increase the horizontal wind gradient, and
with sufficient force it could "tear off" a chunk of vortex air and entrain
it in to mid-latitude air. This is depicted in the next figure.
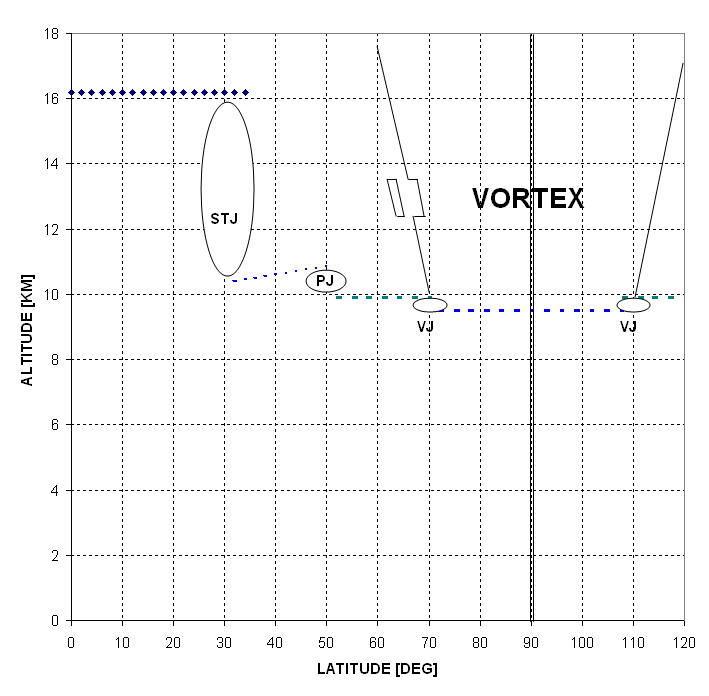
Figure 2. Depiction of tearing off of chunk of vortex air by
mid-latitude winds.
The altitude extent of this air might be 1 km, but the horizontal extent
could be many kilometers. The air chunk appears to be vertically larger than
its horizontal extent in the figure, but this appearance is due to the 700-fold
difference in vertical and horizontal scales.
If the chunk of vortex air moves toward the equator it has many opportunities
to be streatched horizontally because winds at neighboring altitudes are rarely
the same. Horizontal gradients also exist, and will add to the horizontal
spreading of the original vortex air parcel. Whereas there are two important
contributors to a horizontal spreading, there are essentially none that cause
the air vertical dimention to change. Thus, as time passes the vortex air
will become flatter in shape. The closer to the equator an air parcel is
found, the longer it is likely to have travelled, and the flatter in shape
it is likely to be. This is depicted in the next figure.
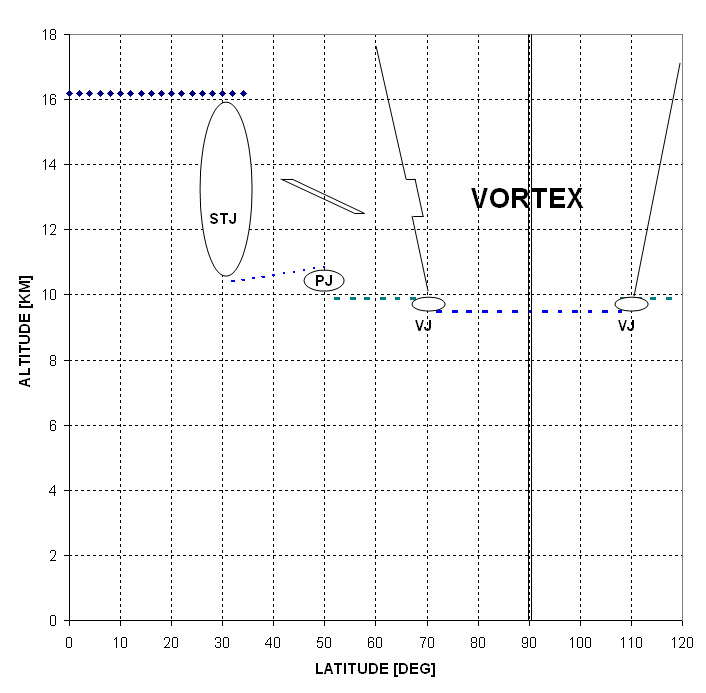
Figure 3. The farther the filament travels toward the equator
the more it resembles a "tilted pancake."
In this figure the tilt of the vortex air is so large that it may be considered
to be a very large "pancake" that is essentially horizontal. The longer a
filament is embedded in mid-latitude air, and the greater the horizontal gradients
of wind at these mid-latitudes, the more likely it is for the filament to
break up into isolated pieces. Thus, the depiction of the filament in the
above figure could just as well be represented as a series of smaller filamentary
strands. Of course, the longer and more turbulent the air, the greater is
the mixing of vortex air with mid-latitude air at the vortex air boundaries.
Filament Spin Up Due to PV Conservation
There's one more factor that can produce a horizontal expansion of the
filament. But of greater significance for this article this factor also is
predicted to produce a vertical compression. It's the vertical
compression of the air parcel that is detectable by the MTP instrument because
the vertical compression creates a "warm above/cold below" temperature distortion
of the filament.
If an air parcel moves toward the equator it is traveling to lower latitdues,
and even if it is not subjected to wind field forces that distort its shape
the fact that the air parcel must retain its potenttial vorticity causes
it to become flatter and more spread out in order to preserve potential vorticity,
PV. The governing equation is:
PV = (-dTheta/dP) * ((dV/dx - dU/dy) + 2 * Omega *
sin Ø)
where PV = potential vorticity,
Theta = potential temperature = T [K]
* (1000 mb * P[mb] ) 0.286
P = pressure [mb],
V = eastward component of horizontal
wind,
U = northward component of horrizontal
wind,
Omega = earth's rotation rate [radians/second],
Ø = latitude,
x = east-pointing coordinate,
y = north pointing coordinate.
The term dTheta/dP is referred to as
"static stability," the term dV/dx - dU/dy is referred to as "relative
vorticity" and the term 2 * Omega * sin Ø is referred
to as the "coriolis parameter."
PV is a conserved property of an air parcel that does not
undergo irreversible interactions with its surroundings and does not gain
or lose energy through its parcel boundaries. For time scales that characterize
an air parcel's movement from the vortex edge to mid-latitudes it can be
said that the parcel's PV must be conserved unless it undergoes significant
mixing with the surrounding air.
Consider an air parcel that moves toward the equator, which
experiences a decreasing "coriolis parameter".
There are two ways to conserve PV during this latitude change:
1) Increase "relative vorticity" or
2) Increase "static stability."
It is not clear from the theory how this partitioning should
occur. This is a job for the observationalist, and this article presents
evidence that at least the "static stability" component changes as an air
parcel moves equatorward. To illustrate this situation let's shift our imagination
to the southern hemisphere, in aniticipation of a key MTP observation, and
consider that a chunk of the Antarctic vortex is torn off by mid-latitude
winds that "bang into" the vortex edge during a planetary wave meander.
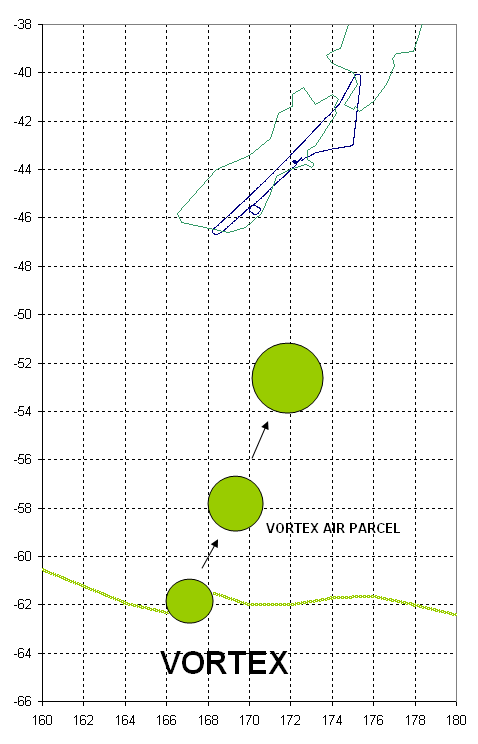
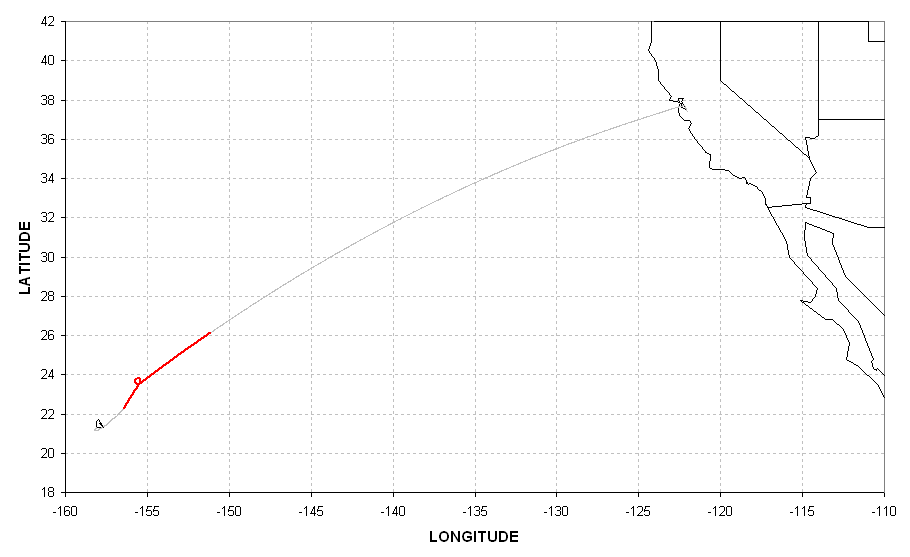
Figure 4. Depiction of a disk of vortex air being
dislodged from Antarctic vortex and moving equatorward. The disk-shaped air
parcel is shown at three hypothetical times during its motion toward New
Zealand. Flight track for ER-2 flight 1994.05.23 is shown (blue trace).
In the above figure the disk-shaped air parcel is shown as
expanding horizontally with time. As it undergoes this horizontal expansion
it also undergoes a vertical compression, as shown in the next figure.
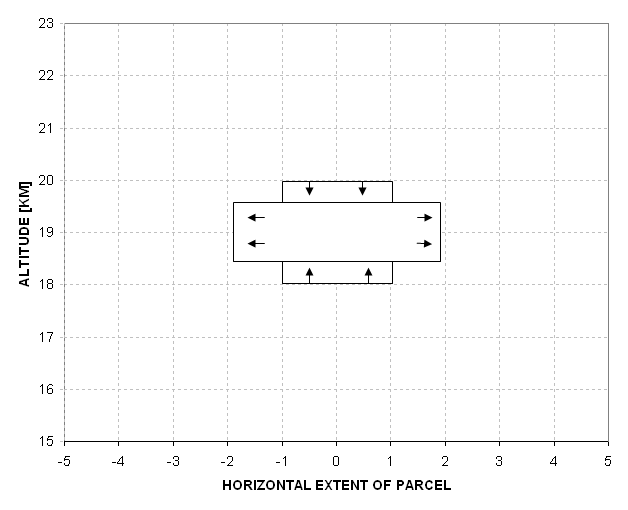
Figure 5. Depiction of how an air parcel vertically
compresses as it expands horizontally during equatorward movement.
In this figure showing simultaneous horizontal expansion and
vertical compression (preserving air parcel volume) it can be imagined that
the horizontal expansion is associated with a "spin-up" caused by an increase
in "relative vorticity." The vertical compression will increase static stability
since isentrope surfaces will be brought closer together as vertical compression
proceeds. This scenario therefore depicts a situation inwhich both "relative
vorticity" and "static stability" increase to counter the loss of the "coriolis
parameter" value, thus preserving PV.
It would be observationally difficult to detect a horizontal
expansion, or even the wind speed changes associated with the spin-up, but
it is easy for an MTP to detect the increase in static stability associated
with vertical compression. The following figure shows two concepts for what
might happen to the temperature field in the vicinity of the vertically compressing
disk-shaped vortex filament.
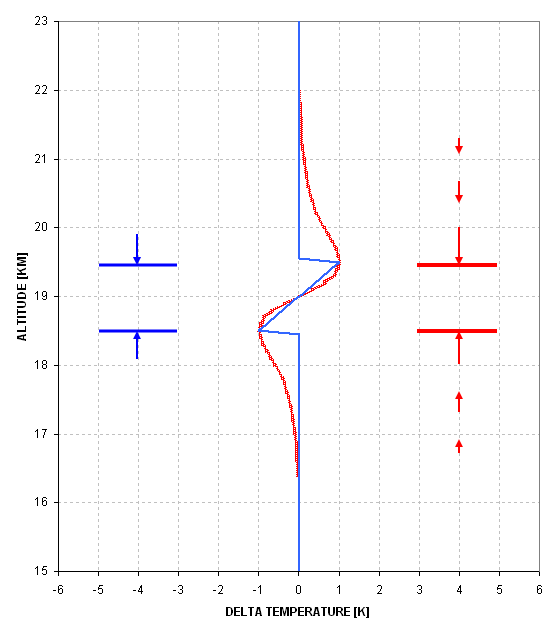
Figure 6. Two concepts for how the temperature
field could be distorted by the filament's vertical compression. The blue
trace is for no effect on the ambient air whereas the red trace assumes that
nearby ambient air above and below the filament partakes in some of the filament's
vertical compression.
Recall our implicit assumption that the vortex chunk of air
will move toward the equator after it is torn off the main vortex. If it
were simply entrained in the mid-latitude air adjoining the vortex edge then
it would only move equatorward as far as the meandering mid-latitude air
during its planetary wave motion, and in this case the air surrounding the
filament would undergo the same PV-conserving vertical compression and horizontal
expansion as the filament. But, if the chunk of vortex air that is destined
to become a mid-latitude filament moves through the mid-latitude air
mass once it has separated from the main vortex, and if this motion is toward
the equator, then the filament will undergo a PV-conserving vertical compression
that the ambient air it moves through does not experience. What could cause
the latter case to exist? Recall that the air in the vortex has a higher
PV than the air at mid-latitudes. PV is proportional to the product of horizontal
vorticity and vertical static stability. Since the static stability within
the vortex is lower than outside, there must be an excess of vorticity for
air within the vortex. It is this anomalously high vorticity of chunks of
vortex air that are torn from the main vortex that must cause the vortex
air to migrate equatorward (help, dynamicist!). Filaments of vortex air at
low mid-latitudes are an observational fact. The only matter in question
is whether the vortex air moves equatorward by a process of moving through
mid-latitude air or a process of being entrained by mid-latitude air that
is on its way toward the equator. Later I will claim that observed temperature
field distortions in relation to tracer-derived filament thickness can be
used to answer this question.
It is not necessary to resolve the question raised in the previous paragraph to realize that encounters with filaments should be associated with changes in air temperature. Specifically, the vertical gradient of temperature should increase during flight within a filament. This is a prediction based on basic atmospheric physics. The ER-2 has flown many missions in the vicinity of a winter polar vortex, and these missions included instruments that measure the tracers necessary to distinguish vortex air from mid-latitude air. Furthermore, these missions also included the Microwave Temperature Profiler instrument, which allows for the detection of changes in vertical temperature gradient. The remainder of this article is devoted to descriptions of tracer and temperature field observations during three vortex filament encounters.
MTP Instrument
The Microwave Temperature Profiler, or MTP, is a passive microwave radiometer
than scans through a range of elevation angles every few seconds and records
brightness temperature versus elevation angle. Since brightness temperature
at the two MTP operating frequencies are dominated by oxygen molecule thermal
emission, the measurement of brigthness temperature versus elevation angle
can be converted to plots of air physical temperature versus altitude with
respect to the aircraft. The two (local oscillator) operating frequencies
are 56.66 and 58.80 GHz, and for a typical flight altitude of 20 km the oxygen
absoprtion at these two frequencies is 0.42 and 0.90 Nepers per km (average
of IF band passes). Hence, the measured brightness temperature comes
from ranges of ~2.4 and 1.1 km (assuming certain things).
A statistical retrieval procedure is used to extract temperaature versus
altitude information from the set of MTP measured observations of brightness
temperature versus elevation angle. For flight at 20 km the accuracy of retrieved
profiles is <1.0 K from 19 to 21.5 km, <2.0 K from 17.2 to 24.2 km
and <3.0 K from 16 to 26 km. The altitude resolution is ~150 meters (full-width
half-max) near flight level, and degrades to ~600 meters at altitudes that
are 1.0 km above or below the aircraft. T(z) profiles are obtained every
20 seconds.
A filament was encountered by the ER-2 during a altitude excursions prior to landing in Hawaii on 1996.12.06. Temperature, ozone, N2O are used to characterize the vertical structure of the filament. The ozone/N2O mixing ratio is used to derive an altitude profile of the filament's percentage of ambient versus original air. It is speculated that this filament originated in the Arctic polar vortex. A temperature anomaly is associated with the filament that is consistent with equatorward movement while preserving potential vorticity. This association of tracer and temperature features is similar to several filament encounters on other ER-2 flights.
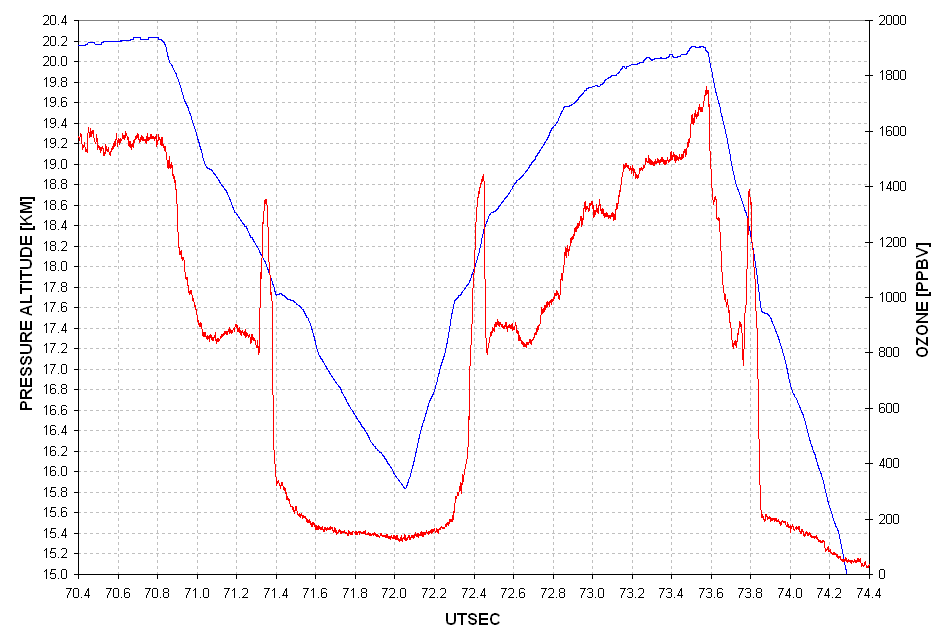
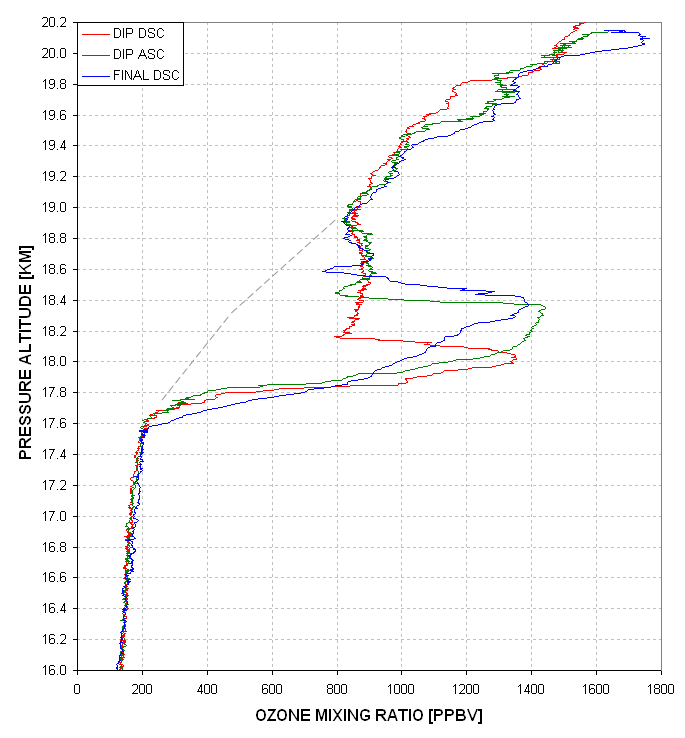
It may be interesting to compare the temperature field in relation to the filament location. This is shown in the next figure.
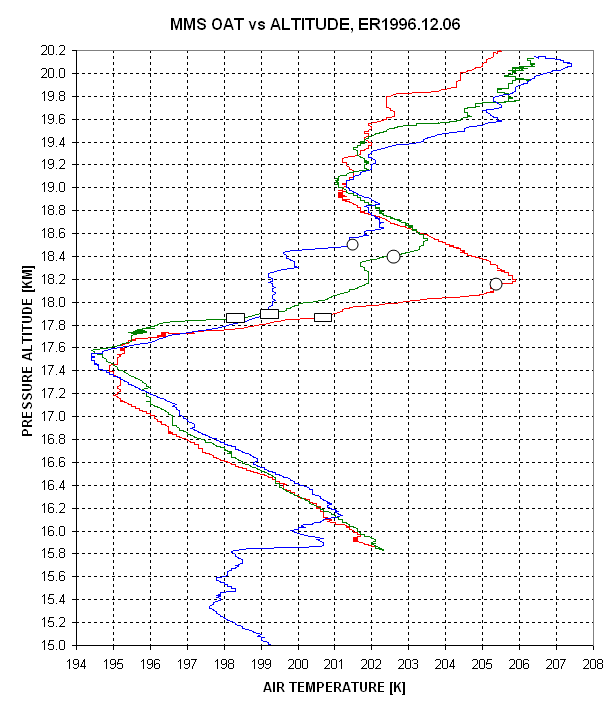
Figure 13. Temperature signature of the filament for
three altitude excursions. Circular and rectangular symbols mark the
high and low altitudes of the anomalously high ozone region.
This plot of temperature profiles shows that the filament, as
defined by molecular tracers, is thinner than the layer of air with
anomalously high temperature. One interpretation is that the filament
"dragged" air along as it moved equatorward, and as this expanded layer
moved in latitude it preserved potential vorticity (PV). Preserving PV
during an equatorward movement produces "filament spin-up" that
consists of a vertical compression accompanied by a horizontal
expansion (described in the next section). The vertical compression
causes an adiabatic heating at the upper boundary of the moving layer
of air, and at the lower booundary there may be an adiabatic cooling.
(This pattern has been observed by the MTP on several occasions while
flying between a polar vortex and the tropics.) The above figure does
indeed show an exces of warmth at the top of the filament and a
suggestion of coolling near the bottom. The next section describes
"filament spin-up."
For each of the three filament encounter flights the same
temperature pattern was found to exist: the top of the filament was
warmer than neighboring altitudes and the lower part of the filemnt was
cooler. This is consistent with a prediction based on the filament
preserving potential vorticity as it moves equatorward.
Acknowledgements
References
____________________________________________________________________
This site opened: April 9, 2004. Last Update: June 29,
2006