DOUBLE TROPOPAUSE FEATURES IN A LATITUDE/ALTIUDE CROSS-SECTION
Bruce L. Gary, M. J. Mahoney
Jet Propulsion Laboratory, Pasadena, CA
Edward V. Browell
Langley Research Center, Hampton, VA
1999 June 25, updated 2003 October 23
Abstract
The concept of a "tropopause" becomes ambigous near jet structures. Using the WMO definition for a tropopause, which is based exclusively on temperature profiles, it is known that there are two tropopauses in the vicinity of the sub-tropical jet. This is dramatically illustrated using T(z) profiles obtained by the remote sensing Microwave Temperature Profiler, MTP. We present measurements of a double tropopause above and poleward of the subtropical jet, extending 2 to 4 degrees of latitude. Isopleths of ozone and potential vorticity show a smooth transition with latitude throughout the double tropopause feature, which implies that the upper of the two tropopauses is merely a diluted remnant of poleward moving air with an origin in the subtropical upper-troposphere. Above the subpolar jet the tracer and temperature-based tropopauses separate, with the temperature-based one being as much as 1 km above the tracer tropopause. MTP cross-section data afford a new tool for studying mesoscale dynamical features with a resolution not possible using either radiosondes or satellites, and this study illustrates the value of combining high-resolution remote sensing data with airborne in situ tracer data.1. Introduction_____________________________________________
The Microwave Temperature Profiler, MTP, is a Jet Propulsion Laboratory remote sensing instrument mounted aboard the NASA DC-8 atmospheric research aircraft. MTP measures profiles of air temperature versus altitude for an altitude region that extends from approximately 4 km to 22 km. Measurements are made every 17 seconds, allowing for the creation of "altitude versus flight track" cross-sections of the temperature field. Since the altitude resolution of the MTP is approximately 0.13 km (for altitudes near flight level), and since the horizontal resolution is approximately 4 km, the MTP produces temperature field cross-sections having a resolution far superior to satellites, being an order-of-magnitude better in both the vertical and horizontal directions. MTP is therefore able to perform investigations of mesoscale phenomena that cannot be conducted using satellite data. Although radiosondes afford excellent altitude resolution, they are typically spaced 350 km apart (over land), so radiosonde data cannot be used to study certain mesoscale phenomena. The MTP is probably the only instrument capable of measuring the temperature field with sufficient vertical and horizontal resolution to permit mesoscale measurements of the atmopsheric phenomena treated by this report.
The data upon which this report is based came from one flight that was part of the NASA-sponsored project called TOTE/VOTE (Tropical Ozone Transport Experiment and Vortex Ozone Transport Experiment). MTP instruments have flown aboard many aircraft (CV-990, C-141, ER-2, DC-8, WB-57F), and a fuller description of their operating principle, performance and measurement results can be found at the following internet web site: MTP Home Page The rest of this report describes a variety of observations associated with a double-tropopause encounter which we believe is representative of sub-tropical jet crossings in general.
2. Properties of DC-8 Flight 1995.12.11
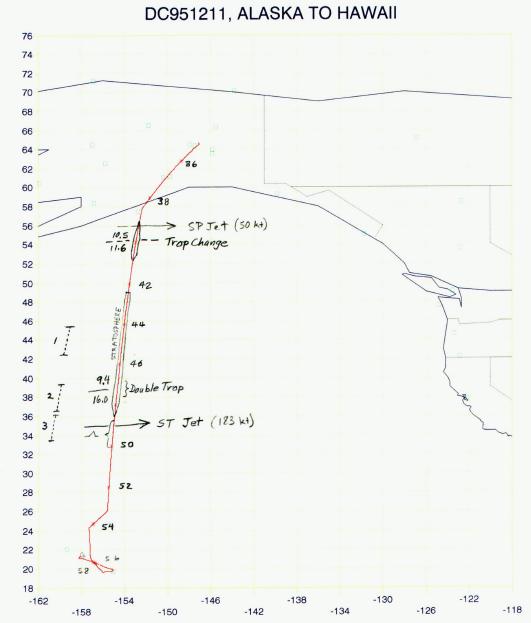
Figure 1. Flight track for the DC-8 flight of 1995 December 12, from Alaska to Hawaii.
Figure 1 is the DC-8's 1995 December 12 flight from Fairbanks, Alaska to Barber's Point, Hawaii. In situ wind maxima occurred at 56 N (where N = degrees north latitude), exhibiting a broad peak of 50 knots, and at 35 N, reaching a sharp peak of 183 knots. As described below, the tropopause changed altitude abruptly at 54.6 N, and there was a double tropopause from 40.0 to 37.9 N. Tracers were "stratospheric" from 56 to 52.4 N, and from 49.0 to 36.0 N (using the NOy instrument's ozone and the DACOM instrument's methane and CO2, cf. Fig's 15-16). Moderate turbulence was encountered from 35 to 33 N.
3. Temperature Profiles For the Flight
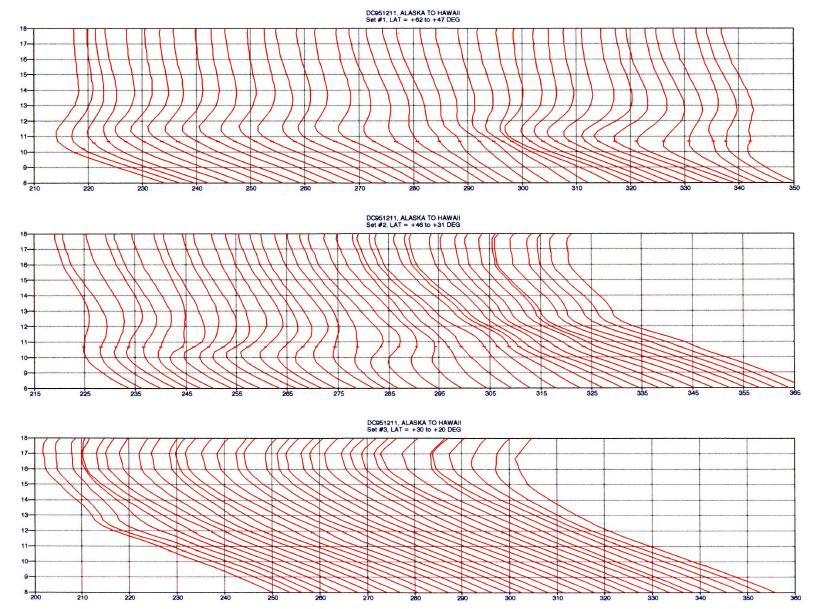
Figure 2. T(z) profiles for flight from Alaska to Hawaii.
The MTP produces T(z) profiles every 17 seconds, and 3-minute averages are presented in Fig. 2. The "tic" on each profile corresponds to aircraft altitude. Each profile is offset 3 K from its neighbor. The sub-polar jet crossing is associated with a tropopause altitude jump in the top panel's profile having a tic at 285 K; the sub-tropical jet encounter is associated with a double tropopause corresponding to profiles in the middle panel with tics located at 279 to 297 K. This T(z) display is one method of presenting MTP data, but other visualization methods are superior, and are presented below.
4. Isentrope Distortions Associated with Wind Jet Streams
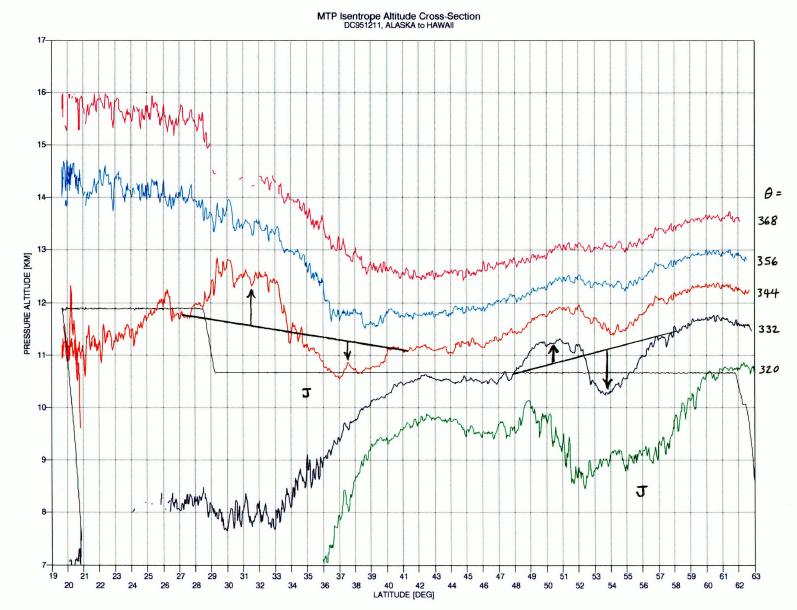
Figure 3. Isentrope altitude cross-section, showing the altitude of 5 isentrope surfaces and their vertical displacements at jet locations.
Every T(z) profile can be converted to a profile of potential temperature, theta(z). This is possible because theta is a simple function of temperature and barometric pressure, and the T(z) that is retrieved from MTP data is actually air temperature versus pressure altitude (and pressure altitude is easily converted to barometric pressure). Figure 3 is based on the individual T(z) profiles (with 1-minute averaging), and shows the altitude of 5 theta surfaces (labeled in the right margin). The DC-8's altitude is shown by a thin black trace. The wind field has been analyzed (described below) and two jet stream wind maximum features are plotted on the graph with "J" symbols. The DC-8 passes about 2 km above the sub-polar jet, at 56 N, and passes a mere 0.3 km above the sub-tropical jet, at 35 N.
The 332 K theta surface, or isentrope, is distorted south of the sub-polar jet, and a straight line segment has been drawn to indicate where its undistorted position might have been. This isentrope is displaced downward 800 meters on the north side of the center of the distortion feature, while it is displaced upward 450 meters on the south side. The 344 K isentrope surface is used to indicate the altitude distortion produced by the sub-tropical jet. The north side is displaced downward 600 meters and the south side is displaced upward 1000 meters. Also notice how the isentrope surfaces for theta < 332 K separate from each other at latitudes south of the sub-tropical jet.
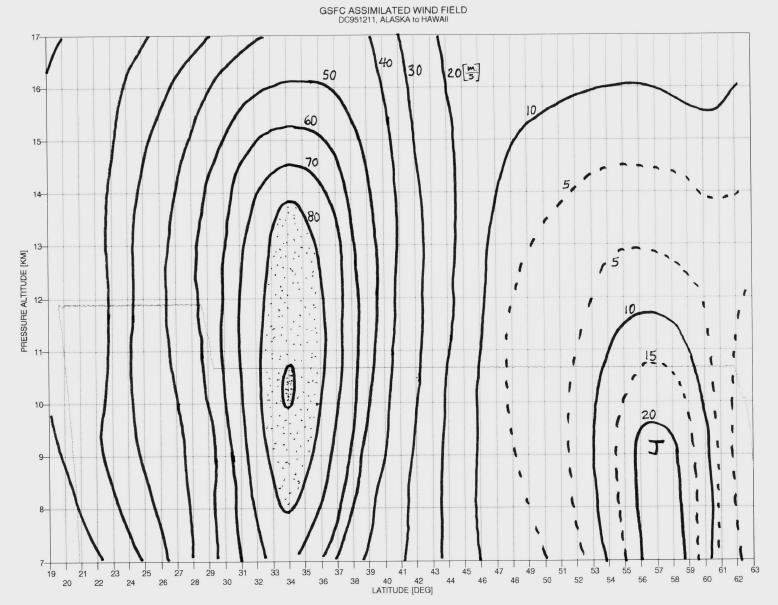
Figure 4. Isotach contours from the GSFC assimilated wind field.
The GSFC assimilated wind field interpolated in space and time for this flight's cross-section is presented in Fig. 4. The sub-polar jet is weak, in agreement with the in situ winds, but the assimilated wind max is offset 1 degree of latitude north of the in situ wind max location. We have adopted the in situ wind max location of 56 degrees for placing the "J" symbol in the remaining figures. The assimilated sub-tropical wind max is offset 1 degree of latitude south of the in situ wind max, and we have again preferred the in situ wind max location for placing "J" symbols. The assimilated and in situ measured wind values at the jet locations are in close agreement (179 versus 183 knots for the sub-tropical jet).
5. In Situ Tracer Identification of Stratospheric Flight Segments
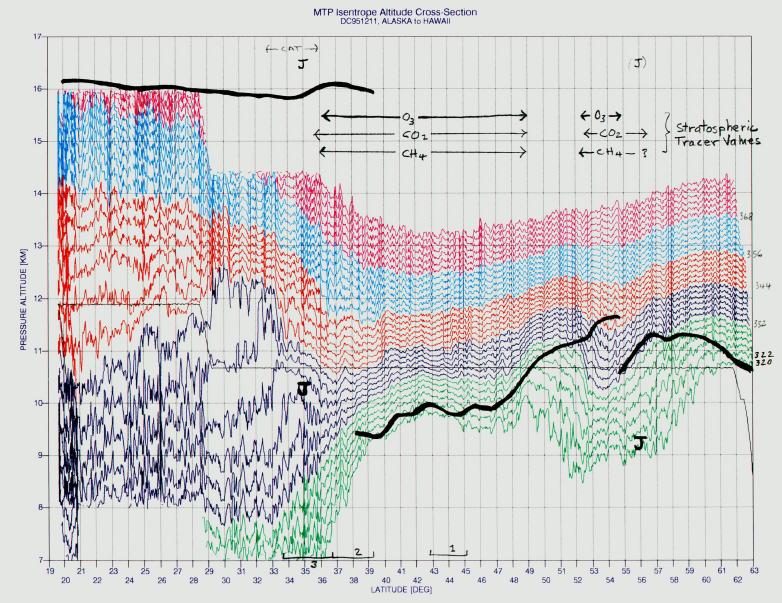
Figure 5. Complete isentrope altitude cross-section, showing location of wind jets, MTP tropopauses and in situ tracer analysis.
Figure 5 is a more complete representation of isentrope surface altitudes, showing surfaces at 2 K intervals (instead of 12 K). The thick black lines are averages of the individual MTP solutions for tropopause altitude. Note the discontinuity at 55 N, in association with the sub-polar jet (marked "J" below the tropopause). As noted before, isentropes are pulled downward in the latitude region 53 to 55 N, and upward from 49 to 52 N. There appears to be a counter-clockwise rotation about the jet (looking eastward, in the direction of the wind), with a tilt in of the rotation pattern such that higher altitude portions of the pattern are shifted equatorward.
In the vicinty of the sub-tropical jet there is a region of two tropopauses extending from 38 to at least 40 N (shown in more detail in a later figure). The altitude of wind jet stream maxima are below the local tropopause in both cases. Notice the isentrope distortions near the sub-tropical jet, with downward displacements immediately north of the jet and upward displacements south of the jet. North of the sub-tropical jet isentropes are close together (high stability, i.e., stratospheric) and south of the jet the isentropes are widely spaced (i.e., low stability, or tropospheric).
The aircraft's path is shown by the thin black trace and shows an altitude climb at 29 N. In situ measurements of tracers allow the air along the DC-8 flight path to be characterized as tropospheric or stratospheric, and these assignments are shown in the upper part of the figure. The in situ ozone tracer was measured by a chemiluminescence instrument (Principal Investigators: Brian Ridley, Andrew Weinheimer and J. Walega; see Ridley et al, 1992). The N2O, CO2 and CH4 tracers were measured by the DACOM instrument (Principal Investigators: Glen Sachse, James Collins and Bruce Anderson). In the vicinity of the sub-polar jet the air appears to be stratospheric where the isentropes have been displaced downward (52.5 to 55 N), whereas the air appears to be tropospheric where the isentropes have been displaced upward (49 to 52 N). While flying south past 49.0 N the air abruptly changes from tropospheric to stratospheric exactly where the tropopause descends below flight altitude, as it should. The MTP instrument appears to perform well in monitoring not only isentrope displacements but also tropopause altitude. In the vicinity of the sub-tropical jet the in situ tracers switch from stratospheric to tropospheric 1 degree north of the jet, which is also 2 degrees of latitude south of where the mid-latitude tropopause has disappeared. This is slightly surprising, and implies something about air motions in the vicinity of the sub-tropical jet.
Note also the location of the DC-8's encounter with moderate turbulence, from 36 to 33 N, which is above and to the south of the sub-tropical jet. At this location the wind speed should be falling off with altitude while the altitude gradient of temperature is still tropospheric, i.e., where the temperature field cannot support large vertical wind shears and where large wind shears are likely to exist (as described in more detail below).
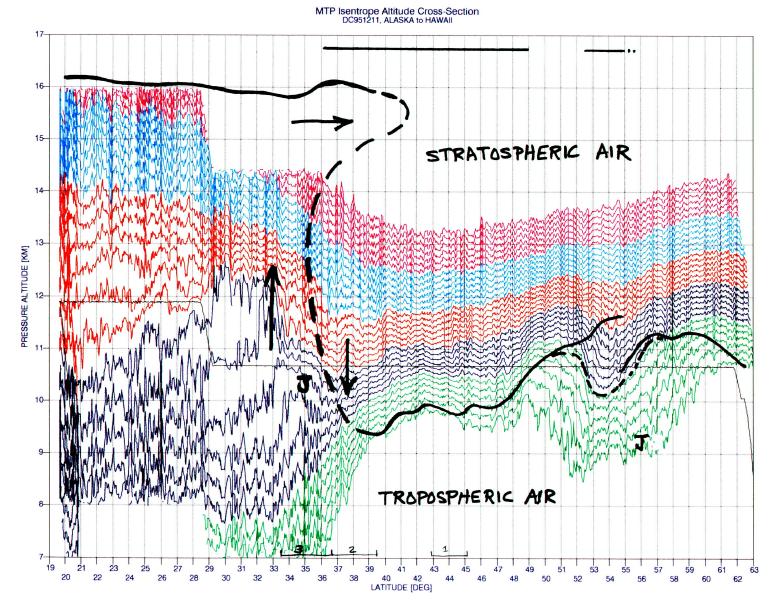
Figure 6. Possible tracer-based tropopause superimposed upon the isentrope altitude cross-section.
The above figure is an attempt to locate the tracer-based tropopause using only in situ measurements, MTP tropopauses and isentrope surface distortions. The bars at the top of the figure correspond to flight within stratospheric air, which unambiguously dictates whether to place the "tracer tropopause" above or below flight altitude for these flight segments. The MTP-derived tropopause guides in drawing a tracer tropopause at mid-latitudes and in the sub-tropics. The dashed line is a "guess" for how the tracer tropopause makes the transition from mid-latitudes to sub-tropics throughout the sub-tropical jet region, but some guidance comes from the apparent air motions inferred from isentrope distortions. Admittedly, it is a "stretch" to place the tracer-tropopause extending poleward in the vicinity of the sub-tropical tropopause at 15 to 16 km and latitude 35 to 41 N. The error in doing this will be shown in a later figure.
6. Interpretation of Temperature Field in Terms of Adiabatic Effects of Vertical Motions
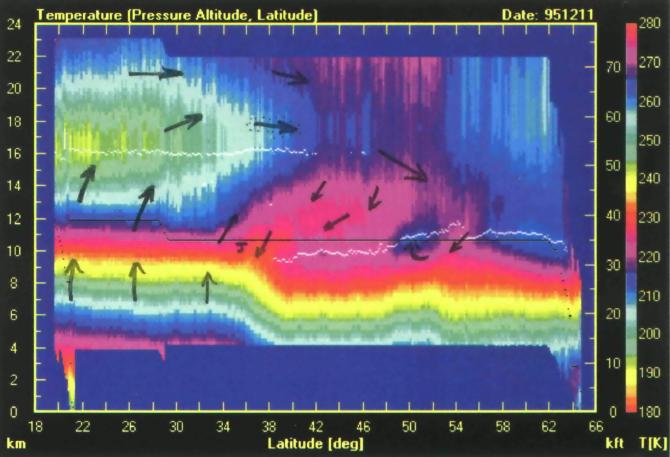
Figure 7. Color-coded cross-section of MTP-derived air temperature. Arrows indicate inferred wind direction, based entirely on the temperature field anomalies of the temperature field.
This color-coded air temperature cross-section summarizes much of what has been described so far. Since descending air adiabatically heats, and ascending air adiabatically cools, areas that are warm or cold with respect to their same-altitude environs may correspond to regions of descending and ascending air, respectively. This is what prompts us to draw air motion arrows near the sub-polar jet in the way they are indicated. Similarly, just north of the sub-tropical jet the air is warm, so we infer that the air there is descending. Since the warmer-than-same-altitude-environs region tilts from south/low to north/high, we have drawn the descending motion north of the jet as having a southward component.
There is only slight evidence for cooler, hence rising air on the south side of the sub-tropical jet (from 30 to 33.5 N). The known "residual-circulation" slow rise of air in the tropics inspires the two sets of upward arrows south of 30 N. The northward pointing arrow at 38 N and 18 km altitude is suggested by what appears to be an "intrusion" of cold air from the sub-tropics into mid-latitudes. The occasional high tropopause (16 km) north of 42 N is evidence for northward moving air, and is consistent with global atmospheric circulation models. The warm/descending air in the region 43 N and 13 km implies that some of the sub-tropical northward outflow returns at mid-latitudes before reaching polar latitudes. The cool air in the region 60 N and 11 km is probably due to diabatic cooling, which probably masks the fact that this air is actually descending.
7. Comparison of Vertical Motions Deduced from Tempearature Field With Models for Global Circulation
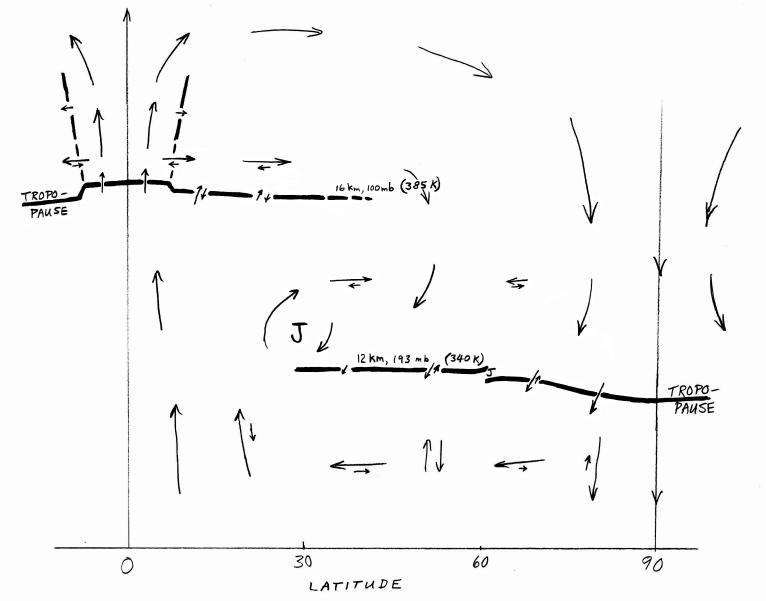
Figure 8. Currently accepted model for global circulation.
At the equator, during the course of a year, more sunlight is deposited (on a "per square meter of flat surface area" basis) than at any other latitude. This is what powers the atmospheric circulation engine. On average, air rises near the equator, crosses the tropical tropopause, and eventually moves toward the poles, where radiative cooling helps drive the air's descent along its poleward path. The air eventually crossing the tropopauses at mid-latitude and the polar regions, and returns to the tropics within the troposphere.
Figure 8 is co-author BLG's attempt to represent currently accepted beliefs about the global circulation pattern. Double arrows, with opposite directions and differing lengths, signify that air sometimes moves in each direction but the longer arrow shows which direction predominates (which indicates the "residual circulation"). Thus, across the mid-latitude tropopause there is, on average, more air moving downward than upward, especially near the pole. Similarly, there is more upward moving air crossing the tropical and sub-tropical tropopause, though sometimes there is downward moving air. The sub-tropical jet is shown by a large "J" symbol, and it is bounded by a double-tropopause. The sub-tropical jet region, from the lower tropopause to the upper one, is a barrier to horizontal transport of air out of the tropical troposphere into the mid-latitude stratosphere. The mid-latitude stratosphere between the two tropopause altitudes, is now commonly referred to as the "middle world." The set of horizontal arrows above the jet are meant to imply that more air is peeled off the sub-tropical air mass and is transported poleward than goes in the other direction. The curved arrows surrounding the sub-tropical jet is my possibly flawed understanding of how air typically circulates around the jet. When the jet's "rotating" is strong there can be an intrusion of stratospheric air into the troposphere, leading to a "tropopause fold" - with the lower tropopause boundary being double-valued over a small latitude region.
According to this picture we would expect that tracers for stratospheric air, such as ozone (which is high in the stratosphere), would show a tracer tropopause that extends northward from the 38 N and 16 km area, like the pattern in Fig. 6. In other words, we would expect the 100 [ppbv] ozone isopleth to have a northward spur at 38 N and 16 km. We would also expect this same isopleth to dip down and southward corresponding to an intrusion of high ozone air in the region 38 N and 11 km. Fortunately, on this flight a remote sensing instrument was measuring ozone profiles, and these are shown in the next figure.
8. Using Ozone to Define the "Tracer Tropopause"
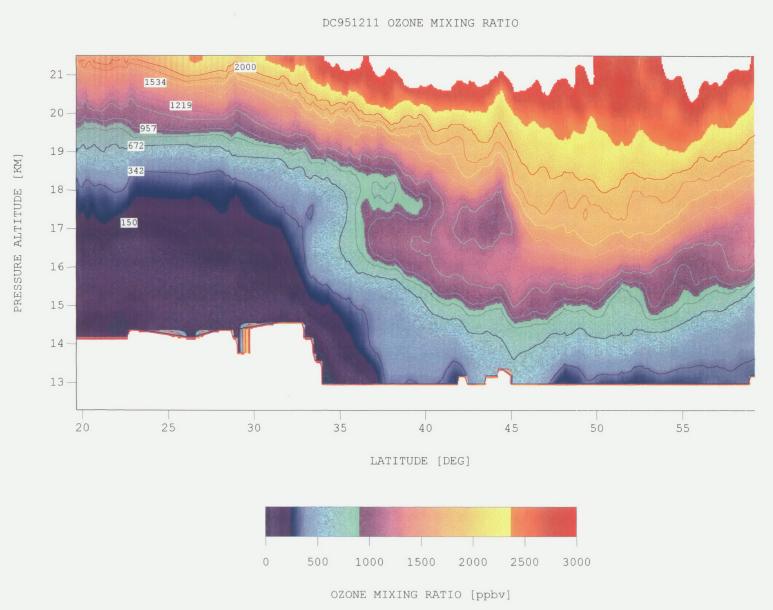
Figure 9. Color-coded cross-section showing isopleths of ozone mixing ratio. The 150 [ppbv] isopleth can be used to infer a "tracer tropopause."
The Langley DIAL lidar is a remote sensing instrument that measures ozone profiles, in this case from 13 to 22 km during the 10.7 km DC-8 flight altitude segment (Ed Browell is the DIAL Prinicpal Investigator). The 100 [ppbv] isopleth is not shown, but using the 150 [ppbv] isopleth for guidance we can estimate the altitdue of the ozone-based tracer tropopause (the Y-axis is mislabeled "pressure altitude" - it is actually "geometric altitude," and 0.6 km should be subtracted from the indicated altitude to approximate a correct pressure altitude; i.e., the northward "intrusion" at 38 N and 18.0 km is actually at 17.4 km). This is indicated in the next figure, where we've free-hand drawn the tracer-tropopause.
9. Comparing the Tracer Tropopause and the Temperature Field Tropopauses
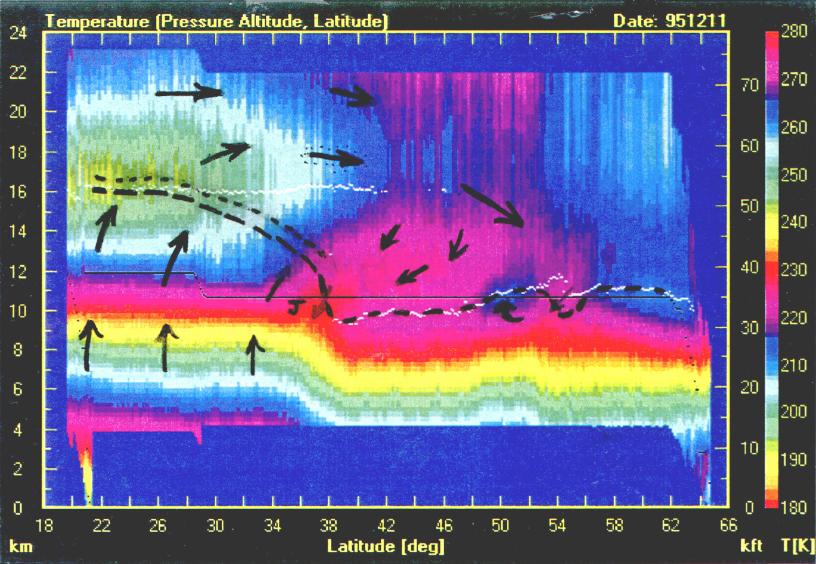
Figure 10. The ozone-based "tracer tropopause" has a complicated relationship with the MTP-measured "temperature field tropopause" in the vicinity of the sub-tropical jet.
In this figure the dotted black line (the upper-most line) is the 150 [ppbv] ozone isopleth from the DIAL instrument, as shown in the previous figure. The dashed black line above the sub-tropical jet and to the south is an estimate of the 100 [ppbv] ozone isopleth, which is often associated with the tropopause (although some investigators prefer to use ozone isopleths as high as 140 [ppbv] to indicate tracer tropopause altitude). This heavy dashed line, 100 [ppbv] ozone isopleth, descends almost vertically north of the jet and crosses the DC-8 flight level at a latitude where the in situ tracers have placed the tracer tropopause; the abrupt vertical slope at 38 N was required to reconcile the two methods (DIAL and in situ measurements) for determing the tracer tropopause. North of 38 N the tracer tropopause is based solely on in situ tracer measurments (and the assumption that when MTP indicates the temperature tropopause is below flight level and in situ measurements indicate that flight is within the stratosphere, then the tracer tropopause is co-located with the temperature tropopause; and a similar argument for the opposite case). Notice that by adopting the 100 [ppbv] ozone isopleth for indicating the tracer tropopause there is agreement with the temperature-based MTP tropopause south of 28 N (i.e., in the sub-tropics), and there is a way to reconcile the tracer tropopause with the MTP tropopause north of about 38 N, but there is DISAGREEMENT of the two tropopause types in the transition region between about 30 N and 37 N, above the sub-tropical jet!
Apparently when there is a strong jet the tracer tropopause can be BELOW the uppermost themperature-based tropopause for as much as 8 to 12 degrees of latitude! The present data suggest that when there is a double tropopause the tracer tropoapuse is co-located with the lower temperature-based tropopause.
The much weaker subpolar jet appears to have distorted the temperature-based
tropopause in a way that somewhat resembles the distortion found near the
subtropical jet. Although there is never a "double tropopause" above
the subpolar jet, there is a discontinuity of tropopause altitude above
the jet, with the southern tropopause sloped upward to the north and the
lower tropopause sloped downward to the south. There is evidence
for adiabatically heated descending air north of the tropopause discontinuity,
and evidence for adiabatically cooled ascending air south of the discontinuity.
There is a 4 degree latitdue region where the temperature-based tropopause
is ABOVE the tracer tropopause (Fig.6 shows this most clearly). Probably
in this case the temperature field is "distorted" by descent motions, while
tracers remain unchanged and reliable in their depiction of the "real tropopause"
location. Again, it is the lower of two temperature-based tropopauses
that is a more reliable guide to the tracer tropopause altitude.
We hypothesize that within this 4 degree latitude region the lowermost
stratosphere has descended and adiabatically heated, thus warming what
once was a cold layer of tropopause air, and consequently artificially
moving the temperature-based tropopause up to a level where there had been
less descent and adiabatic heating. This situation is reminiscent
of the "jumping tropopauses" (documented by the third panel of jumping
tropopause.)
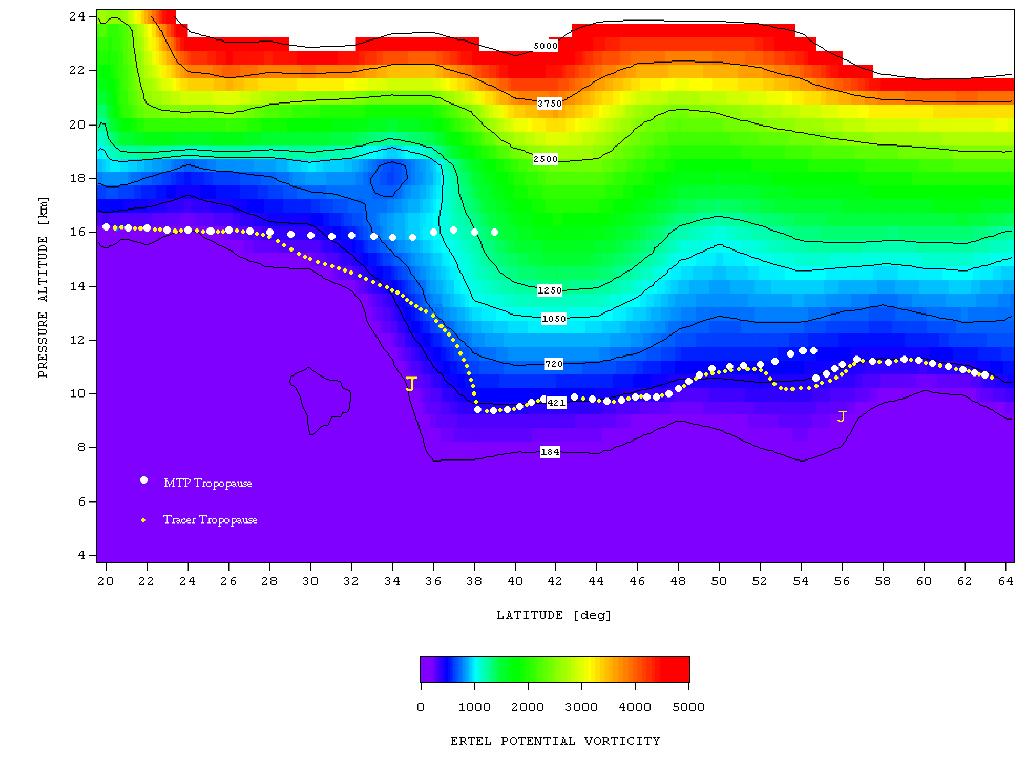
Figure 11a. Ertel potential vorticity [10 -8
K m2/kg s] as calculated by Rood et al (GSFC). The white circle
synbols are MTP-derived tropopauses. The small yellow dots above
the subtropical jet (large J) show a transition from the lower tropopause
to the upper one that approximates the DIAL ozone-based tracer tropopause.
Figure 11a is a cross-section of Ertel potential vorticity, EPV, derived from the TOTE/VOTE XS-file for this flight, which was produced by NASA's Goddard Space Flight Center (Rood et al) and is based on assimilated data interpolated to the DC-8's flight track. Throughout the midlatitude region the MTP tropopause is close to the 420 EPV isopleth (corresponding to 4.2x10⁻⁶ [K m2/kg s]). Above and to the south of the subpolar jet (small J symbol) the MTP tropopause is higher by about 1 km than this isopleth for latitudes 52 to 54 N. Apparently the EPV model "missed" structure from 50 to 54 N, as the in situ tracers definitively call for an S-shaped structure for the tracer tropopause in this region (see Fig. 6). Near the subtropical jet the 420 EPV isopleth under-represents the sharpness of the upward inflected structure, assuming there should be a correspondence between the DIAL ozone 100 [ppbv] isopleth and the EPV 420 isopleth. Nevertheless, the 420 EPV isopleth is in approximate agreement with the inferred tracer tropopause throughout the entire latitude region of this cross-section.
There is striking evidence in the EPV cross-section for poleward movement
of air above the tropopause in the subtropical jet region (i.e., at 18
km and 34 N). This region is also where MTP shows evidence for poleward
motion based on the coldness this air. Furthermore, the DIAL ozone
cross-section also shows evidence for northward motion in this region (recalling
that 18 km pressure altitude corresponds to 17.4 km in Fig. 9), as this
region appears to be a northward intrusion of lower ozone air. An
ozone mixing ratio of 350 [ppbv] is not tropospheric, so either ambient
stratospheric air has mixed with the northward moving upper-tropospheric
subtropical air, or ozone has been produced during its northward motion.
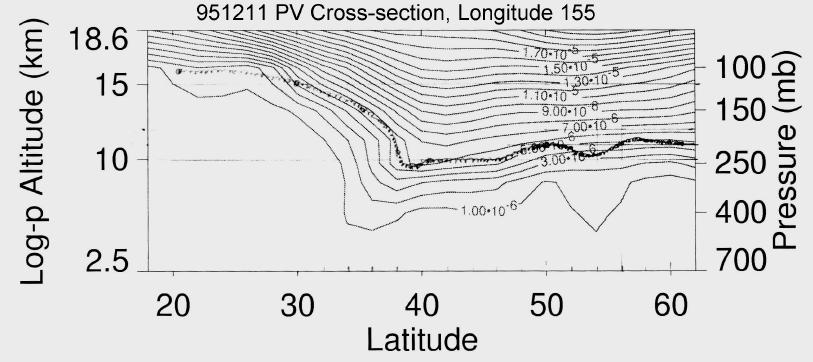
Figure 11b Potential Vorticity isopleths (from Laura Pan, personal communication) and the tracer tropopause derived above.
Fig. 11b shows a calculation of potential vorticiy along the 155 west degree longitude meridian, which is close to the DC-8's flight track. This different calculation is derived ...[Laura Pan, we need some info from you here]. Notice the remarkable similarity in shape of the PV isopleths and the hypothesized tracer tropopause in the confused region above the subtropical jet, i.e., 9 to 16 km altitude, 32 to 40 N. Both the tracer tropopause and 5.5x10⁻⁶ PV isopleth exhibit an almost vertical slope at 38 N, 9 - 11 km. This PV calculation shows a better correlation with the tracer-inferred tropopause above the subtropical jet than the previous PV calculation. However, it shows only weak evidence for northward moving air above the subtropical tracer tropopause. The two PV calculations are in approximate agreement in associating the tracer tropopause with PV values; 5.5x10⁻⁶ [K m2/kg s] for Fig. 11b data, and 4.2x10⁻⁶ [K m2/kg s] for Fig. 11a data.
To us it seems compelling that the presence of air showing a diluted temperature field signature of a neighboring region's tropopause can only be explained by a horizontal transport process. For example, at 16 km altitude and 32 to 46 N, a region that according to ozone and PV is stratospheric, there is nevertheless "evidence" of the sub-tropical tropopause in the temperature field. We would like to know how modelers can account for this, and we suspect that the only way is to invoke horizontal transport of air. But if there is horizontal transport, why does the 100 [ppbv] ozone isopleth slope the way it does (unless ozone and PV are produced during its poleward transport)?
We would like to challenge modelers with the following four questions: 1) Why doesn't the temperature-based tropopause monotonically change with latitude in a smooth manner between a high value (16 km at 28 N) and a low value (9.4 km at 38 N) the way ozone and PV isopleths do? 2) Why is there a double tropopause feature in the temperature field poleward of the jet, starting 3 degrees of latitude north of the jet max and extending to 5 or 7 degrees of latitude north of the jet max? 3) If there is poleward movement of upper-tropospheric air out of the subtropics immediately above the subtropical jet, as several observationsl lines of mesoscale evidence suggest there is, how can the isopleths of ozone and potential vorticity be so resistant in showing these motions at synoptic scale? 4) What could cause the temperature field above the subpolar jet to be so distorted that the temperature-based tropopause can be as much as 1 km above the tracer tropopause over a 4 degree latitude region?
10. Summary of Temperature-Based Tropopauses with Tracer Tropopause
When the tropopause is well defined, with an overlying inversion layer for example, it is invariably in good agreement with the tracer tropopause (ozone increases dramatically when ascending through it, water vapor decreases dramatically, and many other tracers do what's expected). When the temperature field has a well-defined tropopuase it is useful to refer to the tropopause as a surface.
However, at the latitude boundary between a troposphere with deep convection (tropics) and less deep convection (mid-latitudes) there will be a jet that rotates during its zonal movement, and this rotation will push tropical air above the jet poleward and pull mid-latitude air below the jet equatorward. The tracers and isentropes will follow the air masses in these latitude displacements. At the jet latitude a vertical cross-section will show both tropopauses. But a tropopause is "legitimate" only if it agrees with tracer profiles. Therefore, the present analysis must call into question the legitimacy of the temperature field tropopause above the sub-tropical jet, for it does NOT agree with the tracer (or PV) tropopause. The temperature field tropopause below the sub-tropical jet agrees with the tracer field. This behavior suggests that whenever there are two temperature field tropopauses, the lower one is legitimate, and the upper one is false (does not correspond to the tracer tropopause).
The gradation from a valid lower tropopause (below the jet) to a misleading upper tropopause (above the jet) means that we are allowed to think of this altitude region associated with the sub-tropical jet as "an unusual transition layer" between two tropopauses, a legitimate lower one and a "remnant" upper one. The upper one is a "remnant" because it is connected to a legitimate tropopause in the sub-tropics.
Whenever this situation of an "unusual transition layer" is encountered, the MTP shows that T(z) has a distinctive shape, which in casual conversation has been referred to as a "cat's face profile" (M. J. Mahoney, private communication). The WMO definition uses a lapse rate of 2 K/km (i.e., dT/dz = -2 K/km) as a criterion for distinguishing tropospheric air from stratospheric air. A "cat's face profile" is one having a T(z) shape where there is a large altitude region with dt/dz ~ -2 K/km. Invariably, the top of this layer is associated with the sub-tropical tropopause (16 km) and the bottom of the layer is associated with the mid-latitude tropopause (11 km). Since small changes in T(z) can cause a single tropopause solution to jump back and forth between these two tropopause altitudes, the "cat's face profile" is frustrating for MTP. This study suggest that whenever this T(z) profile is encountered, the bottom of the -2 K/km layer corresponds to the tracer tropopause and the top of the layer corresponds to a temperature field remnant of the sub-tropical tropopause. It may also be possible to suppose that a wind field jet is nearby.
11. Clear Air Turbulence Produced by Sub-Tropical Jet
This section presents a highly speculative answer to some of the questions posed in the preceding section. If the speculation is found inadequate, then at least the section will have merit in providing support to a generally accepted theory for clear air turbulence generation.
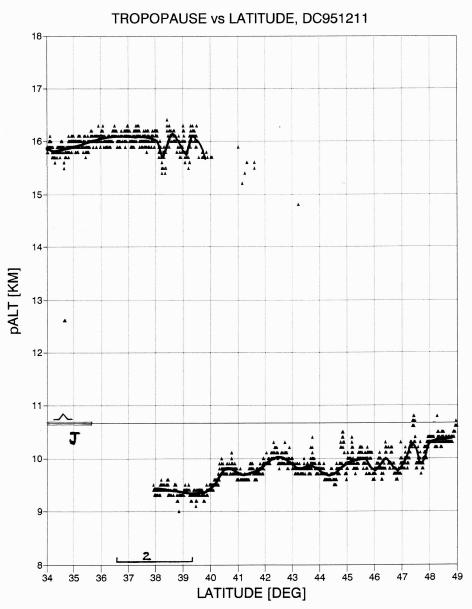
Figure 12. Detail of double tropopause region showing structure suggestive of altitude oscillations.
Figure 12 shows that the double tropopause is present for at least 2 degrees of latitude, from 38.0 to 40.0 N. The several tropopause symbols plotted in the 15 - 16 km and 41 - 42 N region shows that sub-tropical tropopause air had resisted dilution sufficiently to produce tropopause solutions for at least 2 more degrees of latitude during its northward motion.
The undulations of tropopause altitude in this figure, apparent in both the upper and lower tropopauses, suggest that in these regions the wind field's vertical gradient was sufficient to set-up vertical oscillations. The horizontal wavelength of these "waves" is 100 km or less (projected on the north-south cross-section), which is longer than that usually associated with Kelvin-Helmholtz waves. However, there is more direct evidence for vertical wind shear K-H wave activity, as explained below.
Notice the location of the sub-tropical jet, at 35 N and 10.4 km. The DC-8 flew a mere 300 meters above the jet maximum, according to this placement of the jet. With the jet max below flight level, it is predicted that the vertical wind shear was negative during the DC-8's passage through the region. Indeed, this is borne out by a correlation of wind speed with theta (potential temperature), where the ever-present wrinkle structure of the theta field allows for a fortuitous altitude probing of all manner of tracers - including wind.
Moderate turbulence was encountered between 35.7 and 32.8 N, which is exactly above the jet stream. According to the K-H theory for the generation of clear air turbulence, CAT, the vertical gradients of theta (static stability) and wind should bear a special relation to each other in order for vertical displacements to amplify and possibly lead to wave-breakdown. Richardson Number, Ri, is the ratio of static stability to the square of the gradient of vertical wind shear, multiplied by terms to produce a dimensionless parameter that is the ratio of stabilizing to overturning forces. The correlation of wind vector with theta during a 10-minute period of turbulence permitted us to determine the vertical gradient of wind with theta, dWind/dTheta = -3.52 [knots/K]. MTP measured a vertical gradient for theta, dTheta/dZp = +8.4 [K/km]. These two gradietns allow the derivation of vertical wind shear to be dWind/dZp = -15.2 [m/s per km]. From this we calculate that Ri = 0.95. K-H theory requires that Ri be < 1/4 in order that vertical displacements amplify, and this condion must exist for an unspecified time in order for the growing wave to overturn, or break-down. If this happens, and CAT is produced, the post-CAT layer will have Ri = 1.00. Thus, it is possible that the region flown through by the DC-8 had already experienced CAT generation, and was in the post-CAT generation phase, i.e., the DC-8 was flying through a layer of air having a residual of turbulence that was in the process of dissipating, having already undergone CAT generation. It is also possible that shallow layers at nearby altitudes were generating CAT because they were undergoing periodic compressions, bringing their isotach and theta surfaces together, thus lowering Ri (Ri changes since it is proportional to the ratio of dTheta/dz to the square of dWind/dz). This CAT encounter is compatible with the K-H theory for CAT generation, and constitutes one more gratifying case of observational support for the K-H theory.
The conditions just described, which we believe explain the moderate CAT encounter, are probably to some extent also true for the entire region between the subtropical jet and the upper tropopause. Specifically, this is a region of low static stability and high vertical wind shear. It is tempting to speculate, therefore, that this entire region is undergoing intermittent CAT genreation. Each layer of CAT produces a complete vertical mixing of tracers. If the CAT layers are generated at random times, at random altitudes, there will result a "random walk" of the tracers throughout the entire region involved in the random CAT generation. This will eventually produce a smooth gradient of tracers throughout the region between the jet and upper tropopause, regardless of how much structure existed before the CAT mixing process begins. To phrase it differently, the coefficient of vertical diffusion is going to be much larger above the jet than elsewhere due simply to the abundance of randomly generated CAT layers. This concept for CAT comprising a component of vertical diffusion was first proposed by xxx (197x).
If the CAT component of vertical diffusion were large, then any poleward moving air would lose its original vertical structure of tracers and PV. Ozone-rich air would be brought down toward the jet, as would high PV air, while the temperature field would remain sub-adiabatic. This is one mechanism for creating a smooth vertical profile of ozone and PV from air that started its poleward migration with a subtropical upper-troposphere structure.
[This idea probably has flaws, and I intend to think about it more. It may not appear in a journal submission.]
12. Conclusion
High resolution latitude cross-sections of the temperature field and stratospheric tracers ozone and potential vorticity produce confusing picture for "the tropopause" above the sub-tropical jet. Whereas ozone and potential vorticity isopleths show a monotonic change with latitude of tropopause altitude above the subtropical jet, the MTP-measured temperature field shows that temperature-based tropopause solutions exhibit a completely different behavior with latitude. Above and south of the jet the temperature field tropopause is at 16 or 17 km, while north of the jet there are two tropopause solutions, one associated with the midlatitude tropopause (about 10 km) and the other associated with the subtropical tropopause, at about 16 km. In other words, the temperature field does not allow for a smooth altitude transition for the tropopause above and to the south of the jet whereas ozone and potential vorticity exhibit a smooth transition. We challenge modelers to explain these two, discrepant tropopause versus latitude patterns. Evidence is present in the MTP temperature field, remotely sensed ozone field, and asimilated potential vorticity field, for poleward movement of air above the sub-tropical jet. Any explanation for the discrepant tropopause patterns will have to accomodate poleward air motion in the vicinty of the temperature profile tropopause above the subtropical jet. The evidence presented here provides the following guidance for the real-time interpretation of MTP tropopauses: 1) whenever there's a double tropopause, the tracer tropopause is associated with the lower of the two; 2) whenever there is only one high-altitude tropopause, the tracer tropopause will be at or below the that tropopause.
In the vicinity of the sub-polar jet we conclude that the tracer tropopause can be as much as 1 km below the temperature-based tropopause in a 4 degree latitude region above the sub-polar jet, where we speculate that air is descending in a way that produces a false temperature profile tropopause solution. We also challenge atmospheric modelers to account for this enigmatic feature.
Acknowledgements We thank Brian Ridley, Andy Weinheimer and J. Walega for letting us use their in situ ozone measurements, and we also thank Glen Sachse, James Collins and Bruce Anderson for letting us use their in situ CO2 and CH4 measurements, all of which contribute to establishing the shape of the tracer tropopause, and its relationship to the thermal tropopause, in the sub-tropical and sub-polar jet regions. We would like to thank Paul Newman and Leslie Lait for providing the analyzed wind field which was used to locate the jet stream locations. We thank the GSFC theory team, led by R.Rood, for providing the TOTE/VOTE project with assimilated PV fields interpolated to the DC-8's flight track. The TOTE/VOTE series of research flights were ably planned and directed by Project Scientists Mark R. Schoberl (of GSFC) and O. Brian Toon (of the Ames Research Center at the time of the flights). We thank Laura Pan for providing a PV cross-section and useful discussions. A portion of the research described in this publication was carried out by the Jet Propulsion Laboratory, California Institute of Technology, under a contract with the national Aeronautics and Space Administration.
REFERENCES
"A small, high sensitivity, medium-response ozone detector suitable for measurements from light aircraft", B. A. Ridley, F. E. Grahek, and J. G. Walega, Journal of Atmospheric and Oceanic Technology, 9, 142-148, 1992.
____________________________________________________________________
This site opened: June 3, 1999. Last Update: October 23, 2003