
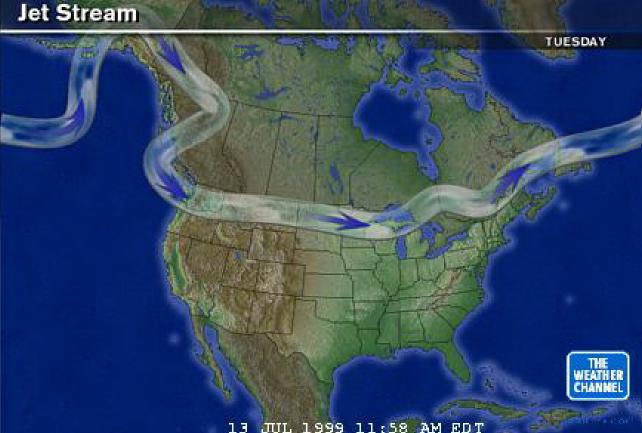
Figure 0. Location of jet stream.
Figure 1. Latitude distribution of RAOBs for this epoch and longitude (about -100).
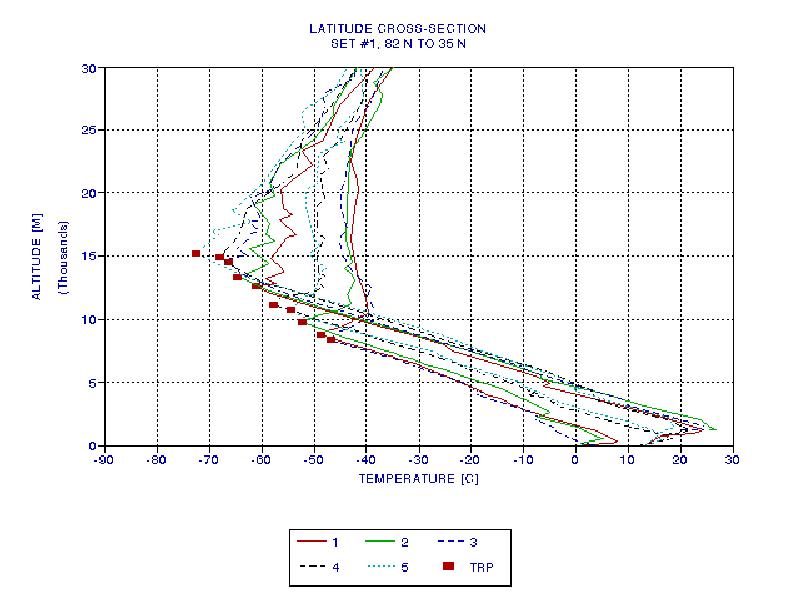
Figure 2. The northernmost 10 sites. All cases are single tropopauses.
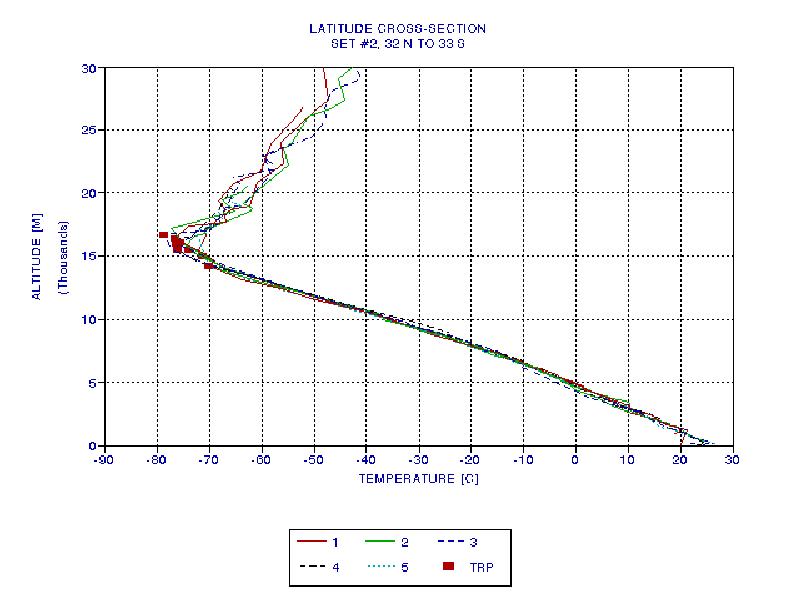
Figure 3. Equatorial sites.
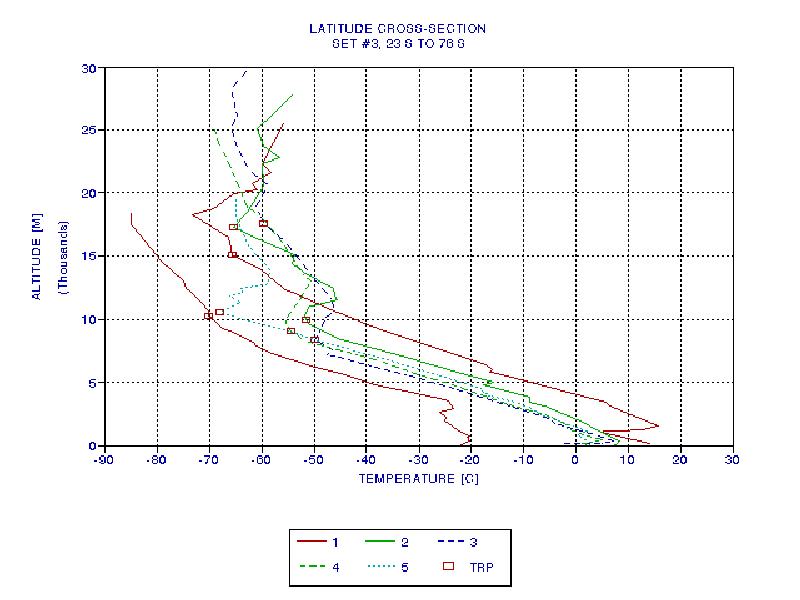
Figure 4. Southern Hemisphere sites, showing double tropopauses
(must be a stronger jet there). The cold profile is from Antarctica
(76 S).
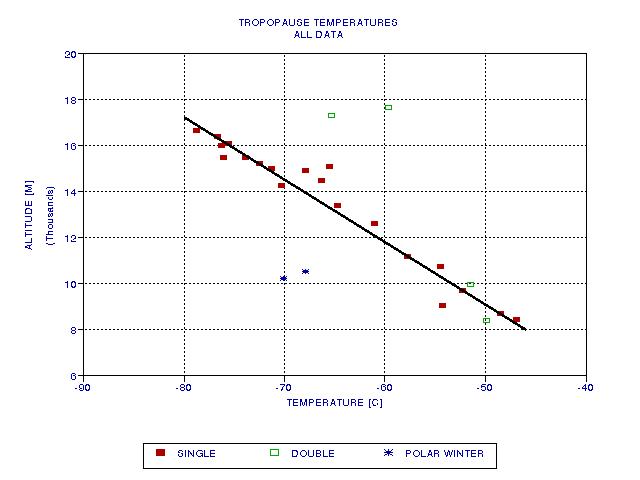
Figure 5. Relationship of tropopause altitude and temperature.
Figure 5 is remarkable, as it shows that if you exclude the upper trop of the double tropopause cases and winter polar tropopauses the rest align close to a line given by:
T[C] = -80 [C] -3.8*(Zgtrop - 17.2 km)
Surely, this correlation can be used to enhance MTP T(z) solutions. It should also help provide guidance in determining whether a given situation is a double tropopuase case or not.
I may add comments to this web page as I continue to think about some of the unexpected "results."
___________________________________________________________________________
This site opened: July
13, 1999.
Last
Update: July 13, 1999