MOUNTAIN WAVES AND THE OZONE HOLE
During the 1987 Antarctic late-Winter and Spring the "ozone hole" was studied from the ground, the air and from satellites. NASA led in sponsoring all these investigations. The SAGE II satellite instrument had already been in orbit for other studies, but it was an ideal payload for studying the ozone hole. The following two images are from SAGE II instrument.
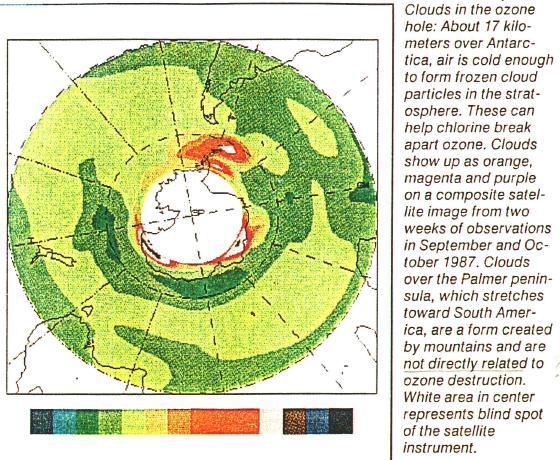
Figure 1. Average location of polar stratospheric clouds, PSCs, during a 2-week period in September and October, 1987.
This image shows that over the Antarctic Peninsula (also called the Palmer Peninsula) there are persistent PSCs. The PSCs presence is strongest just downwind of the peninsula (given that the wind at this time makes a clockwise pattern around Antarctica). The caption within the figure was produced by NASA Langley Research Center before they knew about other evidence and theory to implicate mountain waves in the destruction of ozone, and the statement "not directly related to ozone destruction" can be disregarded.
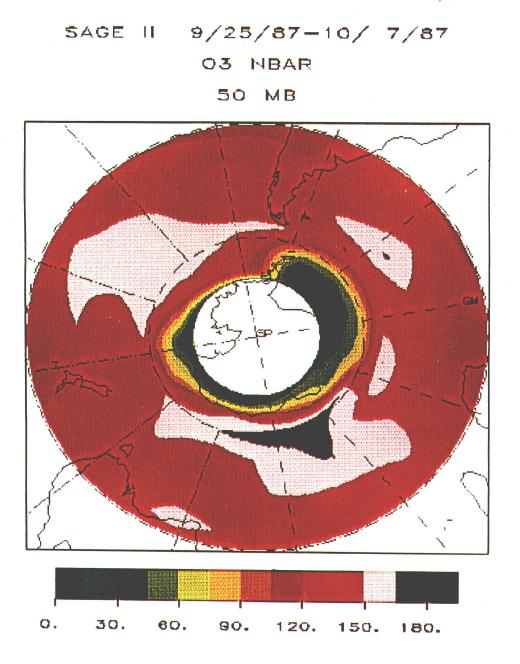
Figure 2. Amazingly, the same satellite shows a pattern of ozone loss just downwind of the Antactic Peninsula.
The fact that there's a dramatic onset of lower ozone where the PSCs are located implicates that the PSCs play a role in destroying ozone. This is no surprise, as theory says they should. But what causes the PSCs to form at the Antarctic Peninsula?
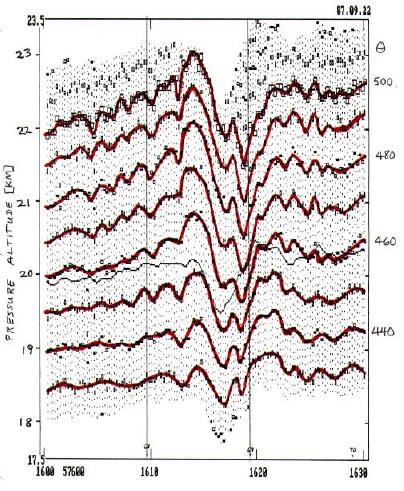
Figure 3. MTP measurements of a mountain wave over the Antarctic Peninsula that persisted for at least 3 days during the same 2-week period that SAGE II was making the observations that are mapped in the previous two figures. The red traces show the altitude of isentrope surface, labelled on the right margin. The aircraft altitude is shown by the thin black trace at about 20 km. There was NO turbulence in this wave.
During the AAOE (Airborne Antarctic Ozone Experiemnt) the ER-2 mounted MTP measured the altitude of isentrope surfaces during all flights. In Fig. 3 it is apparent that a moutain wave has penetrated the tropopause (at perhaps 9 km altitude), and is growing in amplitude with altitude. This wave is associated with 12,000-foot Mount Stephenson. A wave was present on three successvie flight days at the exact same location, so it is safe to assume that mountain waves typically persist for many days over the Antarctic Peninsula. This answers the question "What causes the PSCs?" since the tops of the wave are colder than their undisturbed state. For example, at 23 km the isentropes are about 0.5 km higher than at the edges, meaning that the air is 5 K colder than normal. The coldness condenses water vapor and nitric acid to form PSCs.
At 870817 Topography it is shown that the tops of a mountain wave were associated with PSCs, and that the PSCs must have been water ice crystals produced when the adiabatic cooling during the air parcels ascent up the isentrope surface had exceeded the capacity of the air to hold water vapor, leading to supersaturation and condensation.
MTP wave amplitudes have been shown to grow with altitude in a way that agrees with theoretical predictions.
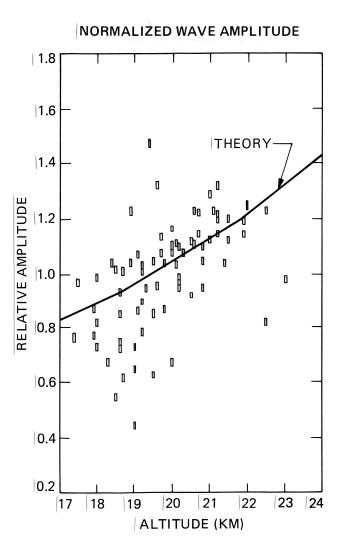
Figure 4. Wave amplitude versus altitude (after amplitude offsetting different wave events by a multiplier to achieve the best fit). The "theory" trace corresponds to wave growth as the reciprocal of the square root of air density (i.e., constant wave energy with altitude).
This figure shows that mountain wave growth in the lower stratosphere grows in agreement with a theory in which the wave is not reflected or absorbed as it propogates upward.
Where does MTP say the mountain waves are found?
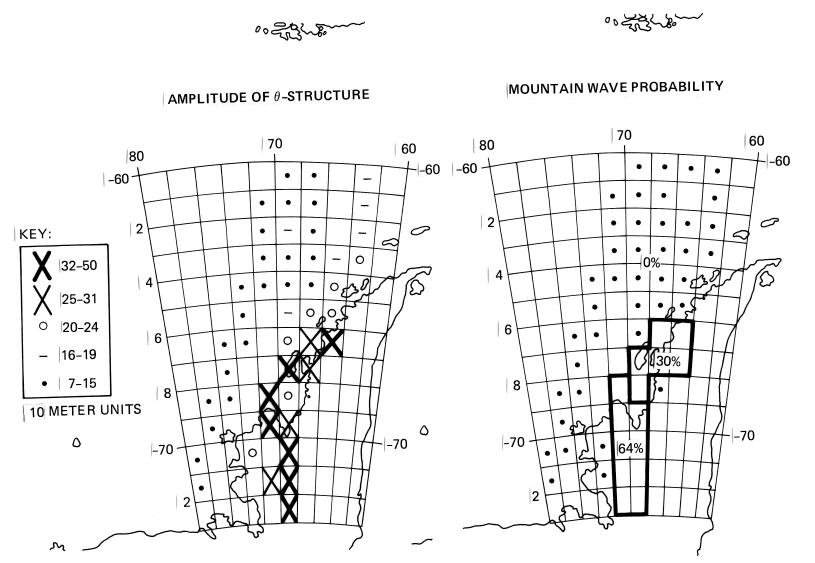
Figure 5. The mesoscale wave amplitude is large only over the Antarctic Peninsula, never over the ocean, according to this analysis of all AAOE flights. Also, the probability of encountering waves with an amplitude exceeding an arbitrary threshold is large only over the Antarctic Peninsula.
These figures are in agreement with the SAGE II data, Fig. 1, showing that large amplitude waves are present only over the Antarctic Peninsula, not over the ocean, and that the probability of waves being present is large over the Antarctic Peninsula. It is noteworthy that the pilots intentionally did not fly east of the Antarctic Peninsula (i.e., downwind of the mountains) because they saw a greater amount of visual evidence for mountain lee waves there. Fortunately, none of the waves they did fly through were breaking or otherwise unstable, since CAT encoutners were rare during the mission.
These various observations, satellite SAGE II and airborne MTP, provide a strong case that mountain waves create the cooling that condenses water vapor sufficiently to dehydrate and denritrify the air in the lower stratosphere, leading to the chemical reactions that destroy ozone and create the "ozone hole."
One factor accounting for the much lower ozone destruction over the Arctic in relation to the Antarctic is the lack of mountains aligned perpendicular to the vortex wind direction. At least two other factors are that the Arctic vortex winds don't adhere to a zonal flow, but meander throughout a larger latitude range, and the Arctic vortex breaks up earlier in the Spring season, before sufficient denitrification has occurred (this is due to the lack of symmetry in the northern hemisphere land/ocean layout).
This site opened: September 9, 2000. Last Update: September 9, 2000