 ......
Microwave Temperature Profiler Beginnings
Index of Links Within This Web Page
Origin of the MTP Idea
Ground
Based Temperature Profiling Preceded MTP
First Demonstration
of an Airborne Profiler, the CV-990 TSR
The MTP/KAO Instrument
The MTP/ER2 Instrument
The First Ozone Hole
Mission
The MTP/DC8 (Third Ozone
Hole Mission)
Mission List Summary
The Principals (MTP Personnel)
The idea for the Microwave Temperature Profiler, MTP, occurred to me during a flight to Mexico City. In 1977 I was on travelling with my family to a Christmas celebration at my inlaws. I recall sitting in my brother-in-law's living room sketching how the instrument might work.
I recall thinking that the TSR, as I called it then (for Temperature Structure Radiometer), would be able to warn of Clear Air Turbulence, CAT, when the lapse rate was close to adiabatic. I mistakenly thought that the closer to adiabatic the more likely was CAT. I later sold the idea for funding a TSR to NASA with this mistaken idea. Only as I worked with the theory of CAT generation did I realize that an adiabatic layer cannot store much vertical wind shear, and so it has a small resource of wind contrast for conversion to CAT energy. Indeed, it would be the inversion layers, I eventually reasoned, that should provide the wind contrast energy source for CAT. This just illustrates that sometimes a good idea can be persuasive for the wrong reasons. Intuitively, however, I was correct in thinking that the wind field was somehow related to the temperature field, and therefore measuring the temperature field should have CAT predictive value.
The use of an MTP in 1987 during NASA's first airborne "ozone hole" mission is described in an article that appeared in the British journal Spaceflight. This link consists of two JPEG images with sizes 200K and 300K. The article briefly recapitulates the history of the first TSR, and two later MTPs. In the remainder of this web page I will tell little stories of how the MTP program developed.
Ground Based Temperature Profiling Preceded MTP
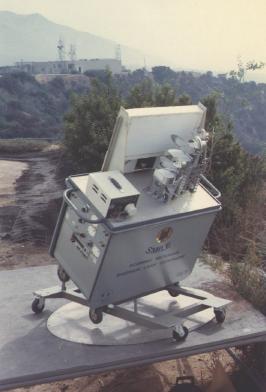
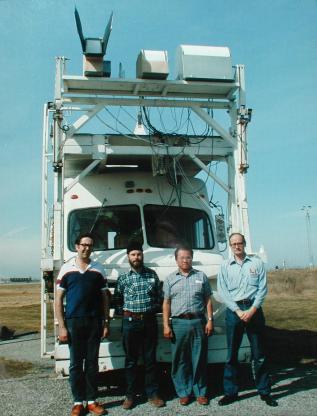
Before that fateful commercial flight to Mexico in 1977 I had been doing ground-based temperature profiling, using the engineering model of the SCAMS (Scanning Microwave Sounder, I think) which JPL had built. Goddard Space Flight Center, GSFC, had overseen the satellite SCAMS project, and after the flight model SCAMS was launched into orbit apparently GSFC forgot they had an engineering model that was at JPL where all hardware work was done. JPL wanted to put this engineering model SCAMS to good use, and I agreed to be the one to do something useful with it. The first configuration for the SCAMS for ground-basd work was called SMILE, for (Scanning Microwave Inversion Layer Experiment). Later, I directed the construction of a van-borne set of remote sensing instruments that was deployed at the Buffalo Airport in 1983 for the purpose of monitoring overhead air temperature profiles and cloud water content in an attempt to demonstrate the ability to warn of aviation icing hazard for aircraft landing and taking off from the airport.
......
Figure 1. SMILE, 1974. Figure 2. MARS, at Buffalo Airport, 1983.
Because of this background it was a small step for me to concieve of the idea of using the SCAMS in an airplane. After all, it worked in orbit, looking down, and I showed that it worked on the ground, looking up, so it was obvious that it would also work in an airplane looking both up and down. I devised the scheme of scanning above and below the horizon, with the center of the scan arc pointed in the direction of flight. I also quickly realized that the horizon view of the several channels could be intercalibrated (for offset) by forcing their horizon brightness temperatures to be the same. This is something you can't do with the ground-based or satellite-based versions of the instrument.
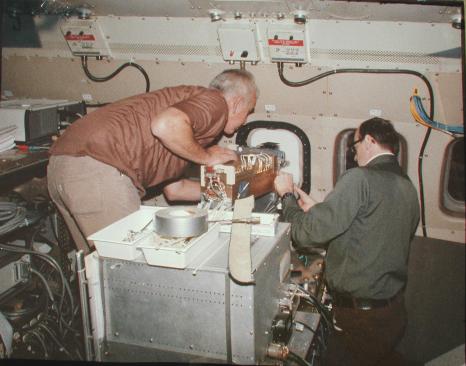
The first airborne MTP (as I'll call it) was the SCAMS mounted inside a CV-990 research airplane based at NASA's Ames Research Center. The entire SCAMS instrument was mounted inside the aircraft cabin, and the horn antenna scanned an arc of sky through a microwave transparent window. Actually, the window was not entirely transparent to microwaves, as it absorbed about 3% and reflected another 1 or 2 % at its two surfaces. Richard Denning was the engineer on this task, and he had also been the engineer who modified the same SCAMS instrument for my ground-based field experiemnts. (RFD was a crucial engineer for the construction of the flight model SCAMS, so he was intimate familiar with the SCAMS.)
 .....
.....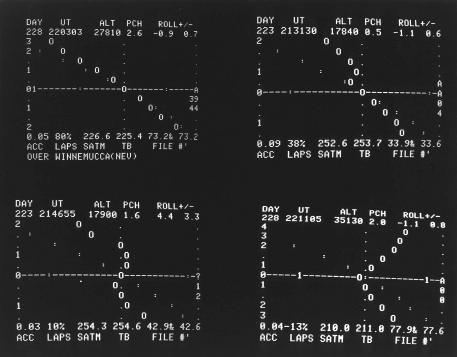
Figure 3. Installing the SCAMS in front of the special microwave window in the CV-990, ca. 1978.
Figure 4. Sample of altitude temperature profiles (adiabatic, shallow inversion layer above FL, thick IL with CV-990 flying within it, flight at tropopause altitude).
The funding for this first demonstration of an airborne MTP was on behalf of turbulence studies. The CV-990 had already been scheduled to fly a series of flights for CAT studies with a Doppler lidar as the main experiment. The lidar, operating at 10.6 microns, had been developed by NASA's Marshall Space Flight Center, MFSC, under the direction of Ed Weaver. A few years before this flight series was to begin it was generally believed that the lidar would not solve the CAT problem because the instrument was too large, heavy, expensive and difficult to operate. The lidar was OK for research, but decades away from commercial use - assuming it worked. To "hedge their bets," NASA Headquarters wanted to fly other instruments that were smaller and possibly closer to commercial status. Dr. Pete Kuhn's infrared radiometer and my SCAMS MTP were added to the mission payload with this hedge in mind. You can see a report of the SCAMS study of CAT during this mission at CV-990 Results.
During the CV-990 CAT mission, from 1978 to 1979, Pete Kuhn pointed out to me that my in-flight commentary (over the microphone headsets) showed an association of MTP-determined tropopause altitude and CAT encounters. In other words, CAT frequently occurred when I was reporting that the CV-990 was flying near the altitude of the tropopause. (The mission manager also commented to me years later that some of my bold predictions for upcoming CAT were "right on"!) I am indebted to Pete Kuhn for encouraging me to build an MTP for use on the C-141 Kuiper Airborne Observatory. He was a regular flyer on that plane, also based at Ames Research Center, and that's where he first noticed that his IR radiometer was able to forecast upcoming CAT. It was extremely kind of him to encourage me to join him on the same plane, since we would be "competing" in some sense for predicting CAT.
RFD built an entirely new instrument for use on the C-141 KAO airplane, based on functional designs we worked out together. The window for the C-141 had the shape of the wheel well front surface, because that's where it was mounted. The microwave radome, or window, was a long strip of high density polyethelene, with anti-reflection grooves on both sides (designed for me by xxx, who later died in the tragic PSA crash over San Diego). The C-141 flights were from 1981 to 1984. They were funded by NASA for the purpose of following up on the promising CAT predictive ability shown by the MTP on the CV-990 flights. These data showed that not only did most CAT occur near the tropopause, but most of the rest of it occurred in the presence of inversion layers, as suggested by the CV-990 SCAMS MTP results. You can see a report of the C-141 MTP CAT studies at KAO CAT Results.
. .....
.....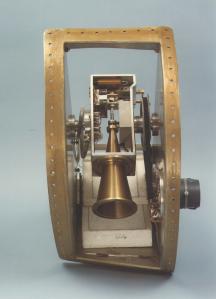
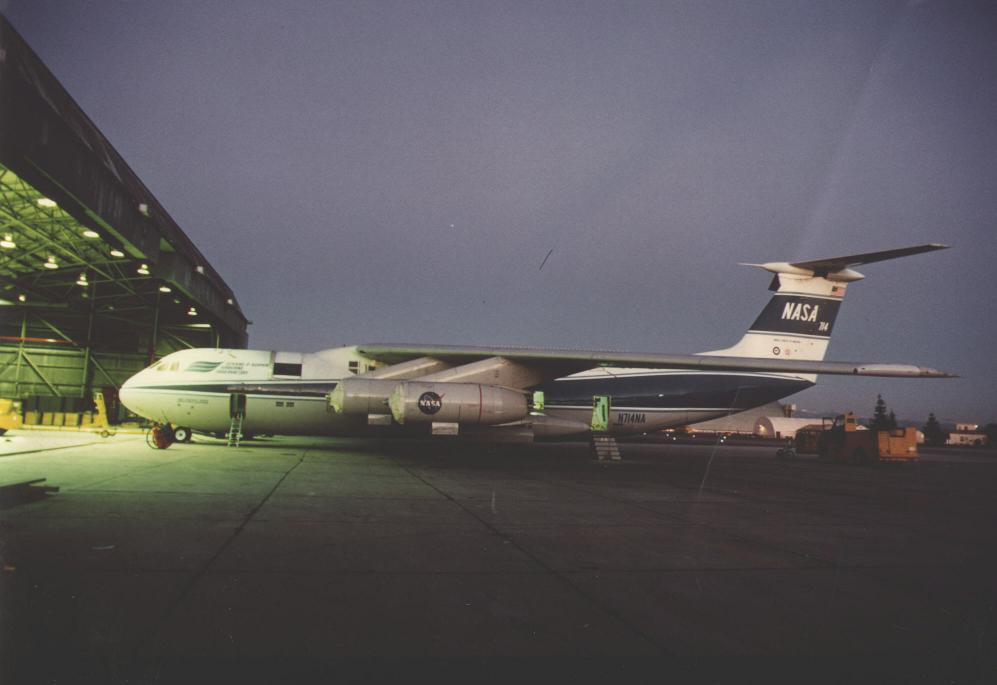
Figure 5. C-141, "Kuiper Airborne Observatory" Figure 6. MTP/C141
As the C-141 MTP was flying Dr. Ed Danielsen learned that I was demonstrating the ability of measuring altitude temperature profiles from an airplane, so he invited me to take an interest in a project he was heading up, called STEP (Stratosphere-Troposphere Exchange Project). I was asked to give a talk to a few of the Ames people already associated with STEP, plus someone from NASA HQ, and since I was falling in love with a woman at that time I gave what must have been a very impressive talk. Bob Watson was the person from NASA HQ, and he commented to someone that he was willing to take a chance on me because he liked my positive attitude. I was funded to build an MTP for the NASA ER-2 that was slated for use by STEP a couple years later.
 .....
.....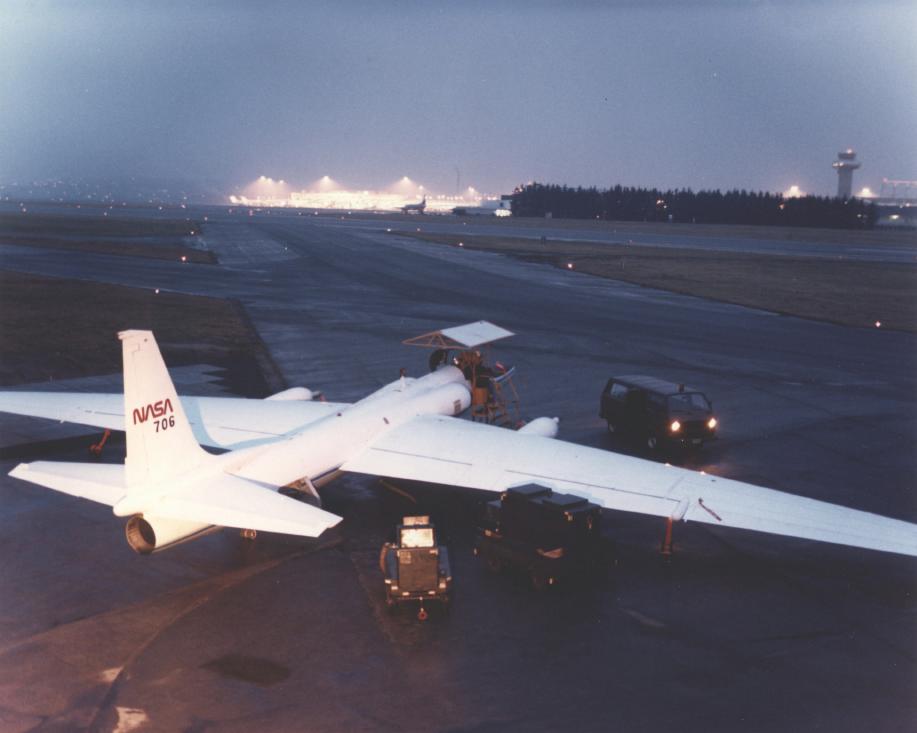
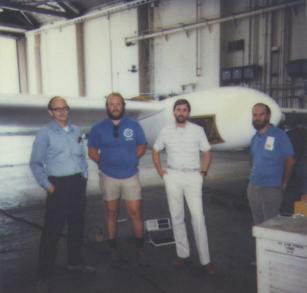
Figure 7 (Left). This is the team that designed, built and installed the MTP/ER2, which took it's first test flight June 11, 1985.
Figure 8 (Right). ER-2 in Stavanger, Norway, during 1989 AASE mission.
One year before the STEP mission Joe Farman published his findings that the ozone in the stratosphere over Antarctica was decreasing drastically every October. Six months before STEP Bob Watson was authorized to fly the same STEP payload, plus a couple crucuial additional instruments, into the ozone hole at the very next opportunity - which was 6 months after STEP. This turnaround time betweeen field missions, of six months, was a challenge. STEP was flying many new instruments (with MTP being one of them), and to go from Darwin, Australia to Punta Arenas, Chile (in the middle of their winter) was asking a lot from the experiment team. But the calling was compelling! Danielsen had assembled for the first time a large set of airborne instruments that produced data within 6 hours of landing, and this capability would be an important asset in planning the next day's flight during an ozone hole deployment. By coincidence, most of the STEP instruments had roles to play in an ozone hole mission. Two instruments measured in situ ozone (the gas that was being destroyed by some unknown process), one instrument measured in situ water vapor (which turned out to have important results), other intruments measured aerosol particles (crucial in characterizing PSC clouds), the MTP could measure lapse rate (thought useful to identifying the vortex edge), but one key instrument was needed that did not exist for STEP: that was an instrument to measure chlorine monoxide, ClO. Harvard promised to build this missing instrument in under a year, which would require a heroic effort.
The ozone hole mission took place as planned, during August and September, 1987. It was called AAOE, or Airborne Antarctic Ozone Experiment. The world's press was there, trying to mingle with the experiemnters in hopes of overhearing preliminary findings. The project conducted guarded meetings wehre experimenters could report their results. Anybody who was there knows the drama of those two months. It must be the highlight of many professional careers! I have vivid memories of it, and you can read a letter I wrote back home from Punta Arenas at Chilean Flights.
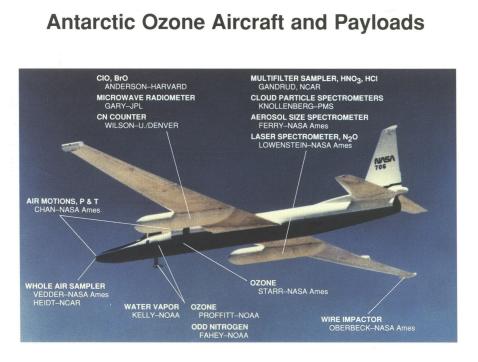
Figure 9. Layout of instruments on the ER-2 for AAOE.
The original role for MTP was to measure lapse rate versus latitude, which in theory could be combined with zonal wind versus latitude to calculate potential vorticity, PV, versus latitude. The vortex edge would then be determined by noting the latitude having the greatest PV gradient with latitude. However, the winds had more mesoscale structure than expected and PV calculations were found to be less useful for this purpose than simply noting the latitude of maximum wiond speed. This rendered the the MTP's lapse rate information unecessary for mission objectives.
MTP's main contribution for AAOE turned out to be different from the expected one. I analyzed MTP data in a new way so as to show the altitude of isentrope surfaces versus flight time. These plots showed the existence of immense mountain waves over the Antarctic Peninsula. This proved that the underlying mountains, aligned north-south for optimal creation of waves in air that is moving west to east, were causing the air in the stratosphere to undergo large temperature excursions as they udnerwent large altitude excursions. Before this, it had been thoguht that any mountain waves would not be able to penetrate the tropopause, normally at about 9 or 10 km altitude. MTP showed that mountain waves were not only present, but esseintially ever-present, and had large amplitudes, as can be seen in First Mountain Wave Encounter and Observational Results... The discovery of mountain waves is important because they provide a mechanism for dehydrating and denitrifying the Antarctic vortex, and these processes are an essential precondition for a chemical process in which chlorine atoms convert ozone to oxygen molecules. To be convinced of that, click on SAGE II.
The second NASA airborne mission for the study of stratospheric ozone depletion was based in Stavanger, Norway in 1989, and was called AASE (Airborne Arctic Stratospheric Experiment). There was no explicit role identified for MTP ahead of the mission, but it was expected that I would measure mountain waves. I did this, and showed that they occurred over land and not over the ocean (except downiwnd of Iceland on one occasion). But the main MTP finding from this mission was again a serendipitous result: there is an ever-present vertical displacement of air parcels from their synoptic-scale slow vertical motion. This new component of vertical motion is "mesoscale," since horizontal wavelengths were shorter than 500 km. When the mesoscale component of vertical motions is superimposed upon the synoptic scale motion, air parcels are found to have quite different temperature histories than had been modeled before this mission. Cooling rates (actually cooling and heating rates) turn out to be 100's of K per day for tens of minutes instead of the 1 or 2 K/day that the synoptic scale models called for. This was potentially upsetting, since it was not known if these extremely high temperature fluctuations would have unanticipated effects upon the formation of polar stratospheric clouds, for example. Calculations in the field (during the deployment) indicated that the effects might be small, but others thought the up and down motions might cause a melting and refreezing that could produce aerosols with special surface coatings that would affect the process of denitrification.
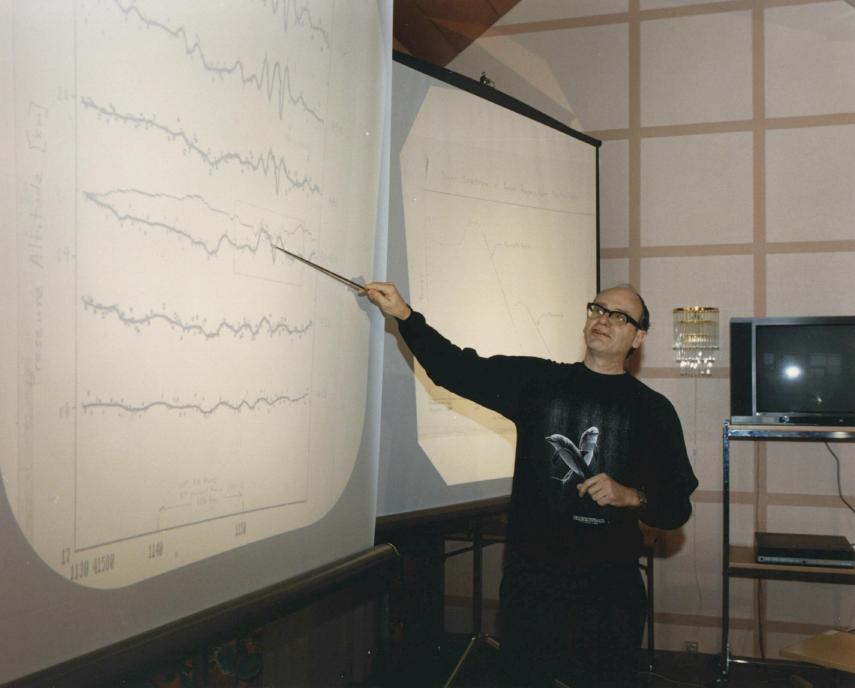
Figure 10. Bruce trying to convince the AASE team in Norway that isentropes are wrinkled, causing air parcels to experience temperature fluctuations.
Another concern created by the presence of temperature fluctuations has to do with the highly non-linear dependence of chemical reactions and solubility upon temperature. Since the time-average reaction rate (or solubility) will not equal the reactionrate (or solubility) at the time-average temperature, modelers should not use mere synoptic scale temperature fields for their calculations, but should superimpsoe some form of mesoscale fluctuation upon the synoptic scale temperature history in order to obtain an accurate calculation of long-term chemical reactions (and effects related to solubility). Additional theoretical work on this matter should be conducted.
MTP/DC8 and the Third Ozone Hole Mission
AASE II was conducted in 1991 and 1992. We finally had funding to build an MTP for NASA's DC-8 aircraft. The MTP/DC8 had a "rocky start" due to a component that did not perform well under the cold conditions at its location in the instrument, so much of that mission's data required a hand "editing out" of bad data cycles. Nevertheless, the MTP/DC8 provided dramatic demonstration of its ability to remotely sense the altitude of the tropopause. This could not have been done using the MTP/ER2 since the ER-2 always flew well above the tropopause (and passed through it on ascents and descents rapidly). Since the MTP/DC8 was a 3-frequency radiometer instead of 2-ferquency (like the MTP/ER2), it provided a greater altitude coverage than the MTP/ER2. The MTP/DC8 had better frequency stability since it used frequency synthesizer (with a multiplier) instead of Gunn diode oscillators (which have temperature dependent frequency outputs). Overall, the MTP/DC8 was a far superior instrument, and today remains the best MTP ever built, in my opinion (kudos for Richard Denning, who built this instrument).
 .....
.....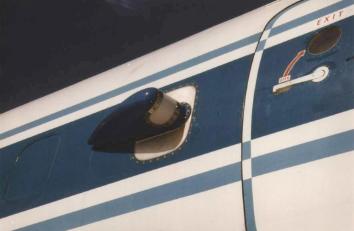
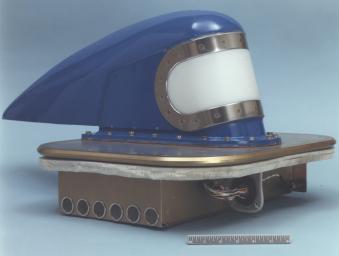
Figure 11. MTP/DC8 before installation, 1991.
Figure 12. MTP/DC8 mounted on window plate in DC-8.
I will not continue to provide a mission-by-mssion story of the MTPs, since this web page is intended to provide an early history. By the time of the MTP/DC8 instrument, MTPs had "arrived" - and other experimenters began to expect that an MTP would be included on all future stratospheric atmospheric research missions. They had not yet been included on tropospheric missions, which were conducted by another branch at NASA HQ. The inclusion of MTPs on tropospheric studies began in March, 1999, when the MTP/DC8 was funded to participate in the PEM Tropics B Mission.
The remainder of this section is a simple listing of the missions that have included an MTP, beginning with the first.
CAT Mission, 1978/79
A SCAMS MTP (called the TSR at that time) was flown on the CV-990 during the CAT mission.
C-141
A special MTP (called AMR, for Airborne Microwave Radiometer) flew on NASA's C-141 Kuiper Airborne Observatory from 1981 to 1984. The purpose of these flights was to conduct CAT studies as a piggy-back instrument during night time astronomical observing flights in the Western US.
STEP, 1987
The newly-built MTP/ER2 was installed in the ER-2 in 1986 and flew many test flights before the STEP deployment. STEP was based in Darwin, Australia during January and February, 1987.
AAOE, 1987
The MTP/ER2 was included in the first NASA-led airborne Antarctic "ozone hole" mission, called AASE (Airborne Antarctic Ozone Experiment), which was based in Punta Arenas, Chile in August and September, 1987.
AASE, 1989
The MTP/ER2 was again used on a NASA ER-2 aircraft during the AASE (Airborne Arctic Stratospheric Experiment), based in Stavanger, Norway in January and February,1989.
AASE II, 1991/92
By this mission we had two MTP instruments, the MTP/ER2 again but also a MTP/DC8 mounted in the lower altitude NASA DC-8 aircraft. AASE II was based in Bangor, Maine and Stavanger, Norway. Deployemnts consisted of several deployments during August, 1991 and march, 1992.
ASHOE, 1994
ASHOE (Airborne Southern Hemisphere Ozone Experiment) was based at Ames Research Center, CA; Barber's Point, Hawaii and Christchurch, New Zealand. Again, several deployments occurred between March and November, 1994.
STRAT, 1995/96
STRAT (Stratospheric Tracers of Atmospheric Transport) was based at Ames Research Center, CA and Barber's Point, Hawaii. Several deployemnts were made between May, 1995 and December, 1996. Only the MTP/ER2 participated in this mission.
TOTE/VOTE, 1995/96
TOTE/VOTE (Tropical Ozone Transport Experiment, Vortex Ozone Transport Experiment) was based at Ames Research Center, CA; Fairbanks, AK; Barber's Poin, Hawaii and Reykjavik, Iceland. Deployments occurred from December, 1995 to February, 1996. Only the MTP/DC8 participated in theis mission.
POLARIS, 1997
POLARIS (Photochemistry of Ozone Loss in the Arctic Region in Summer) was based at Fairbanks, AK and Barber's Point, Hawaii. The MTP/ER2 participated in deployments from April to September, 1997.
SONEX, 1997
SONEX (SASS Ozone and Nitrogen Oxides Experiment) was a DC-8 mission based at Ames Research Cener, CA; Bangor, Maine; Shannon, Ireland and Lajes, Azores. Flights occurred in October and November, 1997.
WAM, 1998
The MTP/ER2 was installed in a WB-57F aircraft, based at Ellington Field, Houston, TX. It flew several flights in 1998 for the WAM (Wb57 Aerosol Mission).
ACCENT I, 1999
The same MTP/ER2 was flown inthe WB-57F for the ACCENT I (Atmospheric Chemistry of Combustion Emissions Near the Tropopause) during 1999.
SOLVE, 1999/2000
SOLVE (SAGE III Ozone Loss and validation Experiment) included both the MTP/DC8 and MTP/ER2. Deployments went from November, 1999 to March, 2000 for the DC-8 and January to March, 2000 for the ER-2.
ACCENT II, 2000
Currently in progress, the same MTP/ER2 is flying in the WB-57F based
in Houston, TX.
The people most responsible for the 23-year MTP program are (in chronological order of association):
Bruce L. Gary, Principal Investigator from
inception of the program in 1977 to my partial retirement in 1998.
Gary Reisdorf, an exemplar of management,
who helped me market the MTP idea to NASA HQ.
Richard F. Denning, (RFD), senior engineer
throughout this period, and to the present.
Noboru Yamane, group supervisor during most
of those years, all-around advisor, and field support.
Gary Parks, chief designer of the MTP/ER2,
with input from RFD and BLG.
Steve Guidero, electronics technician, who
worked under RFD's direction during the MTP/ER2 construction.
Walter K Proniewicz, mechanical engineer,
who worked under RFD's direction for several MTP constructions.
Richard M. Wetzel, electronics technician
who worked under RFD's direction during several MTP constructions.
Steven J. Walter, Alan B. Tanner and Thomas
Osborne, field deployment observing support.
Ray Swindlehurst, mechanical engineer, who
worked with RFD during the construction of several MTP units.
Dr. Michael J. Mahoney, current Principal
Investigator - the new "Mr MTP."
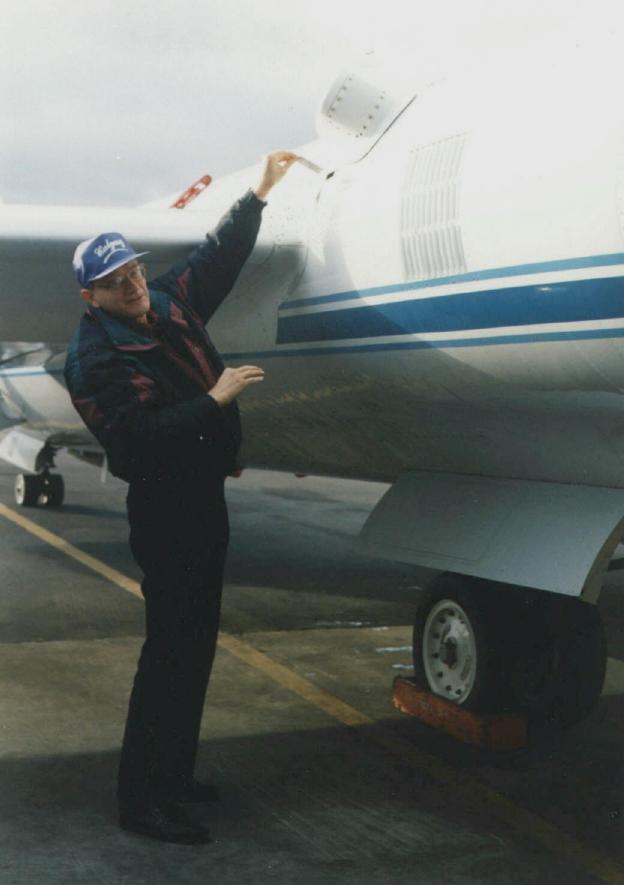
Figure 13. Getting the data after a flight based in Christchurch, New Zealand: I probably told Denning (who took the picture) "This data card feels heavier; I think we must have gotten data!"
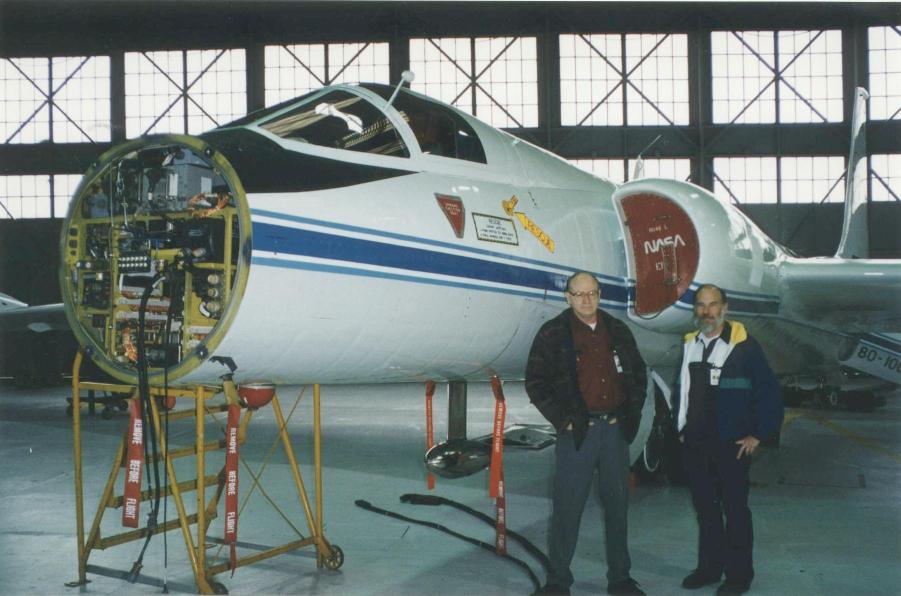
Figure 14. Bruce and Richard, the two people most responsible for making MTPs a reality.
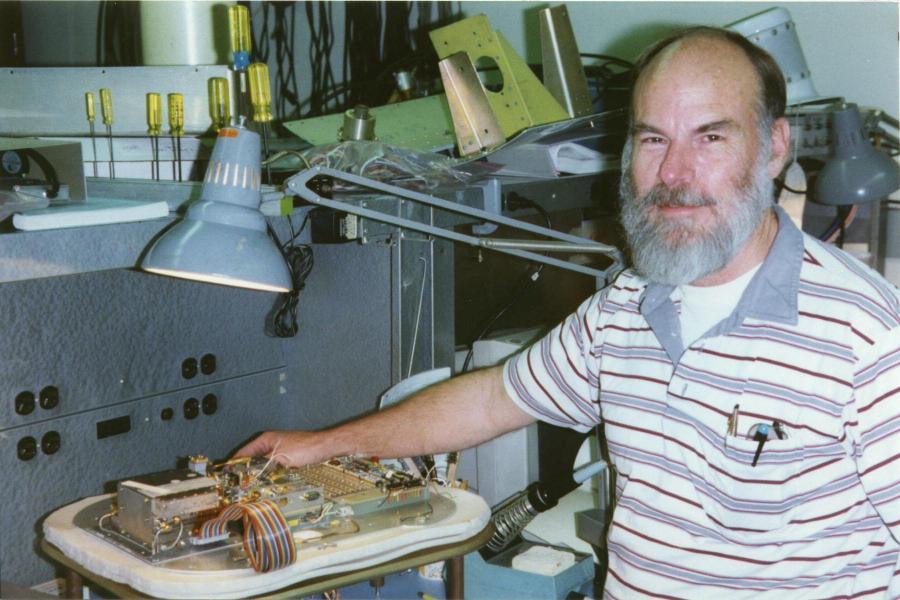
Figure 15. Richard Denning, MTP's Senior Engineer, built ALL the MTP instruments during the past 23 years!
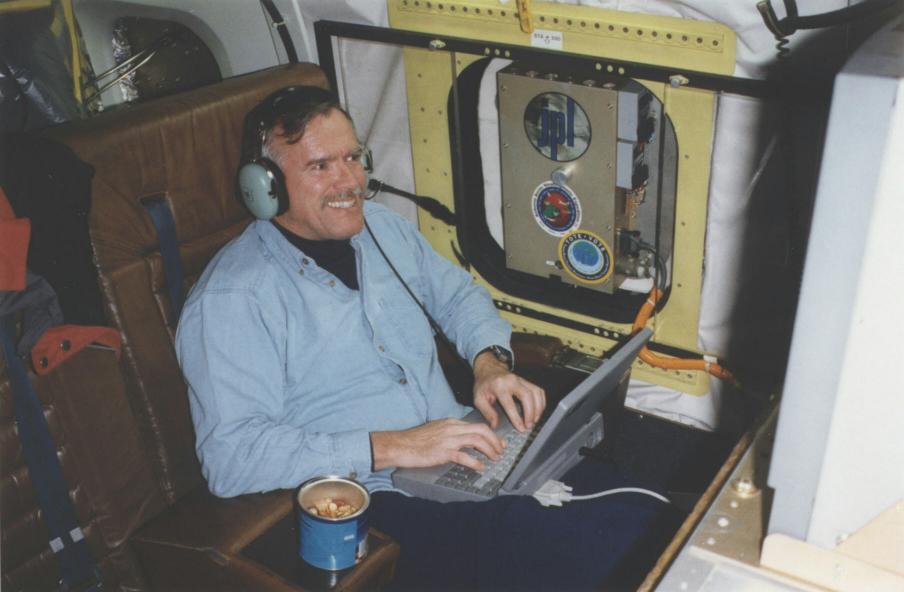
Figure 16. Dr. Michael J. Mahoney, the new "Mr MTP", took charge of the MTP projects when I retired in 1998.
Concluding Comment
The MTP series of instruments have participated in 15 missions during the past 23 years. Progress is still being made in MTP hardware and data analysis algorithms. I had no idea in 1977 that sketches, first started on a commercial flight for a Christmas vacation to Mexico City, would lead to this. I'm glad it did!
This site opened: September 9, 2000. Last Update: February 25, 2002