JUMPING TROPOPAUSES
Bruce L. Gary
Introduction
The term "tropopause" carries with it a sense of definitiveness, as if once you've determined the altitude of "the tropopause" you've got the one and only tropopause. The official definition is based on the temperature field ("the lowest altitude for which the lapse rate..."). However, there are times when the "temperature field tropopause" is misleading. Misleading in the sense that the tropopause derived this way does not mark the boundary between air that has recently resided in the lower altitude troposphere versus air that last saw the troposphere before passing upward through the tropical tropopause and slowly migrated poleward and downward. Tracers are the best way to ultimately determine which type of air one is dealing with, but since tracers (ozone is most often used) are not easily measured and temperature IS routinely measured, the temperature field definition is most often the most feasible definition.
Occasionally both the tracer field and temperature field are measured simultaneously, and these data provide an opportunity to check the reliability of the temperature field tropopause definition. Invariably, agreement is found between the two tropopauses. But occasionally, there is a disagreement. The most common disagreement occurs at the sub-tropical jet, where the temperature field shows a double tropopause for several degrees of latitude whereas the tracer field tropopause is a smoothly sloped surface that begins its upward slope (while moving toward the equator) at the equator-most edge of the double tropopause latitude region (see Mesoscale Temperature Fluctuations, Figure 7, for an illustration of this). Another situation when the two tropopauses can disagree is above an active mountain wave. That is the subject of this web page.
MTP/DC8 FLight Showing Jumping Tropopauses
During the 1996 SUCCESS mission (SUbsonic aircraft Contrail and Cloud Effects Special Study) the DC8 flew over the Rocky Mountains during an active mountain wave condition. The following figure shows the altitudes of isentrope surfaces and the tropopause altitude, based on the temperature field definition.
Figure 1. Isentrope altitude cross-section, showing mountain waves over the Rocky Mountians. Underlying ground topography is shown by the trace at the bottom. The red symbols mark tropopause location.
The DC8 flew westward from Kansas to California on May 10, 1996. Isentrope surfaces are shown beginning at a potential temperature of 320 K (bottom), and increase in 2K steps to 366 K (top). Topography is shown by the brown profile at the bottom, which goes from the Utah/Colorado border on the left to the Colorado/Nebraska border on the right (at latitude 38.4 degrees North). Normally, isentropes are quite flat, departing less than 100 meters from synoptic scale average values; however, on this date, strong winds from the west created a "mountain wave" pattern of vertical distortions. Layers thicken and thin, sometimes "out of phase" at different altitudes. This is typical of mountain waves, but is rarely documented as well as in this figure. The tropopause, as determined from the temperature field, is displayed with small red diamonds. Due to a vertical stretching of the 600 meter layer immediately above the undisturbed tropopause level, there are four tropopause "jumps" of up to 600 meters at four locations. Evidence suggests that the "tracer tropopause," at 333.5 K, did not jump upward, so the four thermal tropopause anomalies represent "false tropopauses." The DC8 altitude was 11.3 km for the entire period shown.
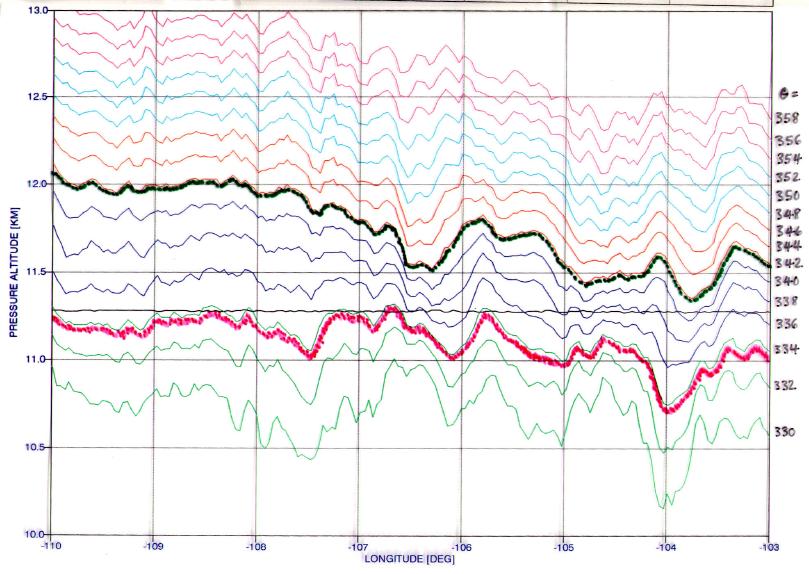
Figure 2. Zoom of the above isentrope altitude cross-section, showing more detail revealing the distroting effect of the underlying mountains. The red line corresponds to the 333.5 K isentrope surface, which the tracer analysis indicates is the true tropopause. The aircraft flew a constant 11.28 km that was at all times above the tracer tropopause, but just barely at three times.
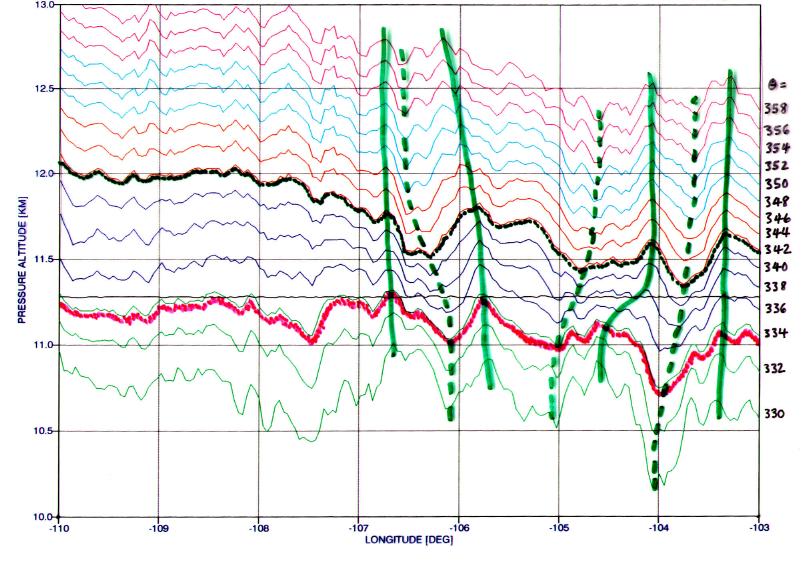
Figure 3. Same isentrope altitude cross-section, showing sloped and contorted "phase lines". The red line is the "tracer tropopause."
This figure is presented here to show the "phase line" phenomenon that theoretical meteorologists use to understand the dynamics causing mountain waves. The solid green lines trace the locus of high altitude displacement of isentrope surfaces, while the dashed lines trace the locus of downward displacements. The fact that the lines are usually not exactly vertical, but are sloped, has meaning and is caused by features of the wind field.
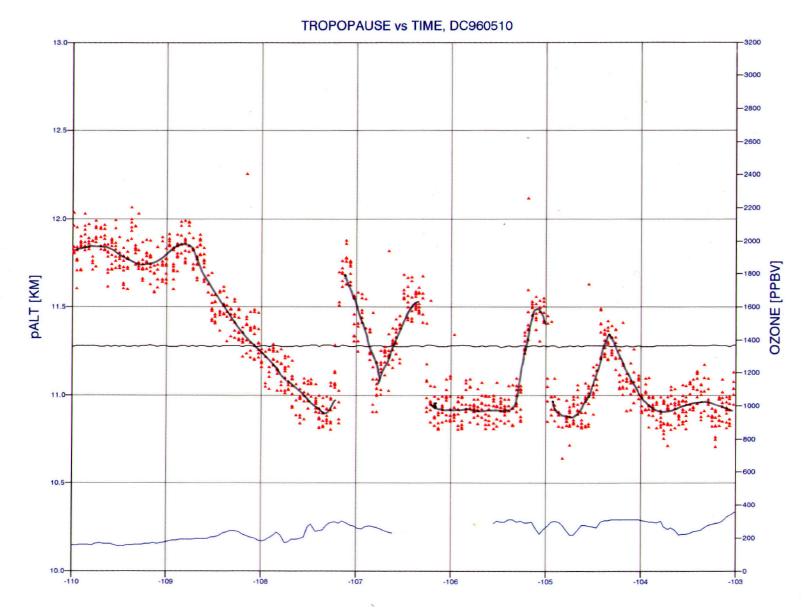
Figure 4. Detail showing just the tropopause altitudes. The ozone mixing ratio is shown by the blue trace near the bottom. Aircraft flgiht altitude is a constantn 11.28 km
This figure shows that ozone at flight level did not change from its "low stratosphere" value of 250 [ppbv], implying that the tropopause jumps that go from below to above flight altitude are misleading.
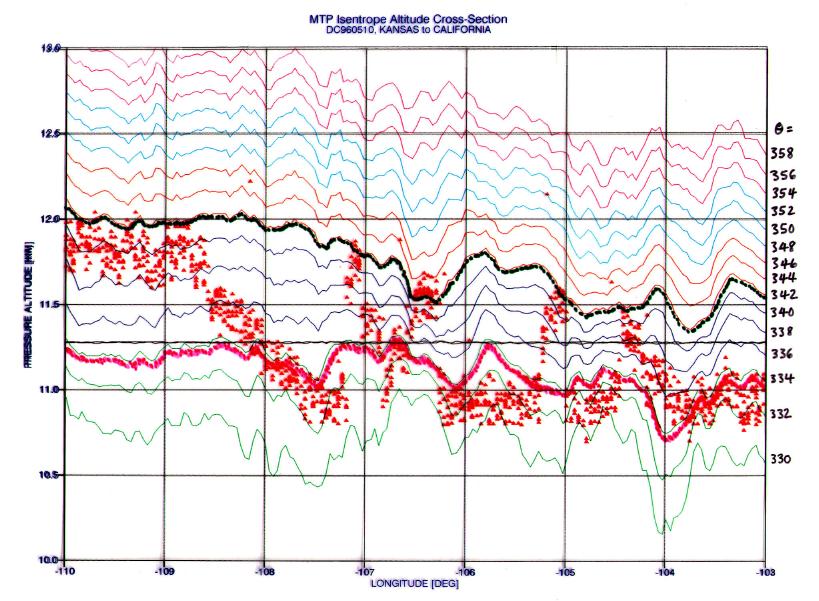
Figure 5. Same isentrope altitude cross-section, with superimposed plot of tropopause altitude locations. The red line is the "tracer tropopause" and the red symbols are the temperature field tropopause.
In this figure the DC-8 flew at an altitude that was perfectly situated for measuring and understanding the differences between the tracer tropopause and temperature field tropopause. The difference in altitude between the red trace and the red symbols is the "error" of the temperature field tropopause caused by the mountain wave distortions of the temperature field. The errors are typically 300 meters, but get as large as 600 meters.
Closing Comment
I first noticed this "jumping tropopause" behavior during a DC-8 flight over the Pacific Ocean, off the California coast. On that occasion a jet stream was creating wave disturbances, which produced the same "jumping" effect. The magnitude of the jumping, a few hundred meters, was similar to the mountain wave case shown here. Although jumping tropopauses can occur over mountains and the ocean, their occurence is rare. With errors of only a few hundred meters, they represent a less serious and less frequent error for tropopause altitudes determined from the temperature field when compared with the discrepancies associated with the sub-tropical jet, which can be many kilometers.
____________________________________________________________________
This site opened: February, 11, 2000. Last Update: February 11, 2000