This web page presents a graph of each
of my XO-1 transit observations. The most recent one is at the top of
the page, so figure numbers start at one from the bottom..
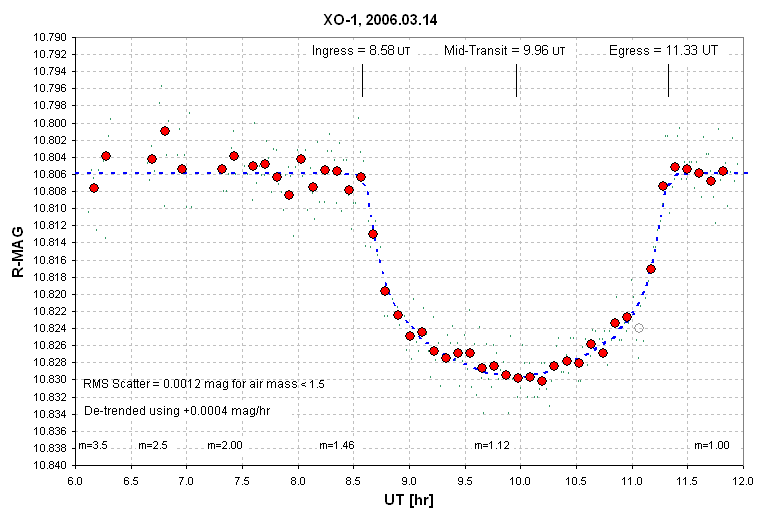
Figure 4. Complete transit observation of 2006.03.14.
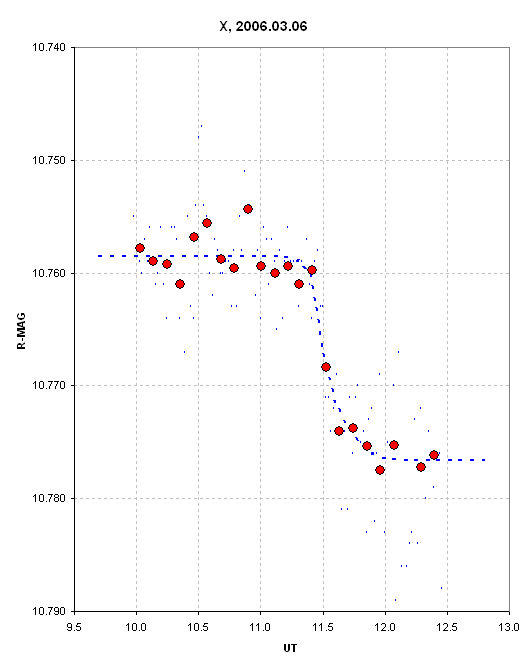
Figure 3. Based on ingress = 2006.03.06, 11:31 +/- 00:04 UT, combined with previous timings, I estimate P = 3.94157 +/- 0.00002 day.
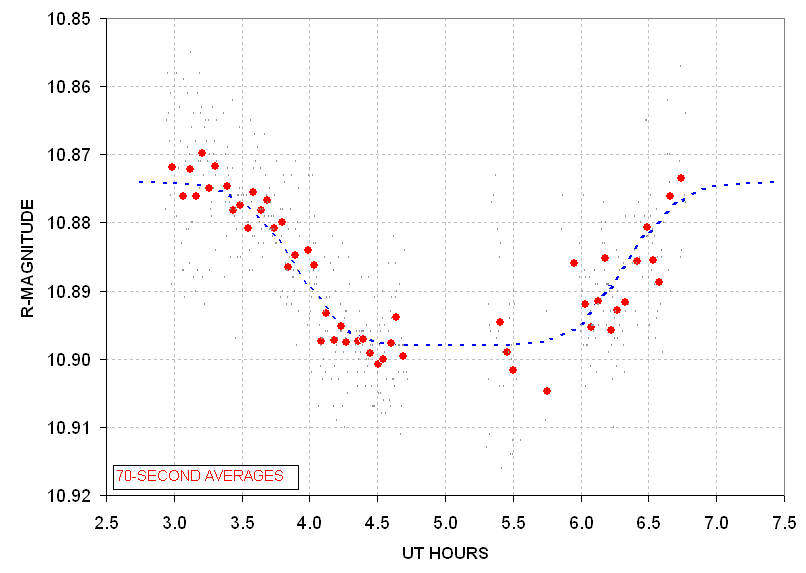
Figure 1. Light curve during event of July 1, 2005 UT. Each read
symbol is a 70-second average. Clouds degraded data after mid-t r a n s i t.
This is my first observation of XO-1. The predicted egress end time for this transit was 5.57 UT. The
observed egress end at 6.75 UT is 1.18 hours later. Mid-ingress occurs
at 2005.07.01, 03:54:10 UT, or JD = 2453552.6626 +/- 0.0030. Mid-egress
occurs at 06:19:37, or JD = 2453552.7636 +/- 0.0038. The mid-transit
time is estimated to be JD = 2453552.7131 +/- 0.0048. The observed depth is 23 +- 3 mmag.
____________________________________________________________________
This site opened: May18, 2006. Last Update: May 18, 2006