Bruce L. Gary; Hereford Arizona Observatory
This web page shows the brightness stability of candidate reference
stars for the XO-1 star field. During a 4-week period in April/May I
observed the region of interest on 20 nights for the purpose of
searching for XO-1 fadings. In the process of
performing this analysis I was able to study the stability of 4 nearby
reference stars. Each reference star appears to exhibit variations of
a few mmag with periods of 1 to 2 months. XO-1 appears to
be stable at the 4 mmag level.
This is a project suited to a single telescope, using the same
telescope configuration, the same analysis software and performed by
the same person. The only thing that was different each observing
session was a new flat field (and sometimes dark frames). I placed the
autoguider at the same pixel location, and the AO-7 tip/tilt image
stabilizer keeps the star field on the main chip at the same pixel
location for the entire observing session with an accuracy of ~2
pixels.
Ensemble photometry was performed with the same 4 reference stars using
the same magnitude assignments, and I used the same photometry aperture
pixel
settings. Extinction changes were monitored on an image-by-image basis,
and those with >1.5% additional extinction (due to clouds) were
rejected. I also used the
same spreadsheet template and rules for rejecting outlier data (>8
mmag). I claim
that this is the kind of project that groups of amateurs could not
perform, that it has to be performed by a single person using a
dedicated facility, and that is not well-suited for professional
observatories due to the large amount of telescope time required.
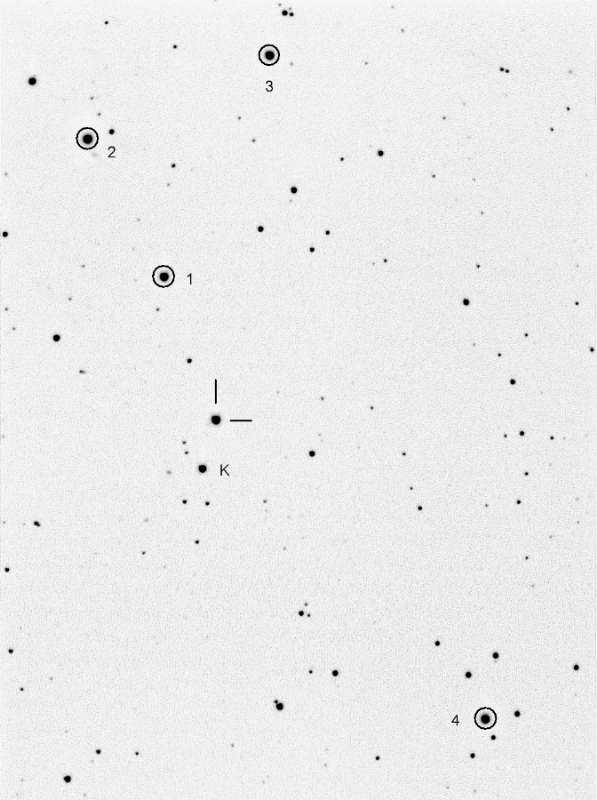
Figure 1. "Finder chart" for XO-1 showing 4
reference stars and one check star. FOV = 14.2 x 19.0 'arc, north up
and east left (crop of original).
Reference star R-mag's are 11.046, 9.261, 10.680 and 10.330. The
check star has R-mag = 12.282 and XO-1 has R-mag =
10.806. These R-mag's are based on all-sky photometry observations in February and March, 2006.
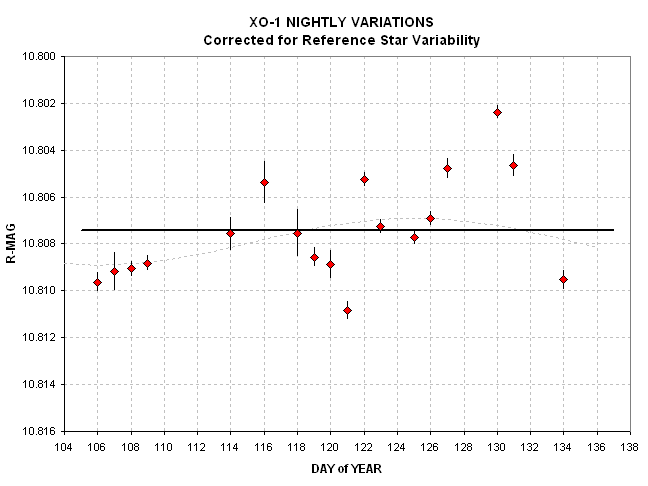
Under the assumption that none of the reference stars is variable
the XO-1 R-magnitude was derived versus date, as shown
below.
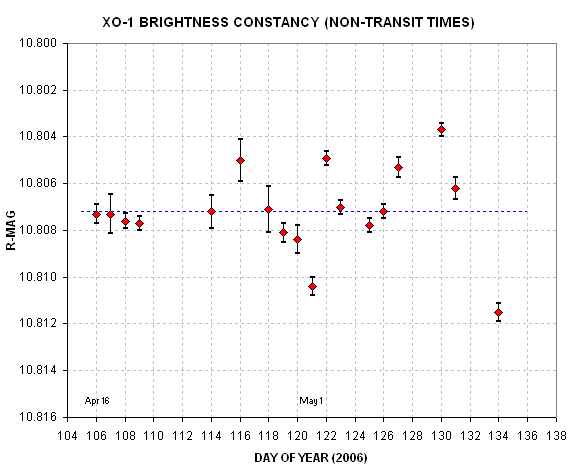
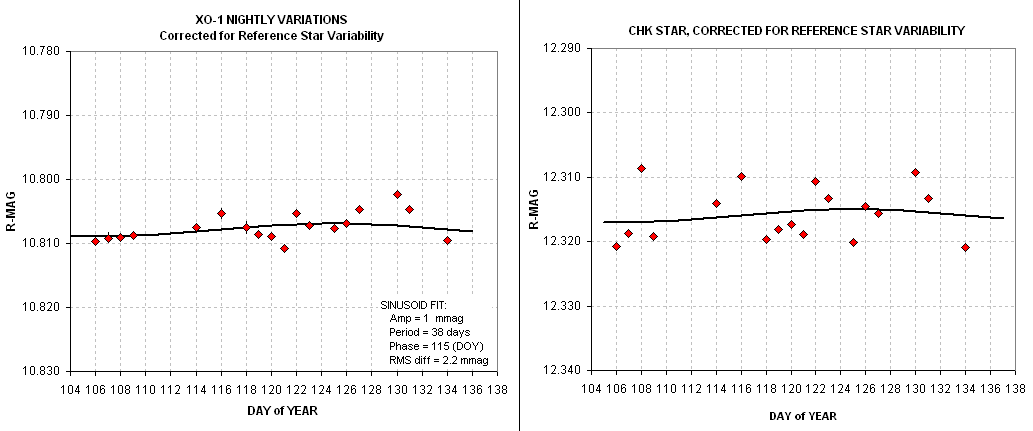
Figure 2. XO-1 R-magnitude for dates 2006.04.16 to
2006.05.14 under the assumption that none of the reference stars was variable.
Throughout this 29-day observing period the star of interest appears to be stable at about the 4
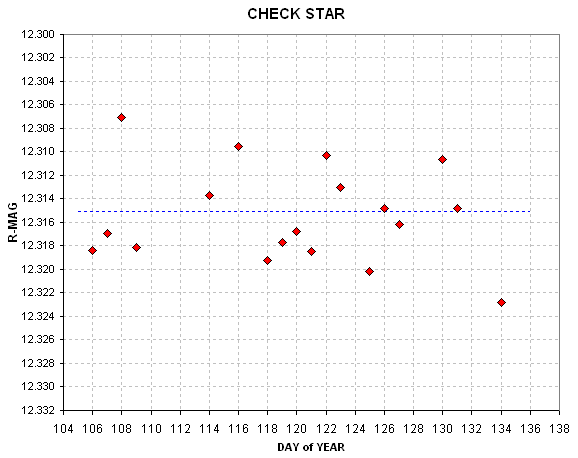
mmag level. As the
following graph shows there are no obvious variations of the nearby check star.
Before showing the graphs of apparent R-mag for the 4 reference
stars let's consider what happens during an ensemble photometry
analysis. The user assigns magnitudes to each star and the photometry
tool adjusts an offset that's applied to all of them so that the
average difference with the user-assigned magnitudes is zero. The
solution text file that's created includes the apparent magnitude for
the unknown object, the magnitude for check stars, and the apparent
magnitudes for all reference stars. Therefore, if one reference star is
a variable the text file will show magnitudes for the reference stars
that are affected by the one variable. For example, if Ref#4 is
variable with amplitude Y then Ref#1, 2 and 3 will vary in the opposite
direction with an amplitude 1/4 of Ref#4's amplitude.
If only one of the 4 references stars is a variable the expected pattern
of their ensemble photometry variations is easy to identify and interpret. When two or more of the
reference stars is variable the solution is not straight forward (for me). In the
present case it appears that all four reference stars are variable at a low level. The
following plots show the apparent ensemble R-magnitudes for a 4-week
period and the model predicted variations using one of many possible
solutions.
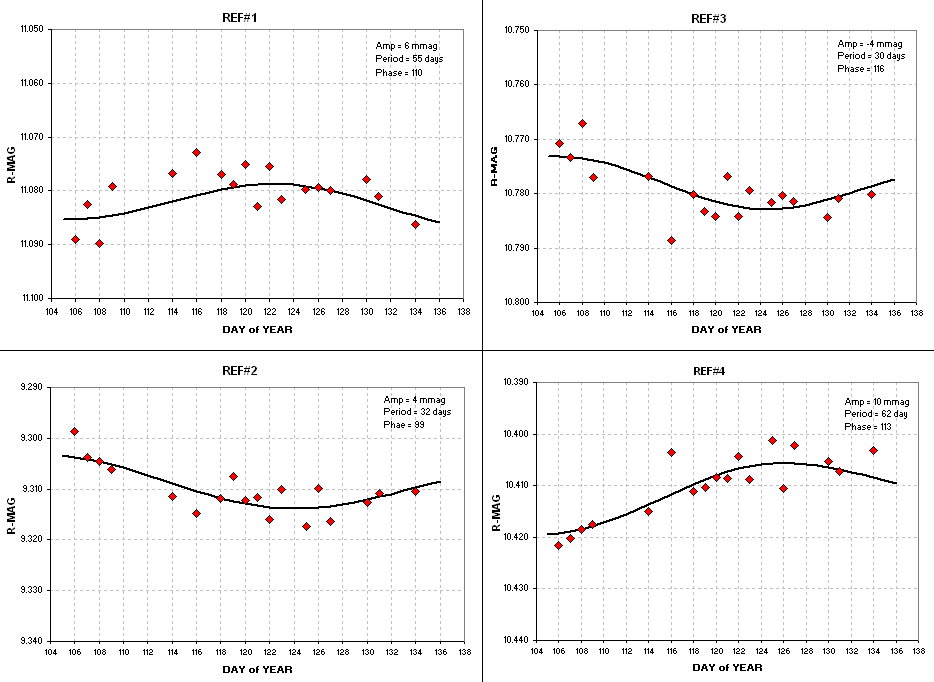
Figure 4. Reference stars R-band brightness versus date
that results from an ensemble photometry solution that forces the
average for each date to be the same. The traces are based on a model
in which periodic variations are assigned to each star in a subjective
manner.
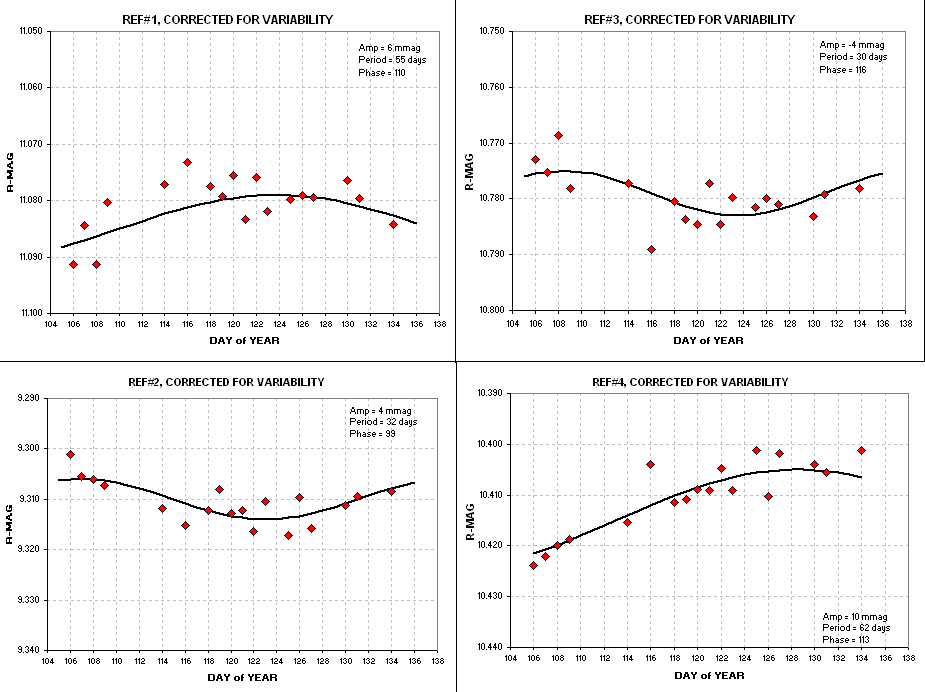
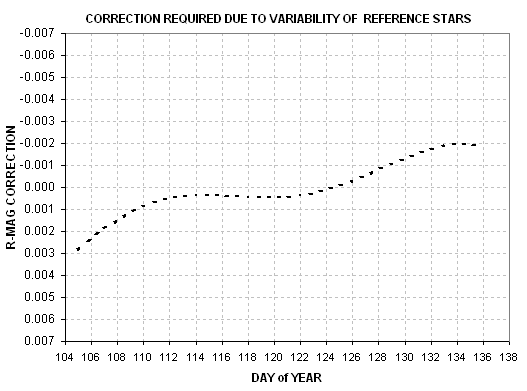
Figure 6. Model-based correction required by the fact that the reference stars are variable.
![]()
____________________________________________________________________
This site opened: April 30, 2006. Last Update: May 15, 2006