DERIVATION OF XO-1b PLANET SIZE
Bruce L. Gary (GBL), Hereford Arizona Observatory (G95)
This web page is my amateur attempt to derive a planet size from an exoplanet transit light curve.
My plan for determining the planet size is to:
1) adopt one (simple) limb darkeing model,
2) calculate transit duration versus center-miss-distance for some approximately-correct planet size,
3) use the measured transit duration to determine a center-miss-distance,
4) calculate transit depth versus center-miss-distance, and
5) adjust the planet size to agree with the measured transit depth.
Next I'll change the limb darkening model and repeat the above. One of
these two limb darkening assumptions will provide a better match to the
observed shape of the transit. This will allow for a crude estimate of
which limb darkening model is correct, and also allow for planet size
uncertainty to be estimated based on limb darkening uncertainty.
I use a spreadsheet with 2810 cells representing the star's solid angle
(I actually use 1/2 this number to represent a half-disk). Each cell is
assigned a "brightness" using the adopted limb darkening model. The
limb darkening model is based on a table in Allen's Astrophysical Quantities (Second Edition), page 170, listing relative solar brightness for a selection of wavelengths and sine(theta) values.
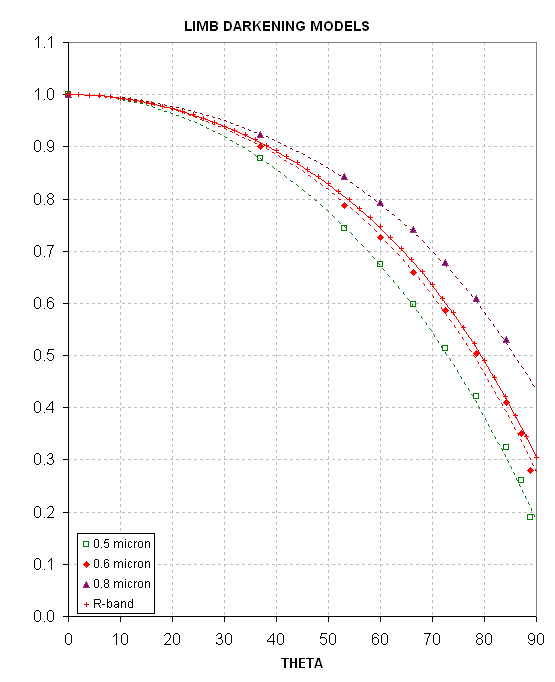
Figure 1. Limb darkening modesl for the sun at 4 wavelengths, including that for a typical R-band filter (0.63 microns).
The following analysis adopts the the R-band limb darkening model depicted in this figure.
My first estimate for the planet's solid angle is to use 61 cells in an
approximately circular pattern. These are "moved" across the star disk
at various row values (corresponding to various center-miss-distances).
The next figure shows the unblocked brightness versus planet location
(star radius units) for several center-miss-distances.
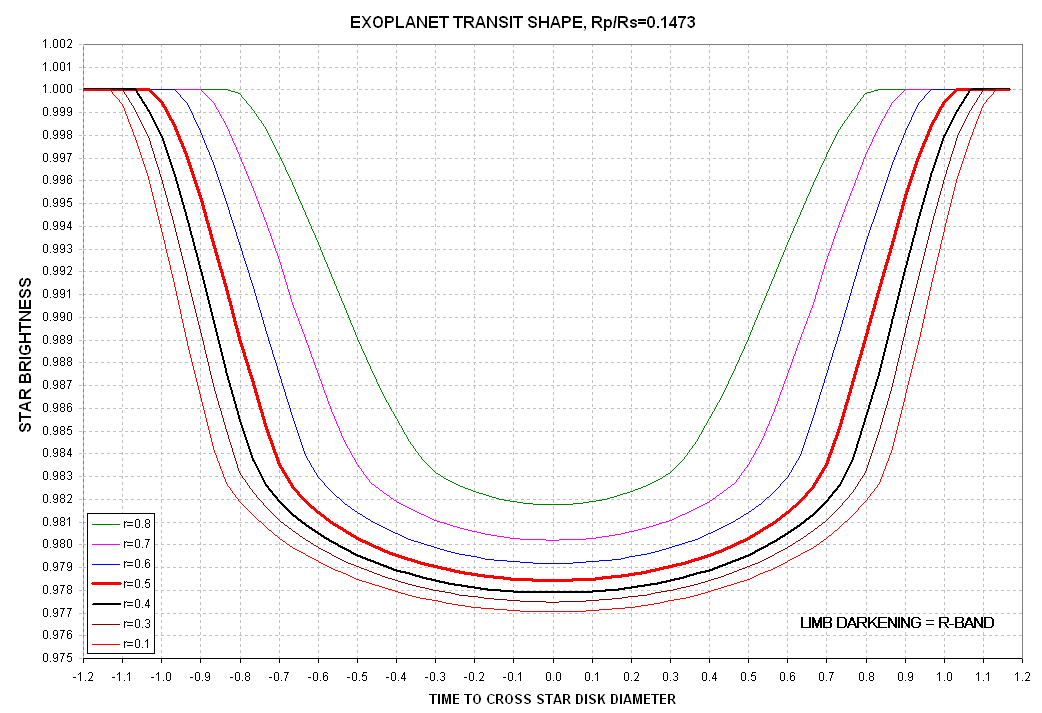
Figure 2. Shape of transits for Rp/Rs = 0.1473 and R-band limb darkening model.
This graph can be read to produce a table of "half depth transit
duration" versus center-miss-distance. This is shown with a model fit
in the next figure.
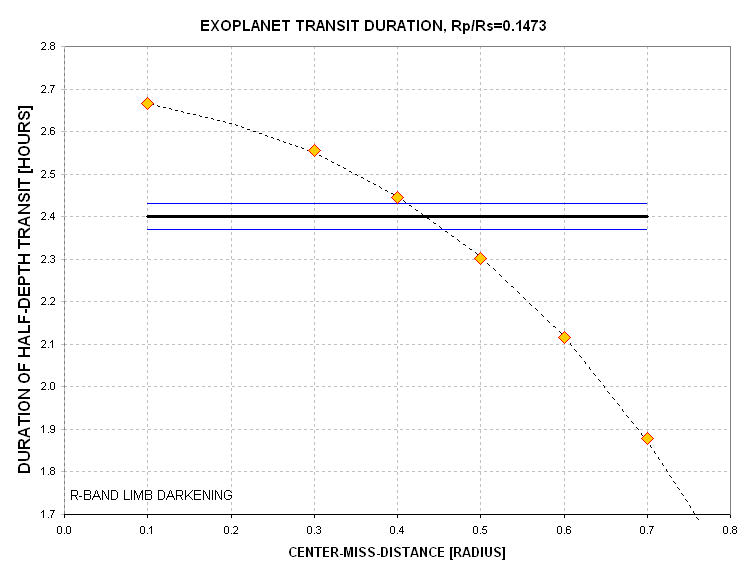
Figure 3. Half-depth duration versus center miss distance for
adopted limb darkening and Rp/Rs = 0.1473 (obtained by measuring
previous graph). The horizontal lines correspond to my 2006.03.14
measurement of the "half-depth transit duration."
Based on this graph I determine that the center-miss-distance is 0.433 +/- 0.022 star radii.
The next figure shows transit depth versus center-miss-distance for the assumed planet size.
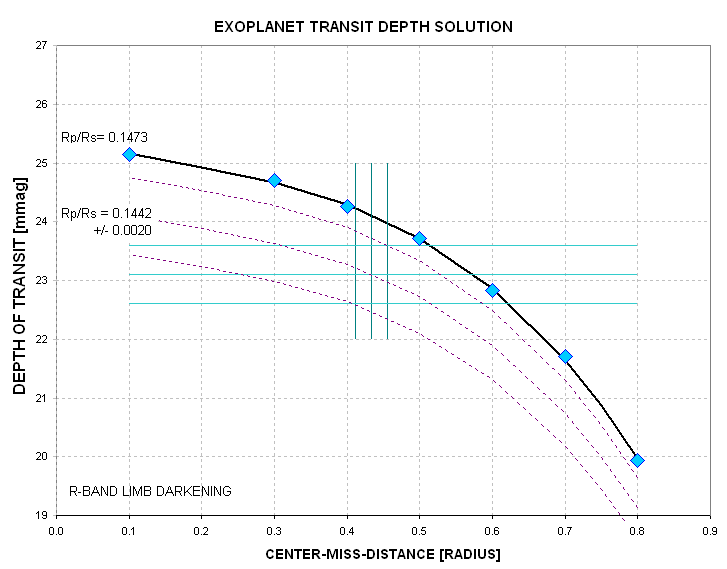
Figure 4. Depth versus center-miss-distance for Rp/Rs = 0.1473 (top curve) and 0.1442 +/- 0.0020 (lower curves).
For a center-miss-distance of 0.433 star radius the transit depth is
~24.1 mmag. We need a smaller planet size to match the observed transit
depth of 23.1 +/- 0.5 mmag. Since solid angle varies as the square-root
of radius, we need to decrease the radius using a factor
sqrt(23.1/24.1) = 0.979. The new planet radius is Rp/Rs = 0.1442 +/-
0.0020.
Note that I'm assuming that if I were to decrease the planet radius by
2% the transit shapes versus center-miss-distance would not change
significantly. This is OK to first-order because the shapes are mostly
determined by miss distance and limb darkening. Therefore, Fig.2 should
not be sensitive to the slightly too-small planet size. And this means
that I can increase planet size to achieve a transit depth match
without having to re-size the spreadsheet cells.
Let's convert Rp/Rs to Rp/Rj. Jupiter has an equatorial radius Re = 6.2
% greater than its polar radius whereas the sun is circular. The radius
corresponding to the same solid angle as Jupiter is sqrt(Re*Rp) =
sqrt(1-0.062) = 0.9685 * Re. Relating this to solar radius units, Rj/Rs
= 0.9685 * 71492 / 695980 = 0.099486. Converting Rp/Rs to Rp/Rj
using this ratio gives Rp/Rj = Rp/Rs * Rs/Rj:
Rp/Rj = 1.45 +/- 0.020
where the SE is subject to an additional increase due to the unjustified adoption of one limb darkening model.
Here's how this model fits my 2006.03.14 observations.
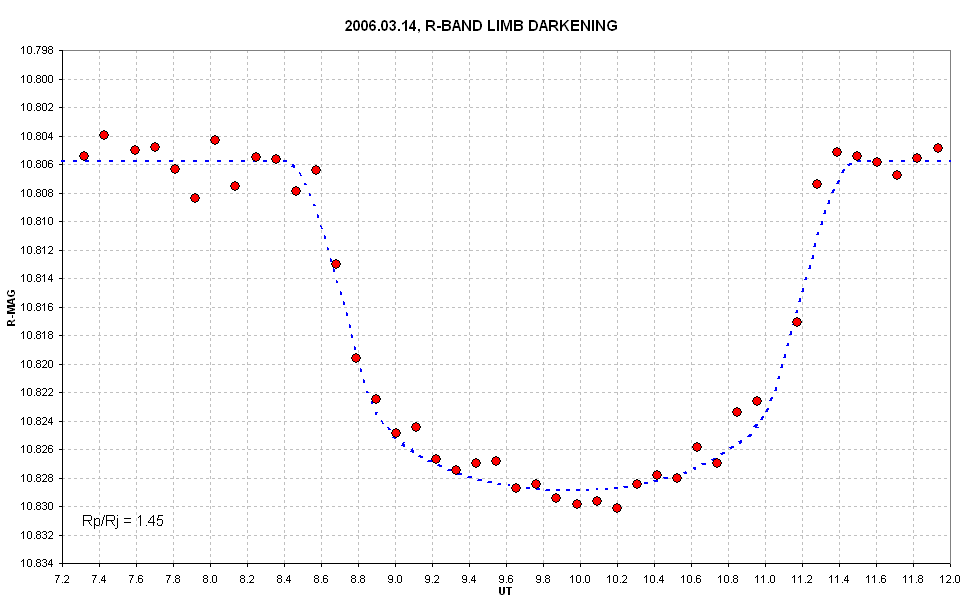
Figure 5. Observed and model fit using Rp/Rj = 1.45 and limb darkening corresponding to R-band.
To assess the sensitivity of the limb darkening assumption the previous
analysis was repeated using I(theta)/I(0) = 1 - 0.60 * (1-cos(theta)),
as shown in the next figure.
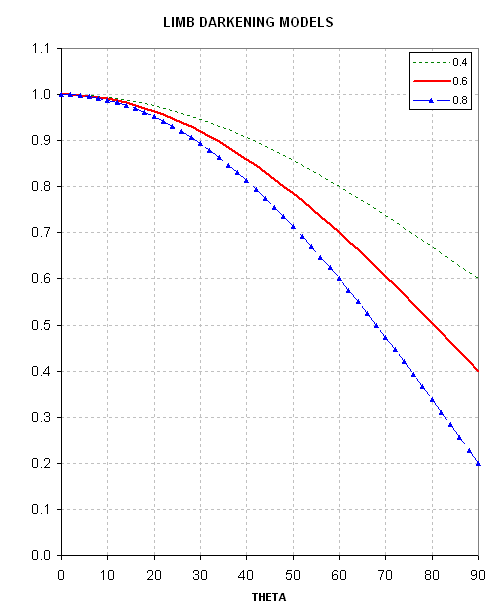
Figure 6. Three simple limb darkening models. The middle one, with constant 0.60, was used to produce the next graph.
The Rp solution was Rp/Rj = 1.44 +/- 0.02, and the model transit light curve is shown in the next figure.
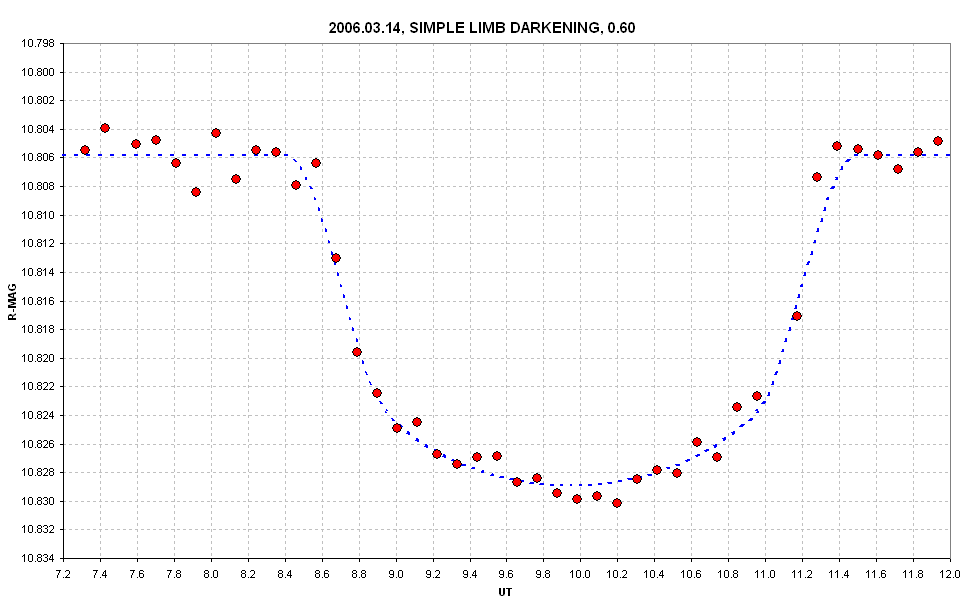
Figure 7. Observed and model fit using Rp/Rj = 1.44 and simple linear limb darkening model with a "1-cos(theta)" coefficient of 0.60.
This is a better-fitting light curve model and it might suggest that
the simpler limb darkening function is a better approximation to that for
the star XO-1a.
____________________________________________________________________
This site opened: March 28,
2006. Last Update: March 29,
2006