Update History
Jan 28:
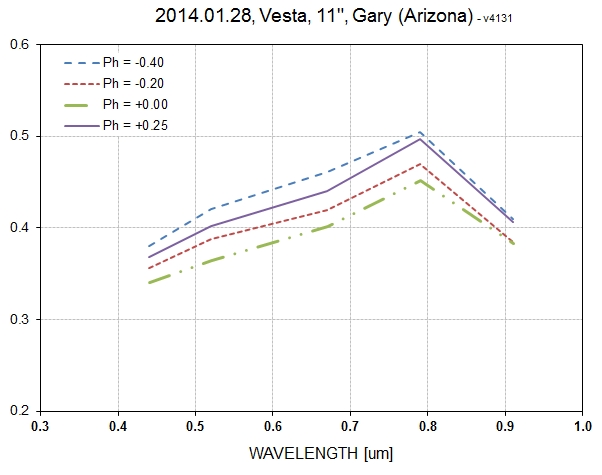
Added Bg'r'i'z' (4.2-hr rotation LCs) for
purpose of evaluating feasibility of deriving SED vs. rotation
phase
Links Internal to This Web Page
Introduction
Summary of
Observations
Thoughts
Light Curves
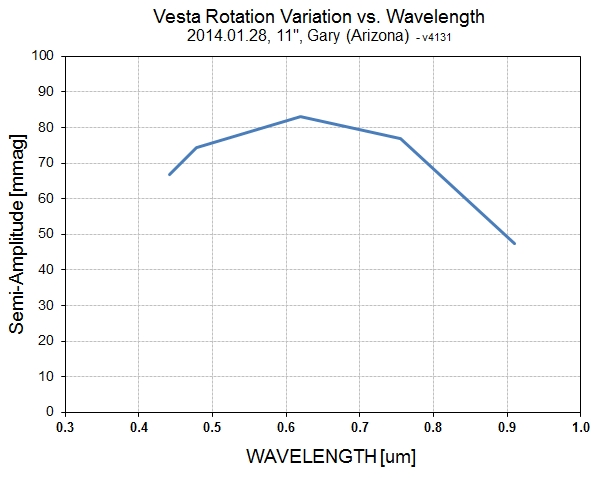
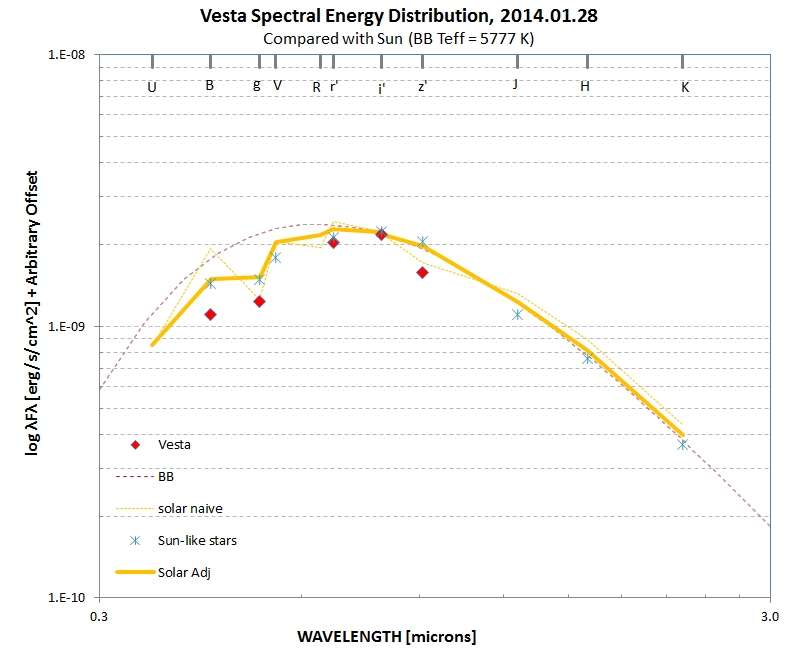
This web page will document multi-band rotation LCs of Vesta. The
goal is to evaluate the spectral energy distribution (SED) as a
function of rotation phase.
The following is a summary of observations. Key: C11 = Celestron
11-inch, M14H = Meade 14-inch with Hyperstar.
2014.01.28
4.2 hrs
C11 Bg'r'i'z' feasibility
observations
This project appears to be feasible, even with my Celestron
11-inch (C11) telescope. It is already obvious that the Meade
14-inch with a Hyperstar (M14H) should be significantly better.
This is due to its larger FOV, allowing for more stars with a
brightness comparable to Vesta to be used for photometry
calibration. The C11 feasibility observations had only one star
that was within 0.5 mag of the same brightness as Vesta, all the
others were much fainter, which meant that Poisson noise from the
reference stars dominated precision. M14H has a FOV 4.8 times
larger, so it will have a greater probability of including
suitably bright stars for reference. Another source of uncertainty
is scintillation since exposure times for filters Bg'r'i'z' were
2, 1, 2, 5 and 15 seconds (to prevent Vesta from saturating the
CCD), and this meant that scintillation noise was large. Thermal
noise was always so small as to be irrelevant (i.e., there was no
need for additional CCD cooling).
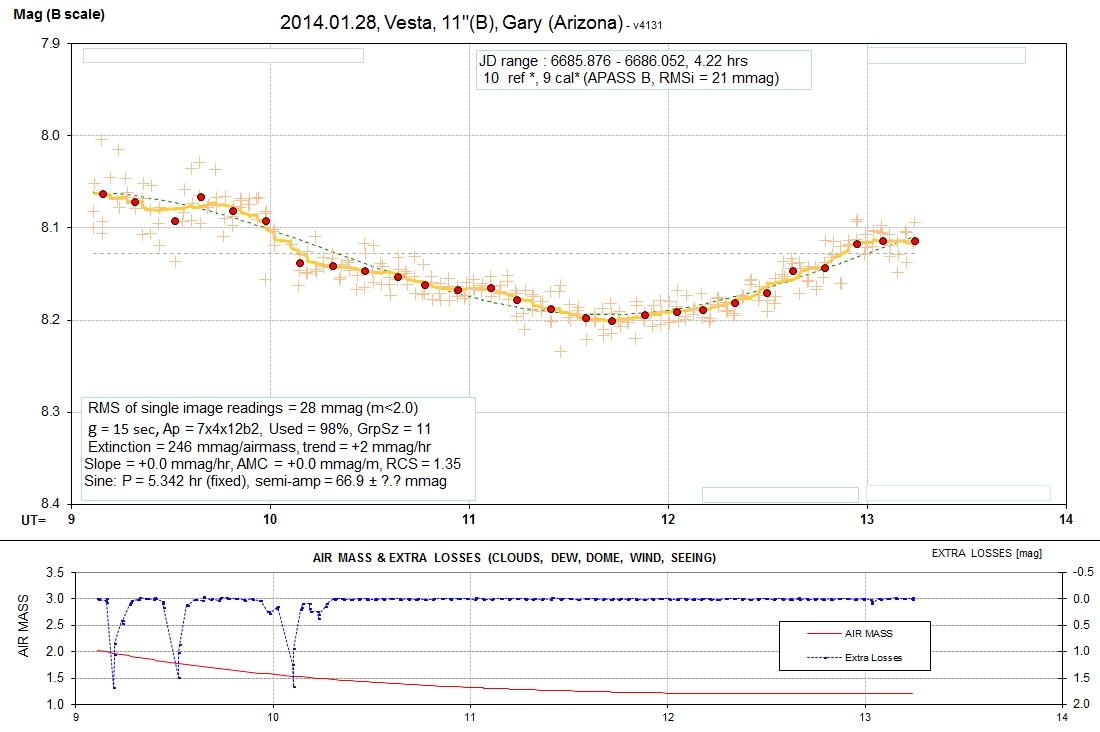
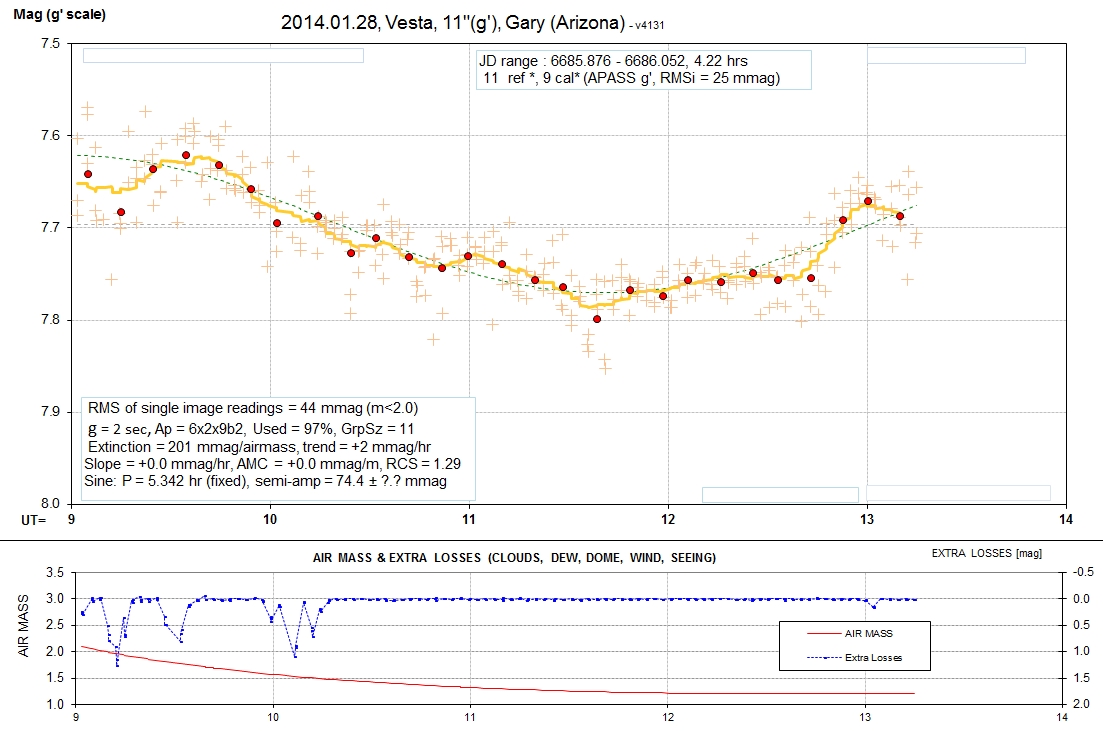
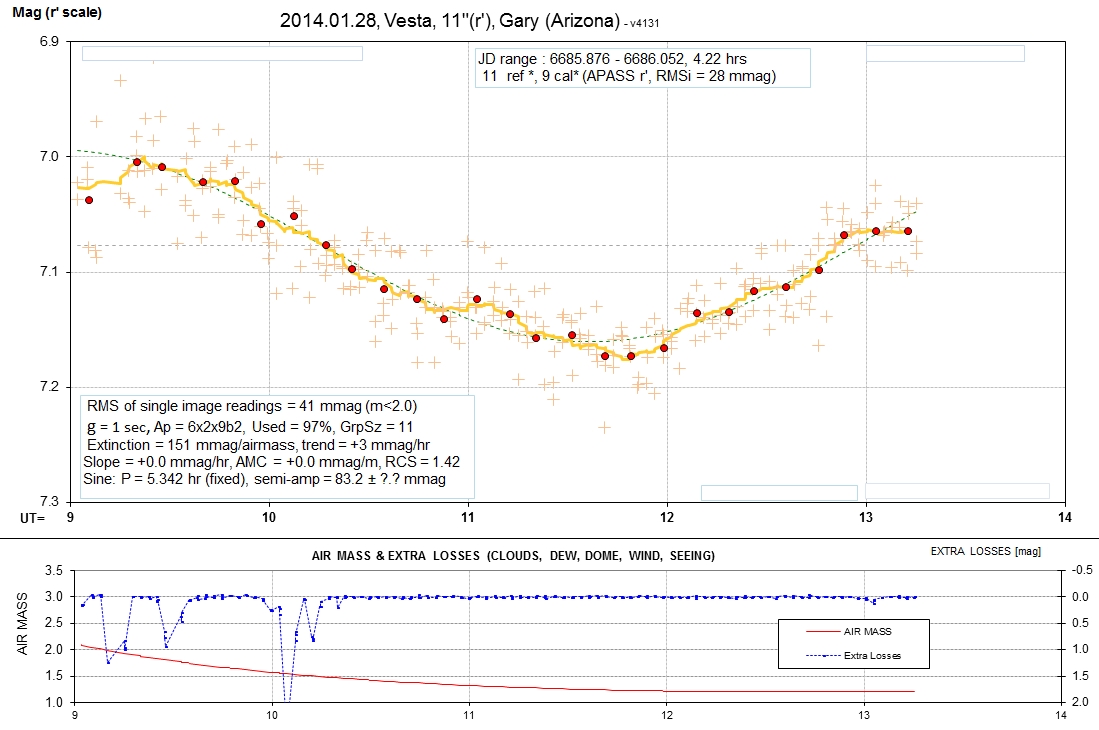
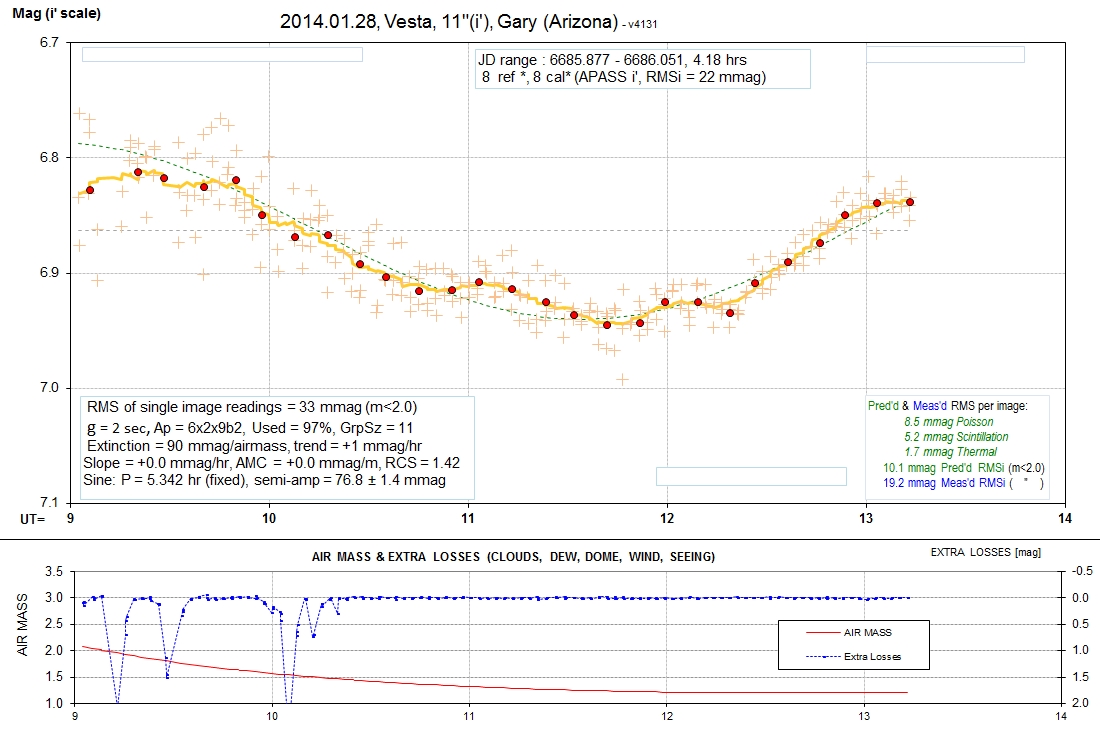
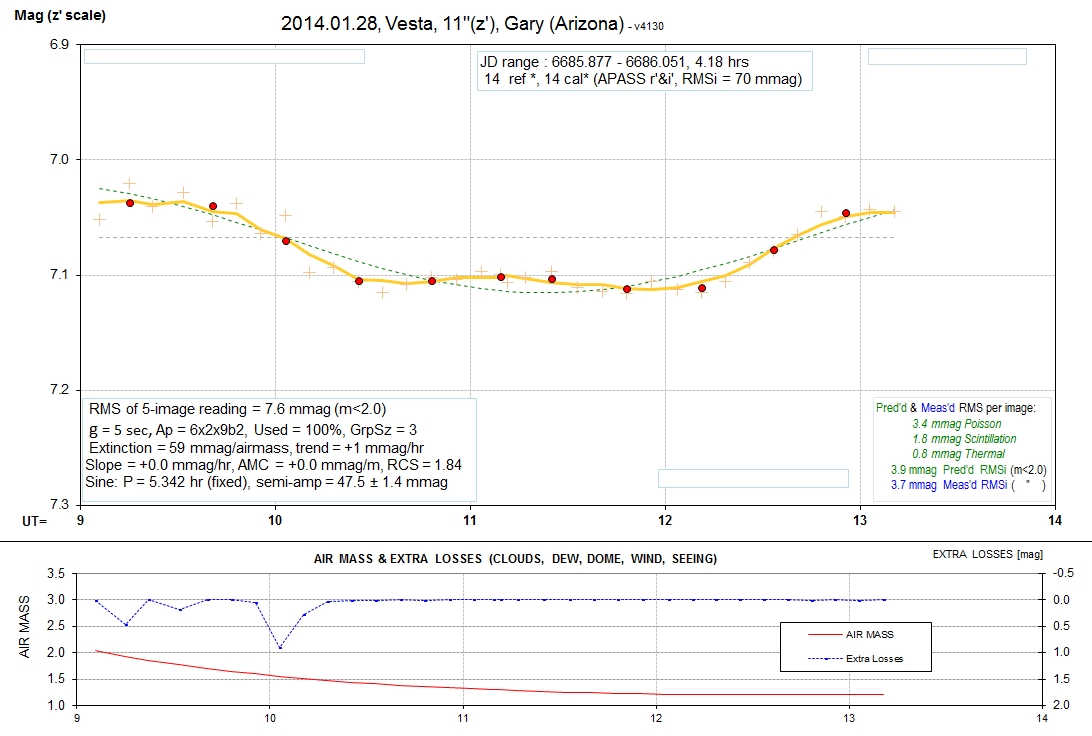
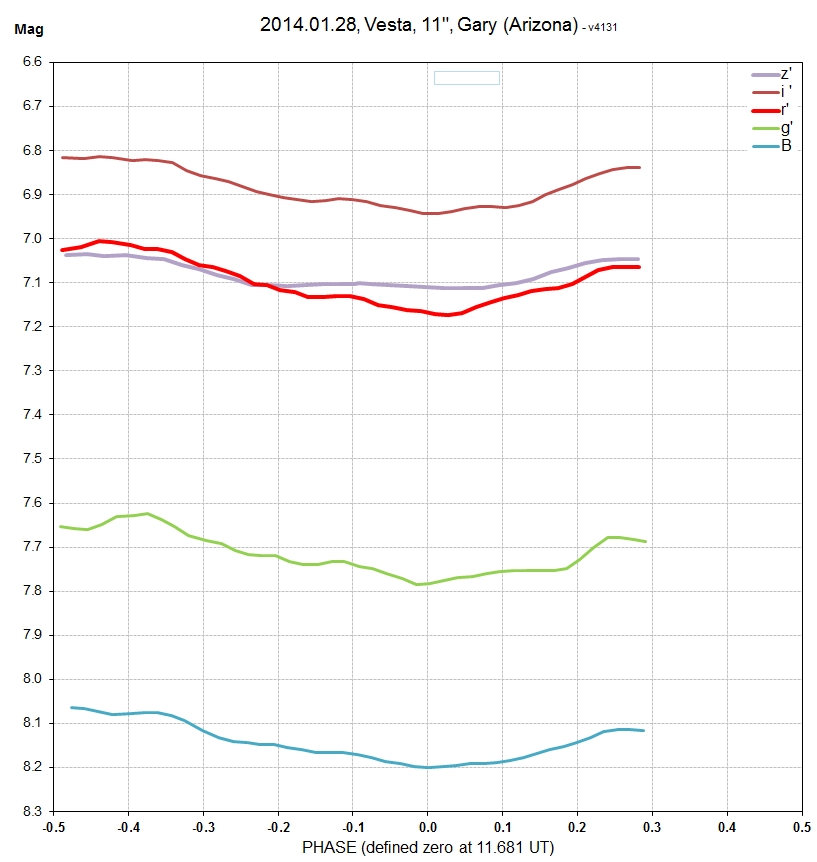
The following set of LCs are for B, g', r', i' and z' bands.
Sinusoid fits (chi-sqr based) are shown. The longest wavelength
departs the most from a sinusoidal fit. APASS stars were used to
establish the magnitude scale. The information box (top, center)
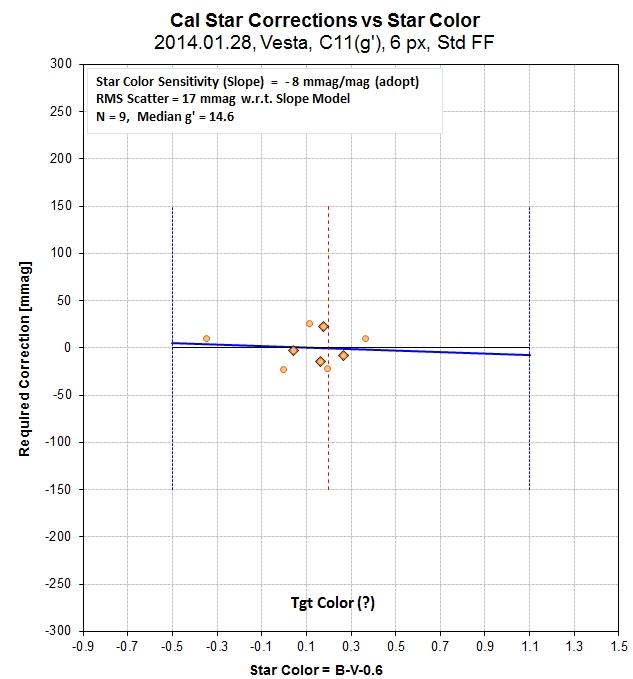
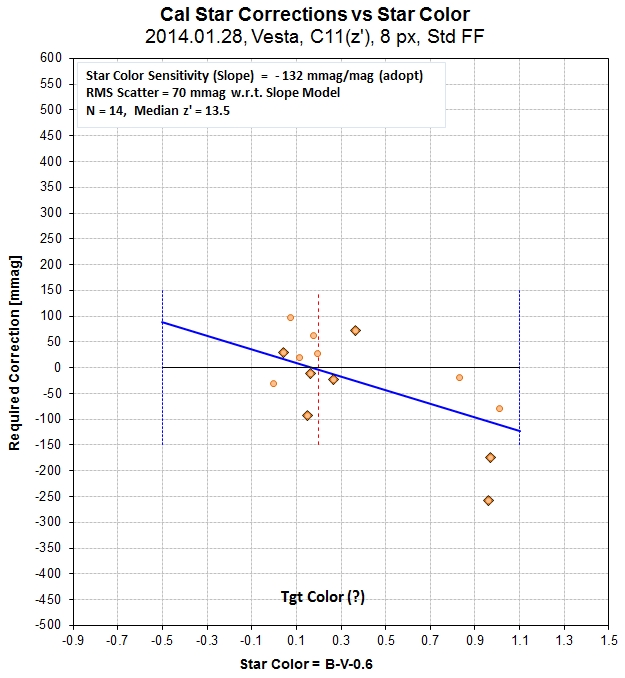
shows how many stars were used for reference and how many were
used for calibration. An RMS off the calibration fit is also noted
(more info about this below). An information box (lower-left
corner) shows the RMS that would be obtained for averages of
10-minute intervals if only that one filter was used throughout
the observing session. Typical values are 2.5 mmag. This box also
shows exposure time (denoted by "g" for gate time), photometry
apertures [pixels], percent of data that was accepted, number of
data in group averages, extinction, model fit slope and "air mass
curvature, reduced chi-square (RCS), model sinusoid period and
amplitude (with chi-sqr based SE). The information box in the
lower-right corner shows predicted RMS per image (green) and
measured RMS per image (blue). The predicted RMS consists of 3
components, also given.