Here's Tonny Vanmunster's TrES-1 transit light curves before my
adjustments.
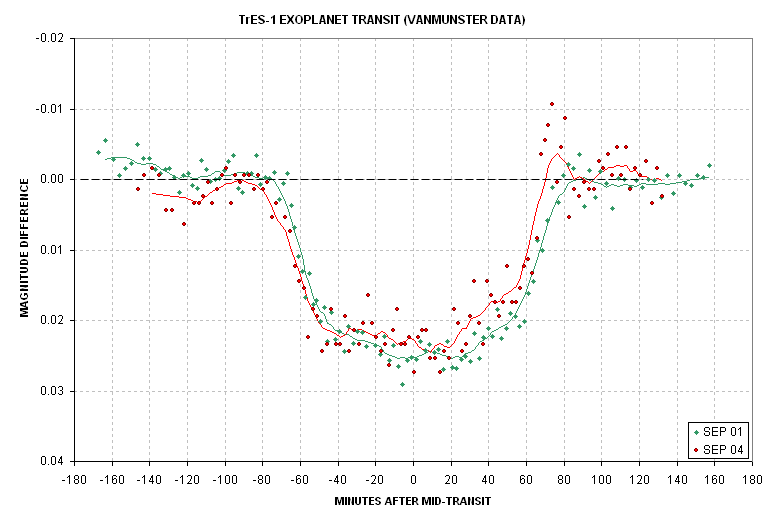
Figure 1. VMT before applying trend and time shift
adjustments. The traces are a sliding boxcar with a 24-minute interval.
Data points are for 2.4-minute intervals.
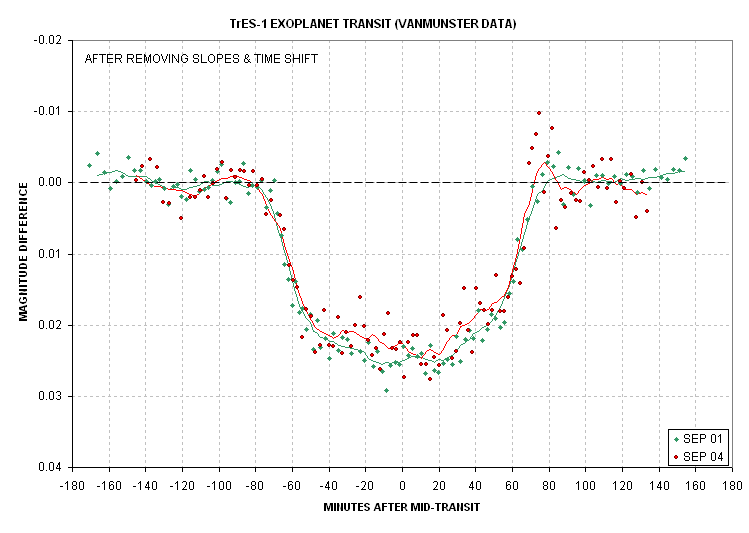
Figure 2. VMT after
applying trend and time shift adjustment. The Sep 4 data were adjusted
using a trend of -0.54 milli-magnitude/hour (hinged at mid-transit) and
time offset -3 minutes. The
Sep 4 data were adjusted using a trend of +0.72 milli-magnitude/hour
and time offset +1 minute.
____________________________________________________________________
This site opened: November 3, 2004 . Last Update: November 3, 2004