SENTINEL ALL-SKY FIREBALL CAMERA
PIXEL LOCATION TO AZ/EL CONVERSION & CASE STUDY ANALYSIS
Bruce L. Gary; Hereford, AZ
This web page illustrates how Sentinel Fireball
All-Sky cameras
can be used to determine the azimuth and elevation of a fireball versus
time. When two such data sets are available for the same fireball then
a 3-D trajectory can be determined. The trajectory can be determined
with sufficient precision to determine the velocity vector versus time,
which can be used to determine deceleration versus time. One such event
is used to
illustrate the procedure.
INTRODUCTION
All-sky Sentinel cameras are now operating routinely at stations in
1) Tucson, AZ (Robert Crawford), 2) Sierra Vista, AZ (Tom Kaye) and
3) Santa Fe, NM (Thomas Ashcraft). Other networks exist in other areas. It
is desireable for stations to coordinate their observations with others
that are close enough to have recorded the same event. My role in the
Tucson/Sierra Vista/Santa Fe network is to interpret images for
extracting azimuth/elevation versus time. We are working together to
cover other needs, such as 1) automatically extracting pixel locations
of stars and fireball signatures in Sentinel images and 2)
automatically comparing a list of stars with predicted star locations
for the Sentinel site. Eventually this web page will describe progress
on these other analysis objectives.
Other goals may exist for users of Sentinel cameras. Tom kaye and I
are motivated to see how much can be learned about fireballs from
nothing more than two sequences of Sentinel images of the same fireball
event. This may seem like a modest goal, but I continue to be
surprised, as I proceed with the analysis of this one case study event,
how much actually can be learned.
Here's an all-sky, 26-frame animation of the 20071219 094646 UT fireball event as viewed from Sierra Vista.
Figure 1. All-sky, 26-frame animation of the 20071219 094646
UT fireball event from the Sierra Vista, AZ Sentinel camera. North is
up, east is left. The fireball is low in the western sky traveling
north at decreasing elevation angles.
Fireballs are simply bright meteors. One discriminating criterion is
to calculate the V-magnitude for a hypothetical observer beneath the
meteor and if it's brighter than -3 it's a fireball. Whereas meteors
are typically sand-grain sized particles, fireballs are usually larger.
The majority of meteors and fireballs arrive from orbits with aphelia
farther than the asteroid belt and intercept the Earth with speeds of
~40 km/s. Since the Earth moves in its orbit with a speed of 29 km/s,
and since the impacting particles can intercept the Earth's atmosphere
from many directions, the particles enter the atmosphere with speeds of
10 to 70 km/s. They become visible at altitudes 60 to 120 km. Most
meteors evaporate to dust before reaching the ground. Some fireballs
decelerate to speeds in the atmosphere where they no longer lose mass
(from surface heating that causes melting and ablative evaporation) and
soon after descend with terminal velocity speeds and a residual mass
that falls to the ground as a meteorite.
IMAGE HANDLING SOFTWARE
The Sentinel observing program produces a very compact DAT-file for
viewing the 100 or so image sequence in the manner of a movie.
Quantitative analyses of the individual images require that they be
viewed one-by-one by a program that reads pixel location. I'm a
long-time user of MaxIm DL for astronomy image manipulation so I had to
find a way to convert the DAT-file image data to individual images that
can be processed by MaxIm DL. The following procedure must be more
complicated than necessary, but so far this is the best I've found that
works.
1) Run Sentinel's "sentuser.py"; choose "Read Event" feature to read dat-file;
choose "Save As" movie to create mov-file.
2) Run "RAD Video Tools" to read
mov-file and convert it to avi-file.
3) Run MaxIm DL to read avi-file which
displays 100 or so individual files that can be measured. As an option, save an
individual avi image to JPEG or TIFF.
The "deep" (long exposure) image is a TIFF-image file, so this can be read by MaxIm DL without the above complicated procedure.
PIXEL TO AZ/EL
After a fireball triggers a sequence of 30 images/second the
Sentinel camera will take a long exposure of the sky for the purpose of
"solving" the image for pixel to AZ/EL (azimuth/elevation) location
equations. Here's an image from the Sierra Vista (SV) station (operated
by Tom Kaye).
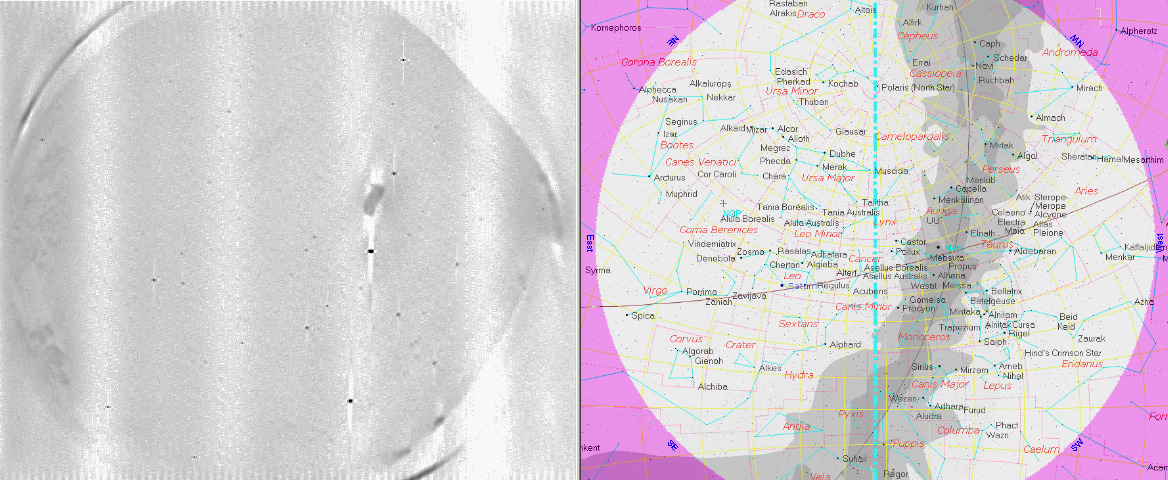
Figure 2. Sentinel "deep" image for 20071219_094646 UT (left)
taken at the SV station and a screen capture of TheSky (right) for the
same time and location. North is up, east is left.
By comparing the known location of stars and planets with a Sentinel
"deep" image (i.e., long exposure) it is possible to identify stars in
the Sentinel image. For example, in the above Sentinel image the
brightest object is Mars, right of center, and the second brightest is
Sirius, to the south. Saturn is left of center. A total of 25 stars are
identifiable in this image.
At the present time the process of associating Sentinel stars is
done manually. A table is created with a tentative star identification
and x,y pixel locations. These data are entered into an Excel
spreadsheet where a first-guess x,y location for zenith is also
entered. The spreadsheet calculates a pixel distance from the tentative
center location and the user views a plot (next figure) to assess the
effect of user-changes to the x,y image center. When a "good" plot is
obtained changes to x,y image center are assessed by performing a quick
2nd-order regression of known elevation versus center distance. The
next graph plots the solution obtained for the 20071219_094646 SV image.
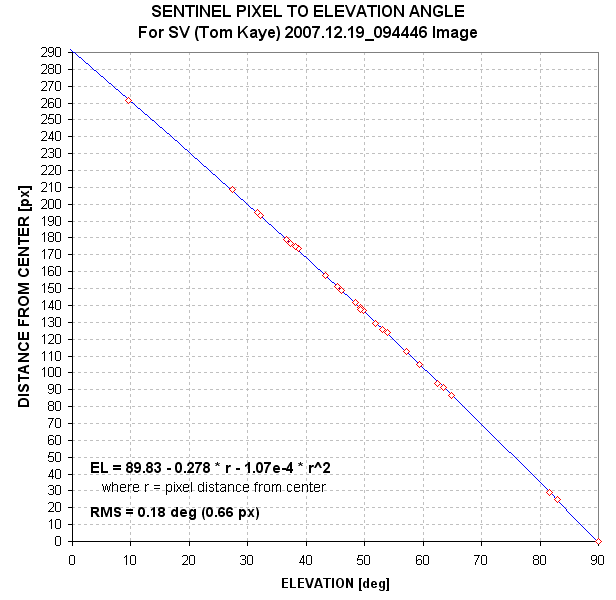
Figure 3. Solution for elevation versus pixel distance from center.
It surprised me to learn that the Sentinel's all-sky optics produce
a close-to-linear relationship between elevation and pixel distance
from the zenith location. The slightly curved fit has a residual RMS of
0.66 pixel, which is amazing to me. This is 1/5 degree, or 11 'arc!
This is smaller than a pixel width, and is close to a theoretical
performance limit.
The next step is to solve for azimuth versus pixel location. The next figure shows that this is possible.
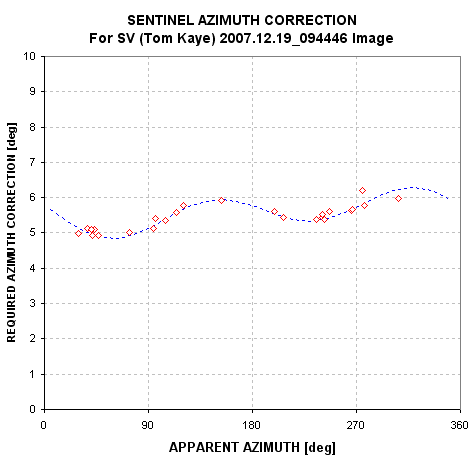
Figure 4. Azimuth differences from a simple model fit that
uses the x,y pixel center location and the assumption of north-south
orientation of the Sentinel.
This figure shows that the Sentinel camera is offset in azimuth by
about 5.5 degrees. In addition it shows that a 2-component sinusoid is
needed to fit the data better. One component has a period of 360
degrees and the other component has a period of 180 degrees. This was
just a guess, and it's adequate. The RMS residual is 0.34 degree. This
is greater than the RMS residual for elevation, but keep in mind that
stars close to zenith can have a large azimuth departure form a model
fit when the great circle arc distance is small. I'm estimating theeat
the arc RMS residual in azimuth is ~1/4 degree (15 'arc).
The individual short-exposure images that include the fireball have
"pixel to AZ/EL" solutions that are offset in the x and y coordinates
by a constant amount for all sky locations. These images don't show as
many stars as the "deep" image because their exposure time is much
shorter, but so far I have found enough bright stars and planets to
establish the offset (and to verify that it's the same for several
locations).
FIREBALL IMAGE ANALYSIS
MaxIm DL can read an AVI-file in a way that displays the the
component images individually. Each individual image in the fireball
sequence can be processed as a 16-bit image, with the capability to
adjust brightness, contrast, perform color separation, read a pixel's
brightness (ADU) in each color, etc. The first step in the processing
of individual fireball images is to determine the x,y zenith location
offset from the deep image's x,y zenith location. This is done using
the few bright stars that are present in the individual fireball
images. When the x,y zenith offset has been determined it is possible
to use the spreadsheet described above to convert fireball x,y
locations to AZ/EL.
For the above example (20071219_094646 SV) there are 19 images
showing the fireball. Each of these was "read" by MaxIm DL's photometry
tool for the measurement of x,y centroid and magnitude. The magnitudes
can be calibrated using a known star, or planet, which has a
well-established magnitude. The next figure shows the azimuth and
elevation versus time for the fireball under consideration.
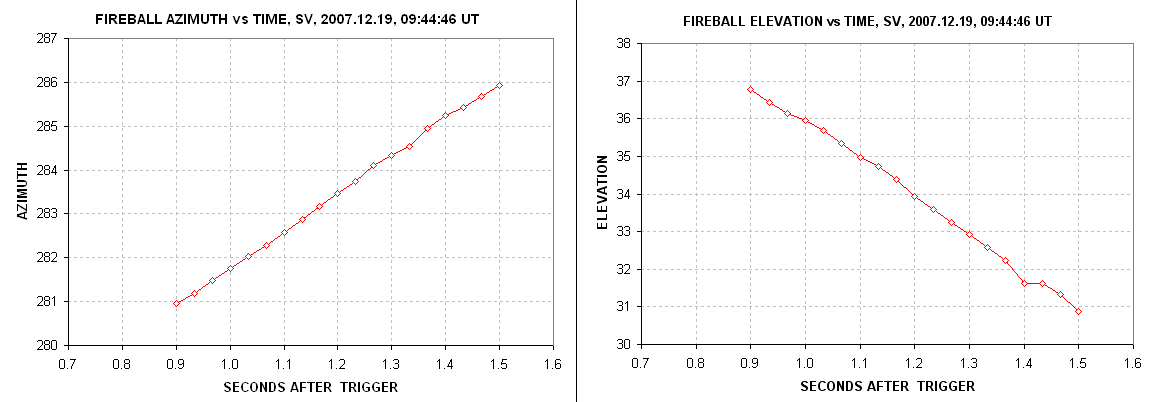
Figure 5. Azimuth and elevation versus time for the 20071219_094646 fireball.
The internal consistency of these azimuth and elevation measurements
is better than the RMS residual performance given above because the
fireball is so bright that it is recorded on many pixels, and sub-pixel
precision is possible. For example, even though the elevation readings
exhibit an internal uncertainty (precision) much less than the accuracy
of 0.18 degreedetermined in the above section, the group of
measurements should be considered subject to a SE uncertainty of 0.18
degree.
Fireball brightness versus time is shown in the next figure.
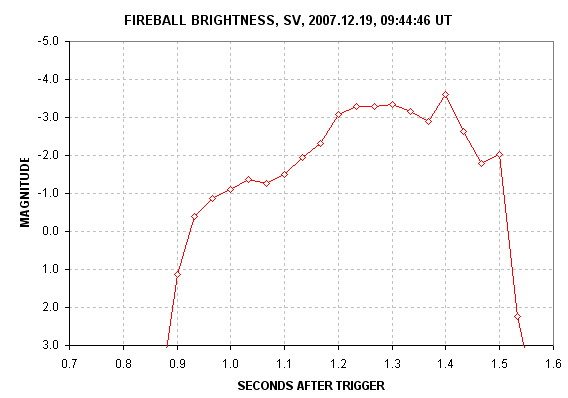
Figure 6. Fireball brightness versus time for the 19 images showing the fireball. The magnitude scale is calibrated using Mars.
COMBINING OBSERVATIONS FROM TWO STATIONS
This fireball was also observed by the Tucson station (TU, Robert
Crawford). The following figure summarizes my analysis of these images.
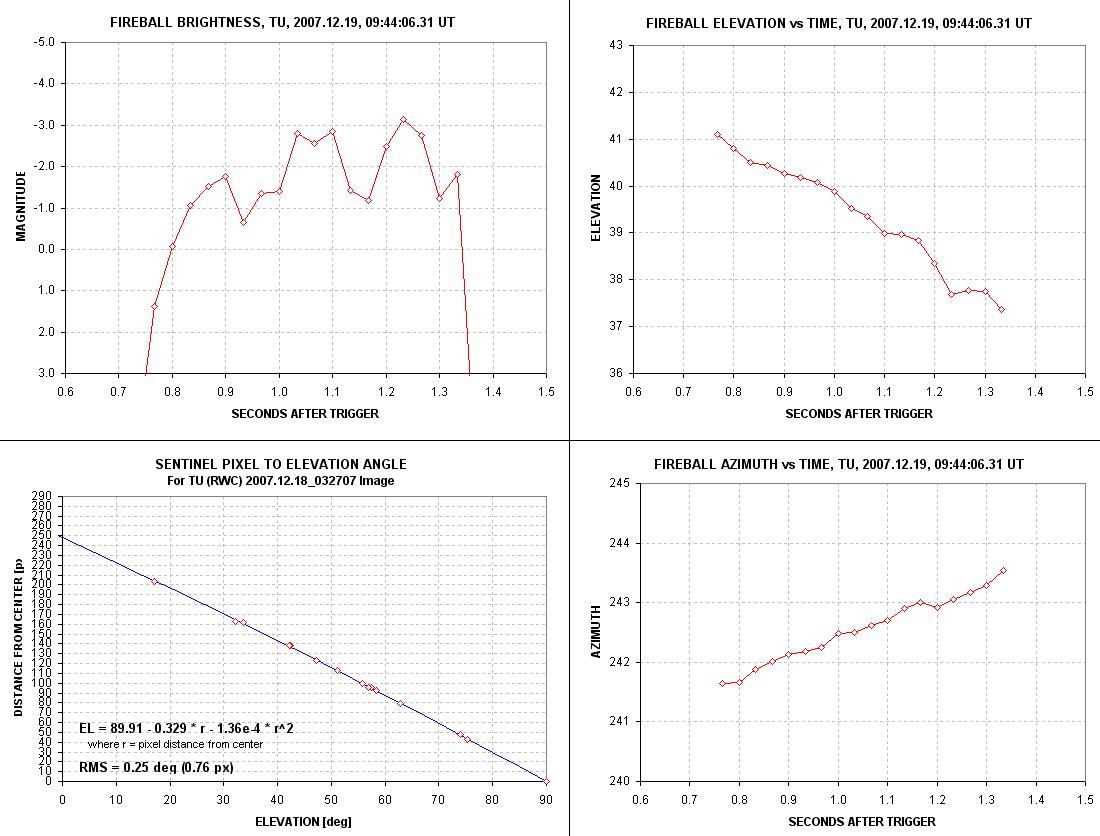
Figure 7. Analysis of Tucson station fireball images for the same fireball event of 20071219.
It is interesting to compare the fireball brightness versus time
profiles for the two stations, SV and TU, shown in the next figure.
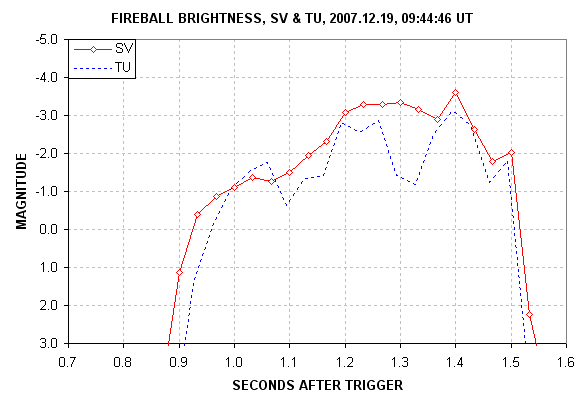
Figure 8. Fireball brightness versus time as observed from stations in Sierra Vista (SV) and Tucson (TU).
The shapes and duration of the Tucson and Sierra Vista
observations are similar. The Tucson observations are slightly fainter
than the Sierra Vista observations. Neither sighting was near overhead,
but if it were the brightness would have been 5.6 times brighter, or
V-mag = -5.2 (from SV site).
It is possible to use simple geometry to triangulate on the
fireball's location with observations of AZ/EL from two stations. In
fact, the solution is overconstrained since it is possible to use only
one station's AZ with the other station's AZ/EL to derive a 3-D
trajectory solution. This is what I've done for this event, and the
table below shows the fireball's altitude and latitude/longitude
location versus time.
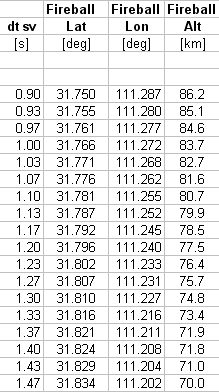
Table 1. Ground track location and altitude versus time since Sentinel trigger time.
The next figure is a plot of the fireball's altitude versus time, based on the above table.
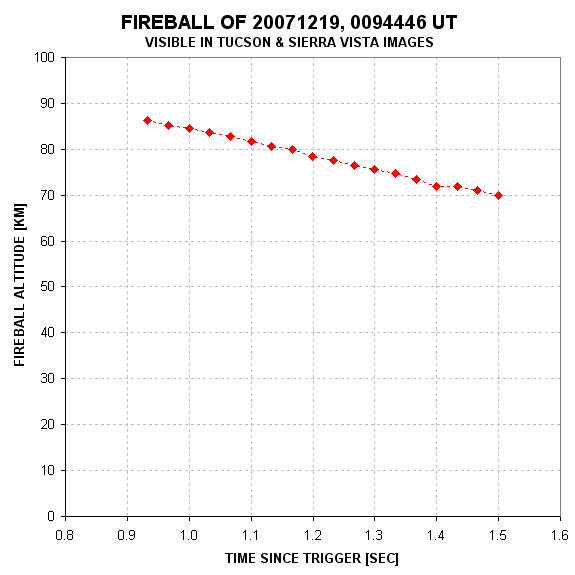
Figure 9. Altitude versus time for the 20071219 fireball.
The first derivative of this altitude plot will produce a vertical velocity plot, which is shown in the next figure.
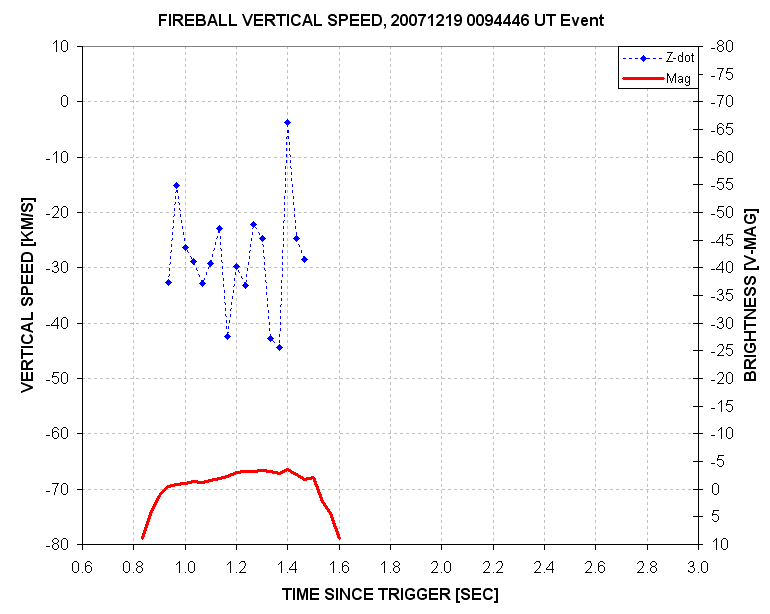
Figure 10. Vertical speed based on slope of altitude versus time.
The vertical speed plot shows an average descent rate of ~30 km/s.
As the next figure will show the horizontal speed upon entering the
atmosphere is 38 km/s. The total speed is therefore 48 km/s.
The vertical speed should initially be increasing and then commence
a deceleration due to encounter with the atmosphere. The vertical speed
data are too noisy to show a change in descent speed. We can calculate
a maximum increase in descent speed in the absence of an atmosphere by
noting thatan object starting at rest at 86 km and free falling to 70 km (after 57 seconds) would
acquire a velocity of 0.57 [km/sec]. This is a miniscule velocity change (1.2%) compared with an atmospheric
entry velocity of 48 km/s, since it represents an energy increase of
only 0.01% I will ignore this component to the fireball's energy
balance in a later section.
As this figure also shows, the fireball brightened to detectability at an altitude of 86 km and
abruptly faded to undetectability at 70
km.
<>The fireball's horizontal speed can be determined by converting its
location over the ground to a first derivative plot. This is shown in
the next figure.
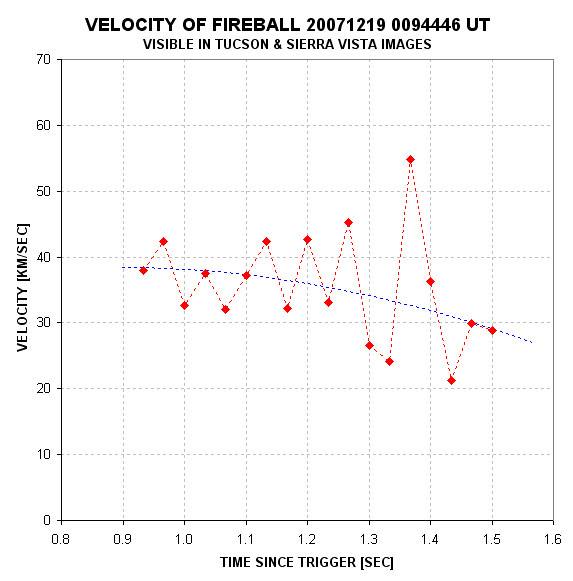
Figure 11. Fireball horizontal speed versus time.
The fireball's horizontal speed is ~38 km/s early in its visible
trajectory. There might be evidence in this plot of a slight decrease
in horizontal speed near the end of the fireball's visible trajectory.
Since we have determined both components of the fireball's speed,
vertical and horizontal, and since it appears that there is no
deceleration until late in the visible trajectory, we can use the two
initial speeds to calculate a velocity vector. The velocity has a
magnitude (speed) of 48.1 km/s, an azimuth of 40 degrees (as
portrayed in Fig. 12) and a dip angle (elevation as viewed by an
initial impact point observer) of 38 degrees. Since we know the Earth's
orbital velocity vector (with a speed of ~29 km/s) it is possible to
calculate the fireball's velocity vector at the time of entering the
atmosphere. This, in turn, will allow us to calculate its velocity
vector prior to being influenced significantly by the Earth's
gravitational field, and in turn we can deduce its solar system orbit.
These calculations will be made in a later section of this web page.
Here's a map showing the beginning and end points of the fireball's visible trajectory, as well as the two Sentinel locations.
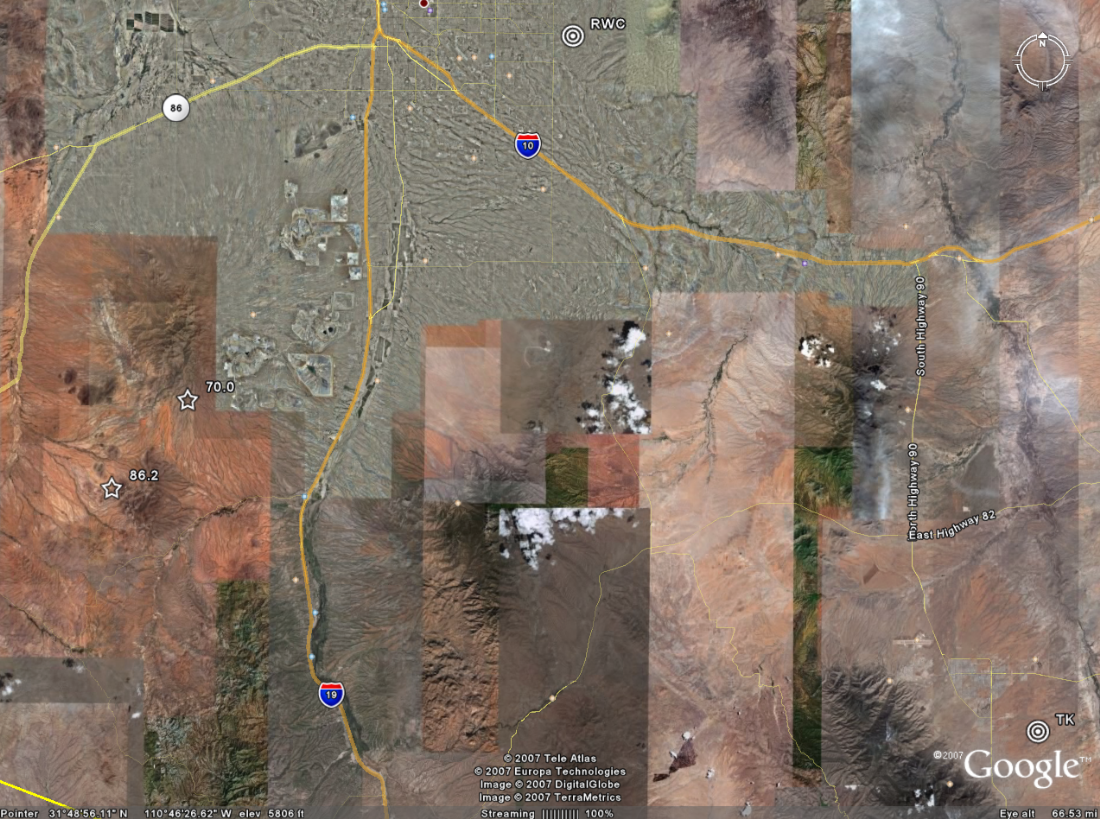
Figure 12. Google map showing the fireball's northward path
over the ground. The 86.2 and 70.0 notations are the fireball's
altitude [km]. The ground-track of the fireball's visible path has an
azimuth of 40 degrees. In the upper-right is the Tucson station,
labeled RWC
(for Robert W. Crawford) and in the lower-right is the Sierra Vista
station, labeled TK (for Tom kaye).
The average distance of the fireball from the Sentinel stations are
163 and 145 km (SV and TU, respectively). The fact that SV brightness
readings were greater than TU, in spite of the greater distance, may be
explained by the lossof sensitivity of the Sentinel CCD system at low
sky elevations.
Tom Kaye has combined this fireball's 3-D trajectory with a Google
database for the area that can be manipulated by the viewer to "get a
feel" for the fireball's path in relation to the ground. It can be
found at this link: (GoogleBolide20071219) Here's a snapshot from that user-controlled animation.
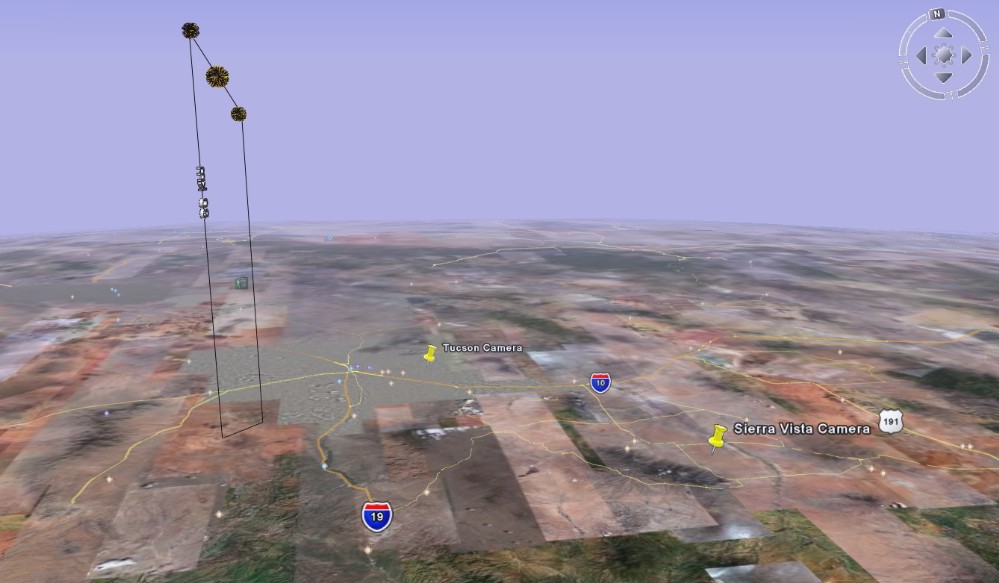
Figure 13. Fireball trajectory, looking north. The 38 degree
angle of attack is evident. This is a "snapshot" from Tom Kaye's
user-controlled Google/trajectory creation.
FIREBALL PHYSICS
One purpose for this amateur fireball project is to determine what can
be learned from observations of fireballs with two or more coincident
recordings of the same event. The previous section showed that it is
possible to determine the fireball's vertical and horizontal speeds,
and also the orientation of the velocity vector. For this fireball case
it was difficult to discern whether or not deceleration of the
fireball's velocity occurred during the visible trajectory portion, but
an approximate solution was determined. This section is a floundering
attempt to
explore what can be learned about the energetics of the fireball's visible trajectory.
When the fireball encounters the atmosphere kinetic energy from its
motion is converted to illuminating its path. It is reasonable to
assume that the velocity vector slows without changing its orientation
initially. Therefore, if the horizontal veolicty shows a slowing from
38 km/s to 30 km/s we can expect that the vertical velocity slowed in
the same proportion, from 30 km/s to 24 km/s. Is this expectation
compatible with the observations?
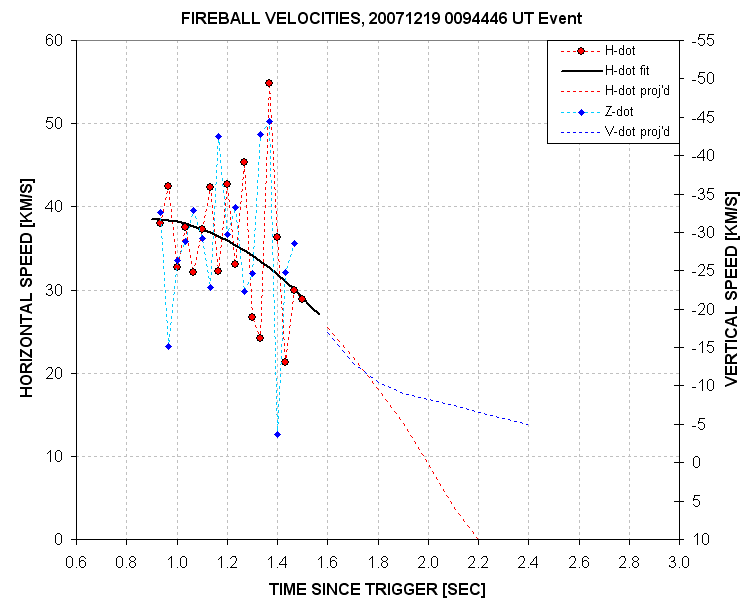
Figure 14. Vertical and horizontal speeds versus time with projected values (dotted).
In this figure I have cleverly adjusted the right-side vertical scale
for vertical speed so that the previously presented solution for
horizontal speed decay shape is matched to the vertical velocity
measurements. This allows us to ask whether the same proportional speed
decay shape is compatible with both speed components. The anawer is
"yes." Notice that the vertical speed doesn't continue decreasing to
zero because it can't descend slower than the terminal velocity
(treated below). In modeling the fireball's total speed (orthogonal sum
of vertical and horizontal components), we will assume that when the
fireball brightens to visibility it is traveling at 49.7 km/s
(sqrt(32^2 + 38^2), and when it fades to invisibility it is traveling
at 35.8 km/s (sqrt(21^2 + 29^2).
The fireball radiates light because it is heated by friction with the
atmosphere to temperatures where "blackbody thermal radiation" becomes
significant at visible wavelengths. This is a minor contributor to the
fireball's brightness. Another minor brightness source is a trail of
heated air that radiates blackbody thermal emission at
visible wavelengths. A more significant source of brightness results
from air molecules being broken into constituent
atoms, which lose electrons, and when the electrons return to
the ionized atoms they emit photons at visible wavelengths. Another
significant contender for making the fireball sivisble is compressional
heating of air in front of the fireball, producing a volume of air that
is much larger than the fireball itself and which is hot enough to
radiate thermal photons at visible wavelengths. As stated above, the
potential energy extracted from the fireball's
change in altitude during the time it can be seen is insignificant.
Whichever source for producing light is most important, it can be
stated that the energy
source for the light we see is the fireball's kinetic energy, KE = mv2,
where m is the mass of the fireball and velocity v is defined relative
to the atmosphere.
There are two coordinate systems to consider as we try to understand
physical events produced by the fireball's encounter with the
atmosphere: 1) a coordinate system fixed to the fireball, and 2) a
coordinate system fixed to the atmosphere.
Let's first consider what happens from the fireball's perspective as it
is hit by one molecule of air (nitrogen or oxygen) moving at velocity
v. Several things could happen. If the collision were elastic the
fireball would recoil (change velocity), as would the molecule. Neither
would change temperature (from the fireball's perspective) and no
dislodging of fireball particles would occur. Low velocity impacts may
be elastic, but high velocity ones are not. This is because the the
impacting particle comes so close to the target that a target atom's
surrounding electron cloud is distorted sufficiently to cause the atom
to either 1) become dislodged from the larger mass of nearby atoms or
2) the atom loses an electron from the electron cloud, causing the atom
to become an ion that readily interacts with any nearby electron or
ion. A high velocity impact that is not elastic can be viewed as having
the change of kinetic energy due to the collision converted to other
forms in a way that is partitioned between elastic recoils and
inelastic (i.e., irreversible) disruptions. As indicated above, a
disruption can take the form of dislodging an atom (or group of atoms,
a "particle") from the main mass; this "vaporization" process can be viewed as a conversion of
kinetic energy to a change in potential energy. The dislodging process
will also be associated with heating (i.e, a change in the mean kinetic
energy of atoms). If the impacting object is a molecule, then the two
or more constituent atoms may be dislodged from each other, and their
relative velocities will become non-zero (their relative velocities
before the impact were non-zero, but small enough to not become separated from
each other). The molecules that are converted to atoms may undergo
additional disruption if any of the atoms lose an electon during the
collision. Atoms and molecules in the fireball that were near the
impact point will be jostled and thus heated by the impact. An
additional effect occurs when the number density of atmospheric
molecules is so large that the "mean free path length" is small (others
have shown that anything smaller than ~10 cm is significant). When this
condition is met the atoms emerging from their molecular collision with
the fireball (inelastically bouncing off) collide with nearby molecules
of air in front of the fireball to produce a region of high density
with a mixture of fast-moving atoms and slow-moving molecules. The fast
atoms speed up the molecules through collisions in a manner that can
also be described as compressional heating. If the volume of compressed
air ahead of the fireball is hot enough it will emit blackbody thermal
photons at visible wavelengths. Finally, if a region of compressed air
is present in front of the fireball a sound wave will be created that
carries away a small amount of "acoustic energy."
From the standpoint of the fireball an impact with an atmospheric
molecule will lead to the following: 1) the fireball loses mass (atoms
and molecules), 2) the fireball's surface is heated, 3) the fireball
changes velocity, 4) the impacting molecule is broken into constituent
atoms, 5) the atoms from both the fireball and broken atmospheric
molecule lose electrons (are ionized) and 6) compressional heating of
air arriving at the fireball at high speed produces a hot and high
density region that can lose energy from thermal radiation.
Now let's review the identical impact event from the perspective of the
atmosphere's coordinate system. Each impact of the fireball with an
atmospheric molecule leads to the following: 1) the fireball loses
mass, 2) the fireball's surface is heated, 3) the fireball velocity is
slowed, 4) the atmospheric molecule is broken into atoms, 5) atoms from
both the fireball and air molecule are ionized and 6) compressional
heating of air from the fast-moving fireball produces a hot and high
density region ahead of the fireball that loses energy from
thermal radiation.. All of these events extract kinetic energy from the
fireball's motion through the atmosphere. When a fireball is visible we are seeing photons emitted by atoms that
have been subjected to the above events.
With this background let's consider constraints that can be placed on
the above fireball event using the concept that all observed phenomena
were produced by extracting kinetic energy from the
fireball's path through the upper atmosphere. The fireball's kinetic
energy decreased from the time it brightened to the time it faded, and
let's denote these two energies by KEi and KEf (where subscripts "i" and "f" refer to initial and final). During the event
the fireball's mass changed from Mi to Mf.
During an increment of time we can write the following energy balance equation:
0 = dKE + dPE + dPhotonEmission + dHeating + dIonization +dDislodging + dCompressionalHeating + dAcoustic
where dKE is the energy extracted from the fireball's change in
speed, dPE is the change in potential energy by falling through the
Earth's gravitational field (insignificant, but included here for
completeness), dPhotoEmission is the time-integrated flux of thermal
emission at
all wavelengths from the fireball's hot surface (insignificant),
dIonization is the
amount of energy used to ionize atoms (significant), dDislodging is the
energy used
in ripping fireball atoms out of the fireball main body, dHeating is
the sum of energy used to heat the surface of the fireball and nearby
atmosphere, dCompressionalHeating is the energy lost by the emission of
photons from the high density and hot region of air in front of the
fireball (significant), and dAcoustic is acoustic energy carried away
by sound waves (small).
For the case of no atmosphere this equation reverts to dKE = - dPE,
which simply expresses the fact that an increment of lost PE (from
falling to a lower altitude) shows up as an increase in KE (greater
fall speed).
Clearly, there are more unknowns than knowns in this equation. We don't
know the fireball's initial mass, and we don't know how much energy is
used for dislodging, ionizing, heating or creating sound waves. All we can estimate is the
amount of energy radiated away (isotropically) in the form of visible wavelength photons from all sources.
Let's see if the flux of radiant energy is comparable to estimates for
dKE.
dKE = KEi+1-KEi and KEi = mi × vi2 where mi is fireball mass and vi is fireball velocity (or speed, since orientation is assumed constant).
If dPE were significant we would use the relation: dPE = PEi+1-PEi and PEi = constant + mi × Zi, where Zi is altitude. Since it isn't significant it will be ignored in the following.
Let's adopt a nominal initial mass of 0.010 kg. If the fireball belongs
to the "stony" category (like 95% of meteors) it will have a density of
~4.5 [g/cm3]. If the fireball is spherical its diameter will
be 1.62 cm, or 0.64 inch. This may be larger than a typical fireball
(the once per night visible from a single site), but we can always
rescale results after deriving a solution for a specific example.
Since KE = m × v2 we can calculate an initial value (using the MKS system of units):
KEi = mi × vi2 = 0.010 [Kg] × (50e3 [m/s]) 2 = 24.7e6 [joules]
If the fireball loses 50% of its mass, reducing its size to a diameter of 1.3 cm (we have to assume something, and this is a "special case" as will be explained below), then
KEf = mf × vf2 = 0.0062 [Kg] × (36e3 [m/s]) 2 = 6.4e6 [joules]
If the velocity hadn't changed but 50% of the initial mass had been
lost, the energy loss would be 50%. If no mass had been lost and only
velocity changed (from 50 to 36 m/s) the energy loss would also be 50%.
For this "special case" of equal energy losses from velocity and mass
changes the total energy is reduced to 26% of its initial value. This
example illustrates that comparable amounts of energy loss can occur
for mass loss and velocity loss.
It is fair to ask how a fireball's brightness could dramatically
fade at a time when it had lost only 2/3 of its atmospheric entry
energy. To answer such a question we have to know what caused it to
brighten in the first place. Was it ionization of atmospheric atoms and
molecules and the recombination of those released electrons? Was it the
compressional heating of air ahead of the fireball that produced a
super-hot volume of air that radiated blackbody thermal visible
wavelength photons? Was it the hot surface of the fireball that
radiated blackbody thermal visible wavelength photons? It can't be the
last mechanism since a red-hot sphere 1.3 cm across is not bright
enough to be viewed from a distance of 163 km. Another argument against
the hot fireball idea is that it would not cool fast enough at 70 km
altitude to fade as fast as it was observed to fade. The hot air
compression model is attractive because it lends itself to an abrupt
breakdown that could account for the fast fade. Since I'm a mere
amateur on this subject I'll defer to anyone who can elucidate this for
me. Until then the following treatment will be hampered by an
uncertainty over the physical mechanism that causes meteors and
fireballs to be visible at all.
Before proceeding with an energy balance exercise let's calculate a
terminal fall velocity for an object with a stone's density and
a diameter of 1.3 cm. For U.S. Standard Atmosphere conditions at
an altitude of 76 km (271 K, 0.021 mb, 2.7e-5 Kg/m3) I calculate a terminal velocity of 8.0 km/s. At the rate this fireball was decelerating it would require
an additional 0.3 second after it faded to slow down to terminal
velocity.
We now will estimate the total amont of radiant energy emanating from
the fireball (and nearby atmosphere) in order to determine if it is at
all comparable to the difference in kinetic energy lost during the
visible event.
No information is available for the spectrum of this event's fireball
emission. I will therefore assume that it is a blackbody spectrum with
a color temperature of 4000 K. I acknowledge that choosing another
temperature, suchas 300 K, would lead to a different total spectrum
energy. However, until information from some other source suggest using
a different color temperature assumed vlaues will have to suffice for
crudely estimating radiant energy output. An uncertainty in energy
output can be calculated from an assumed uncertainty in color
temperature.
TO BE CONTINUED
FIREBALL IMPACT LOCATION
FIREBALL ORBIT
FUTURE PROJECTS
It's important to automate as much of this analysis as possible, since
it took too much manual reduction time to become routine. One task is
to automate the rading of a deep image to extract star x,y locations.
Another task is to automate the process of creating a list of bright
stars (V-mag < 3) and their AZ/EL locations for the site in question
and time of the event. Another task is to combine these two lists to
find matches and solve for pixel location to AZ/EL.
The experience with the fireball event of 20071219_094646 shows that
good quality trajectory information can be extracted from a 2-station
coincidence of observations using the Sentinel cameras. Therefore, it
is worth the effort to proceed to the developent of automated image
analysis programs. As these programs are created and evaluated they will be described on this web page.
It should be noted here that the case study fireball event treated on
this web page is not a very good one. It was far away, and low on the
horizon for both Sentinel stations. When a "good one" is observed by
two stations a far better determination will be possible for the
trajectory through the atmosphere, the deceleration versus time, the
solar system orbit and the ground impact location.
MYSTERIOUS EVENT of 2008.02.22, 03:55:06.7 UT
Of course no two fireball events will be the same, but how different
can they be? The Dec 19 event is similar to what's in the fireball
literature, so I'll use it as a reference for the following event.
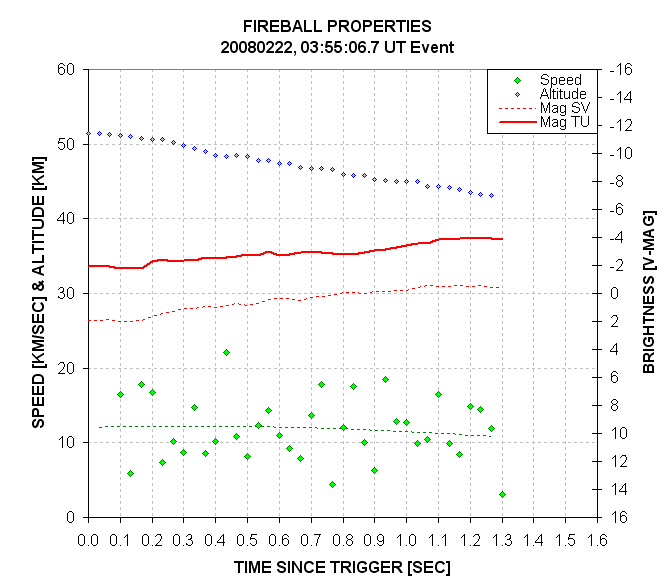
This event was a low-altitude one; whereas the Dec 19 fireball event
was at an altitude of ~80 km, this one was at 40 to 50 km. This event
was also a slow-moving one; whereas the speed f the Dec 19 event was
~40 km/s, this event had a speed of ~9 km/s. The velocity vector was
eastward motion. Are all these properties consistent with the entry of
a chunk of the satellite that was blown-up by the Navy on 2008.02.21?
Let's look at the ground track to see if it's compatible with the
satellite's inclination.
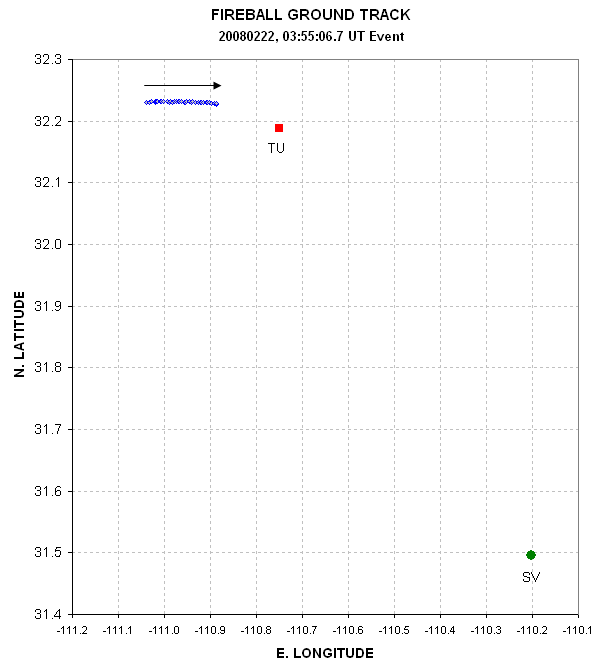
The velocity vector points east. The satellite's inclination is ~65
degrees, and it moves eastward only at latitudes +65 and -65 deg. That
means this cannot be the satellite USA 193 that the Navy destroyed
February 21.
____________________________________________________________________
WebMaster: Bruce L. Gary. Nothing on this web page is copyrighted. This site opened: January 03,
2008. Last Update: February 24,
2008