Links Internal to This Web Page:
Finder Charts (V and Ic)
Variability of Reference Star 114
Variability of Other Reference Stars
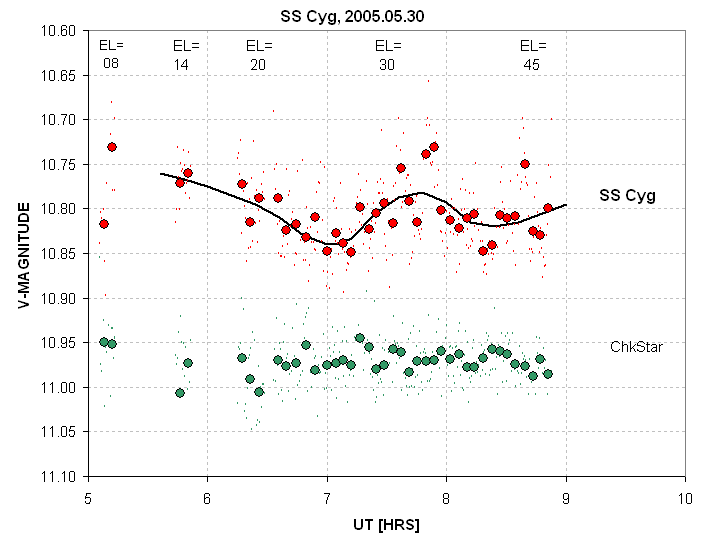
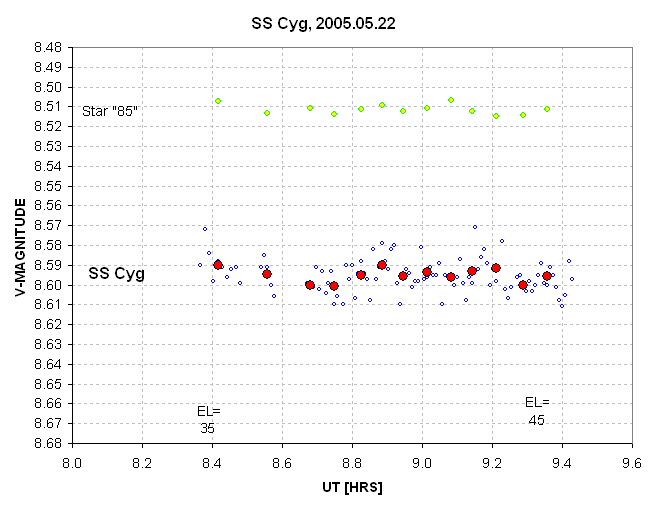
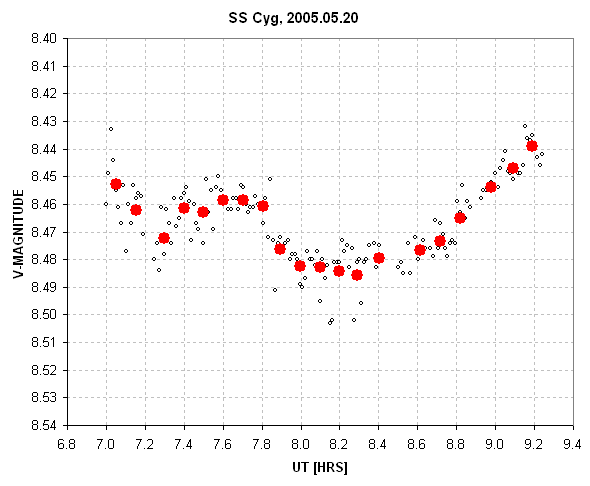
SS Cyg V-maganitude versus time for 2005.05.20 from 30-second exposures (small circles) and 4-minute averages (large red cicles). The 4-minute average data exhibit an RMS scatter of 1.8 mmag.
Real variuations are apparent on this date, with a peak variation of
45 mmag during a 2-hour observing interval. Compared to the night
before the average brightness faded 0.06 magnitude.
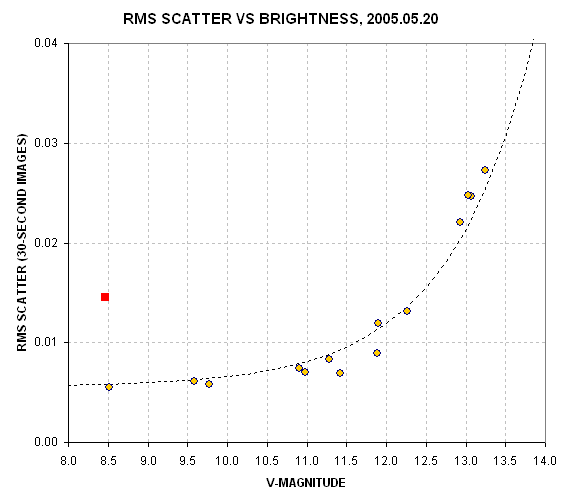
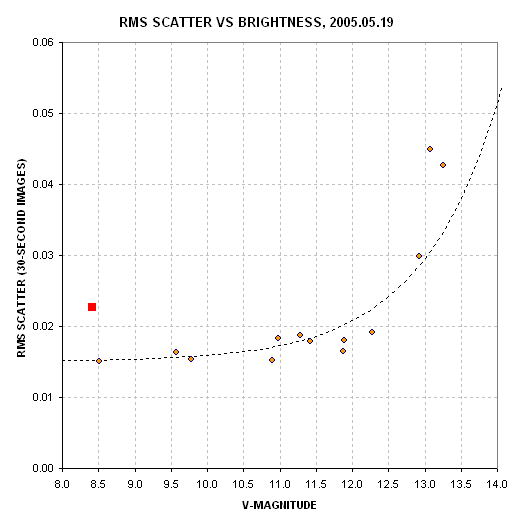
RMS scatter versus star brightness for 14 reference and check stars (small circles) and SS Cyg (red square). The dashed trace is a model that incorporates a constant term (due to scintillation) and a term inversely proportional to star flux.
This graph shows that for a star of SS Cyg's brightness each
30-second exposure exhibits a stochastic RMS scatter of 5 mmag.
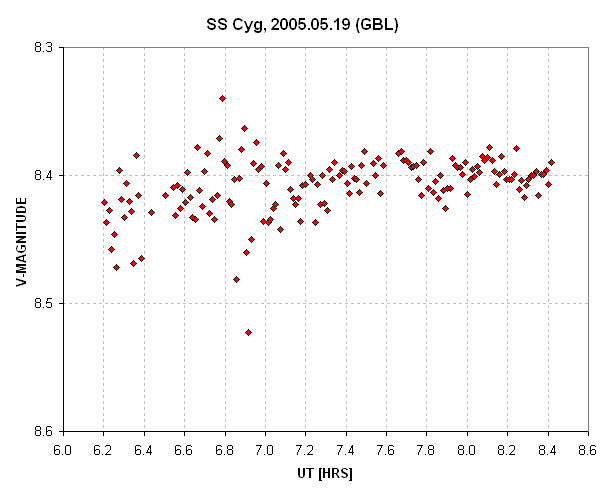
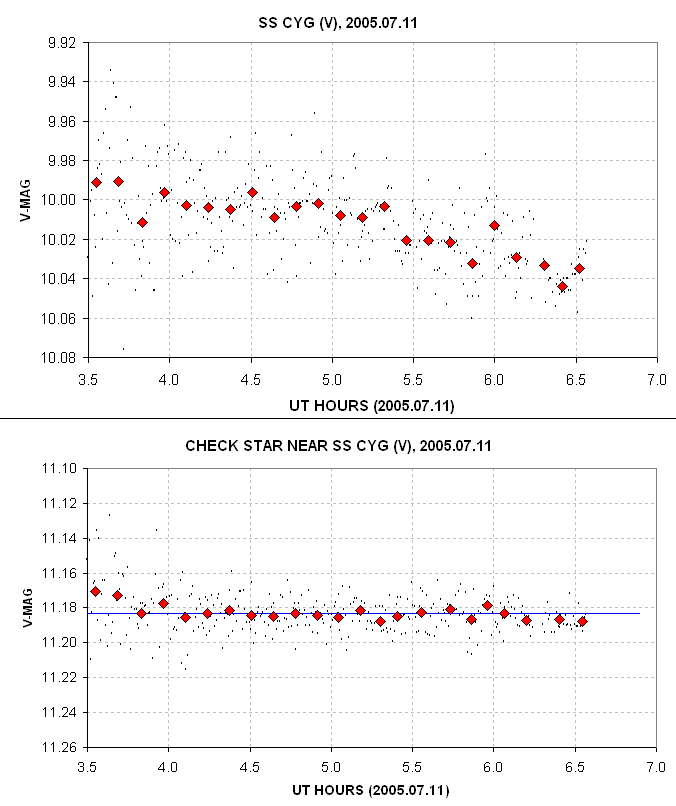
SS Cyg V-magnitude versus time for a 2-hour
observing window on 2005.05.19 UT.
It would appear that SS Cyg exhibited fluctuations from 6.7 to 7.0
UT. The reference and check stars did not exhibit counterpart
fluctuations.
RMS scatter of SS Cyg (red square), 7 reference
stars and 7 check stars. The dashed trace is a model that incorporates
a constant term (due to scintillation) and a term inversely
proportional to star flux.
SS Cyg's RMS scatter is slightly greater than predicted by the model
fit due to the brightness fluctuations at 6.7 to 7.0 UT. An orthogonal
subtraction of 15 +/- 2 mmag from 23 +/- 2 mmag yields 17 +/- 3.4 mmag
for SS Cyg additional RMS variation. The two check stars fainter than
13th magnitude might also be vairalbe, athough a more likely
explanation is that nearby interfereing stars had variable effect on
their magnitude solutions.
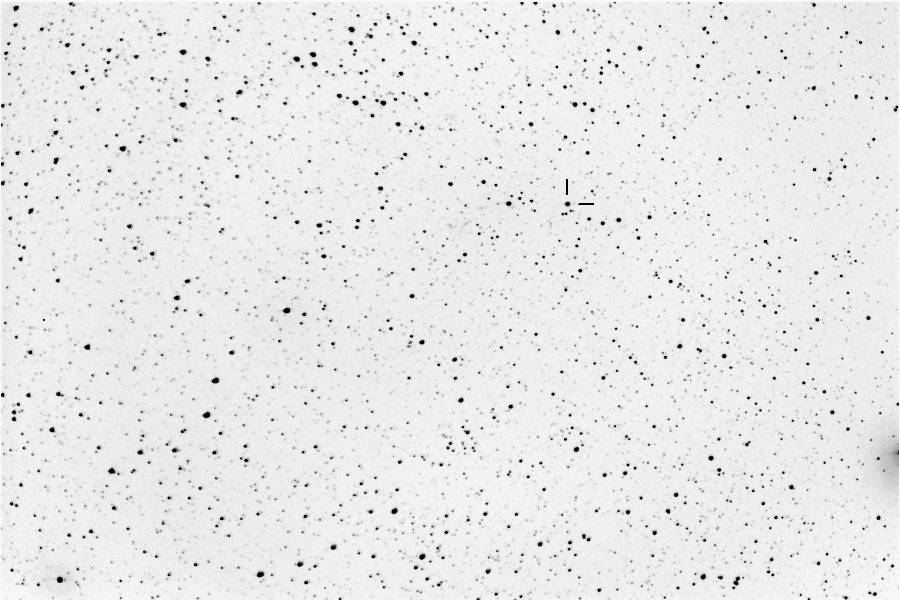
Finder chart, FOV 72 x 48 'arc; north up,
east left. [Celestron CGE-1400, HyperStar prime focus lens,
SBIG ST-8XE, V-filter, 5 minutes total exposure; 2005.05.22 UT; Hereford
Arizona Observatory]
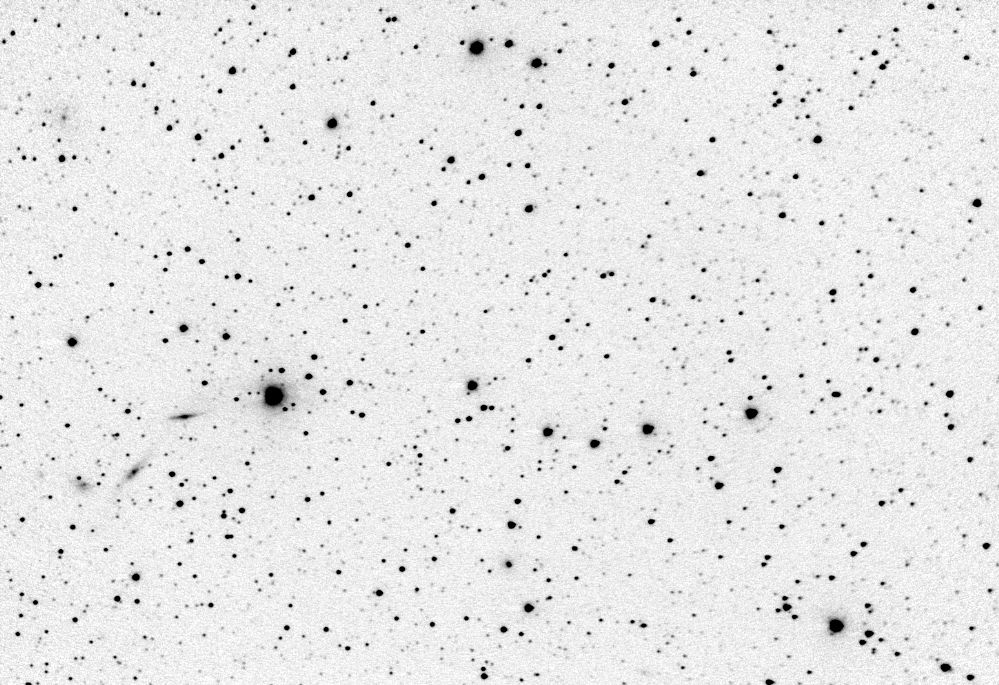
Zoom factor 3, to FOV = 23.6 x 16.3 'arc. Limiting magnitude = 19.0, FWHM = 4.0 "arc.
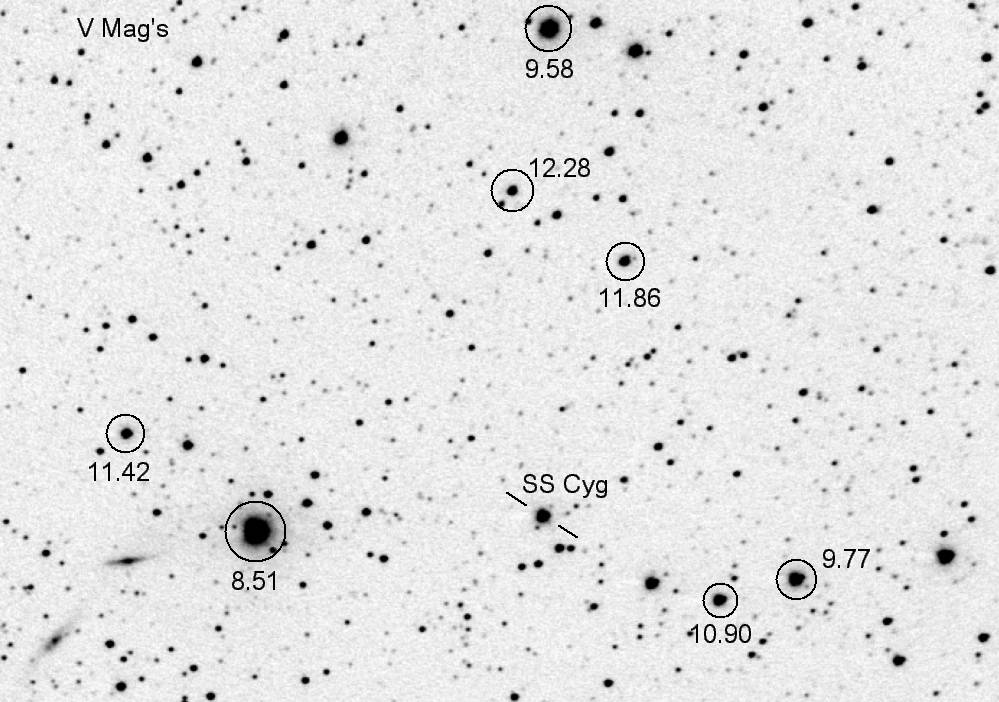
V-magnitudes
for reference stars used in my analyses. FOV = 11.2 x 7.9 'arc.
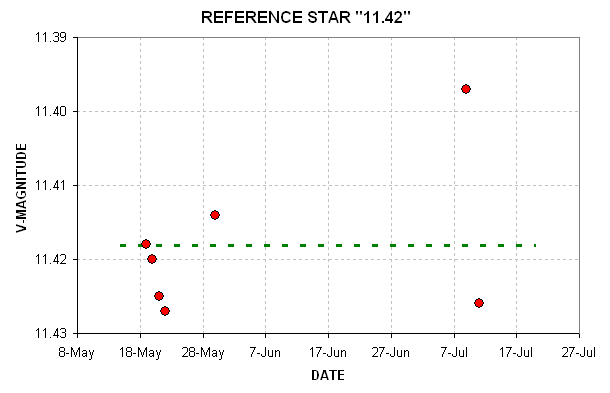
Note: An analysis of 6 observing dates shows that the star
labelled 11.44 should be 11.42. In addition, it has been suggested that
this star is variable. If it's variable on a timescale of >3 days,
then the amplitude is ~0.01 magnitude.
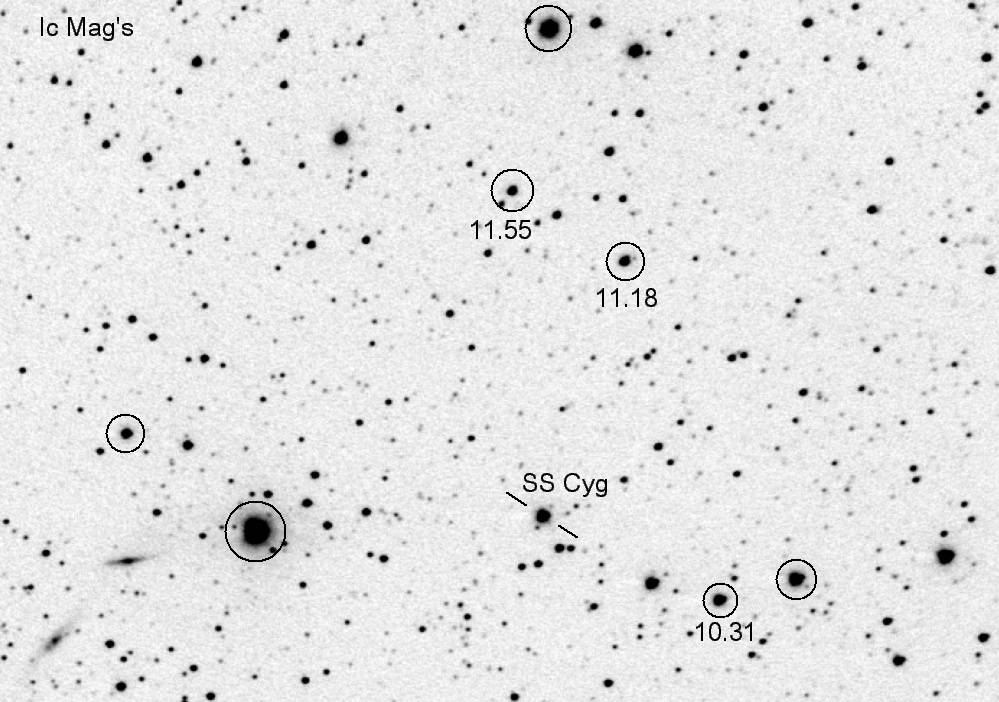
Ic magnitudes (from AAVSO SS Cyg web page). FOV = 11.2 x 7.9
'arc (north up, east left).
Variability of Reference Star 114
It has been suggested that Reference Star 114 is variable. I have
analyzed the 6 nights of my observations using the same analysis
procedure and reference stars in an attempt to measure this
variability.
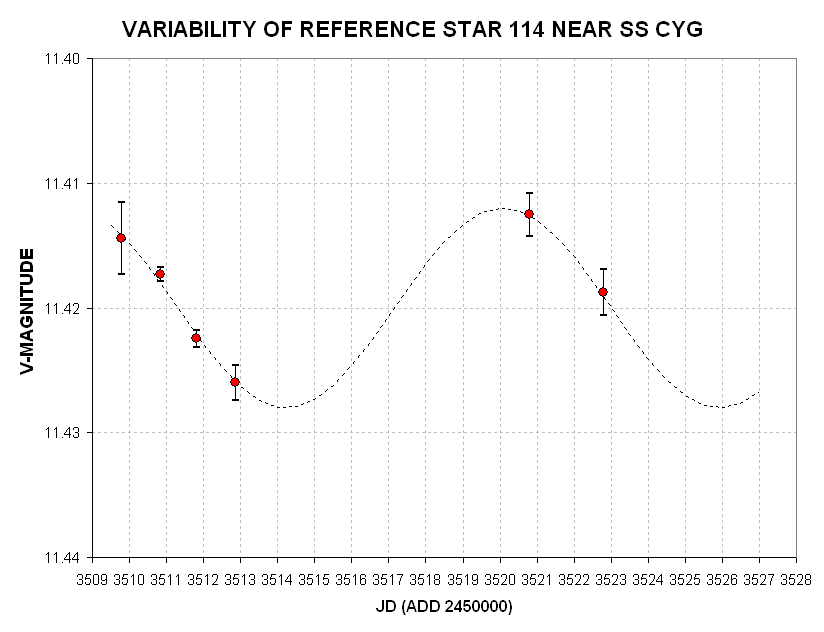
Light curve of Reference Star 114. The fitted sinusoid has an
amplitude (half of peak-to-peak) of 0.008 magnitude, period of 11.7
days, phase of 3511.3 and an average magnitude of 11.420. The error
bars correspond to standard errors of the nightly averages.
The above graph was obtained using the same 6 reference stars in an
ensemble photometry solution for Reference Star 114 (I used stars
having V-mag = 8.51, 10.90, 9.77, 11.86, 12.28 and 9.58, as listed and
identified above).
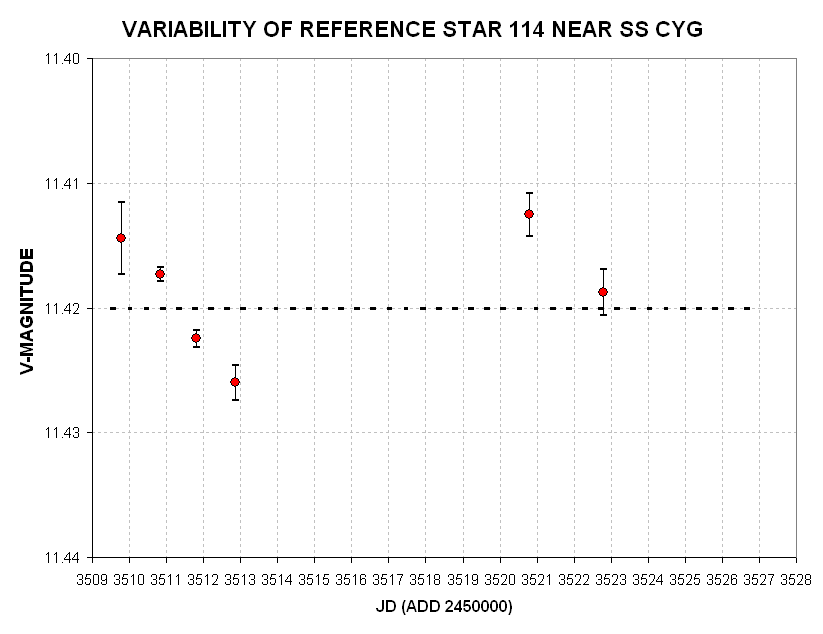
Zero amplitude alternative.
This zero amplitude solution is equally acceptable provided SE
estimates are wrong. However, a Bayesian estimation theory analysis
that adopts the SE's would render it orders of magnitude improbable, so
any interpretation of this limited data rests with how to view the SE
values.
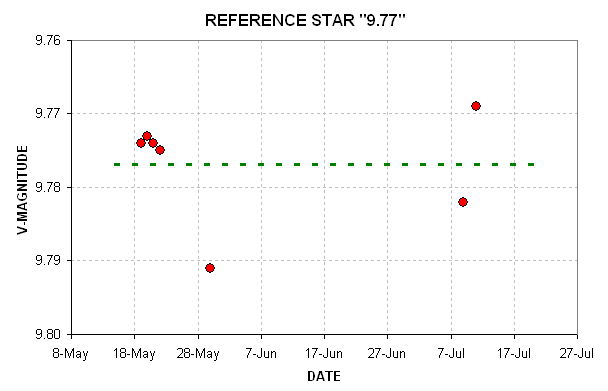
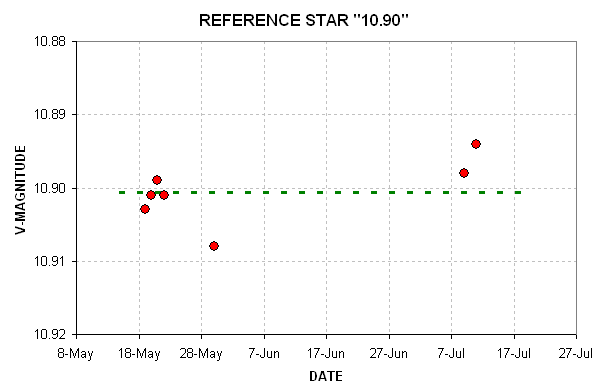
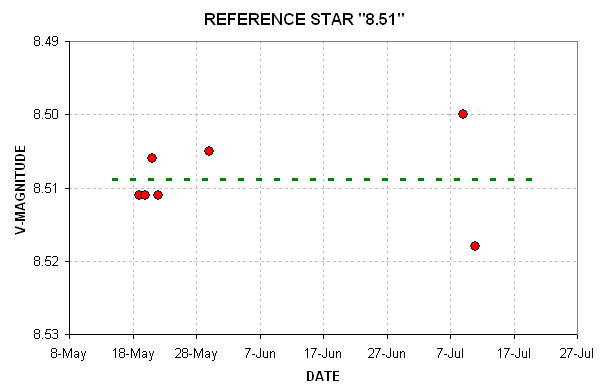
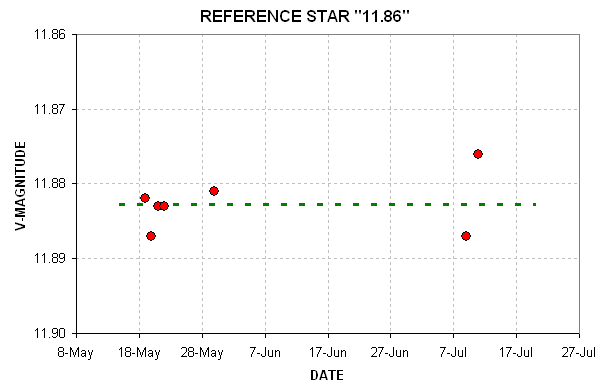
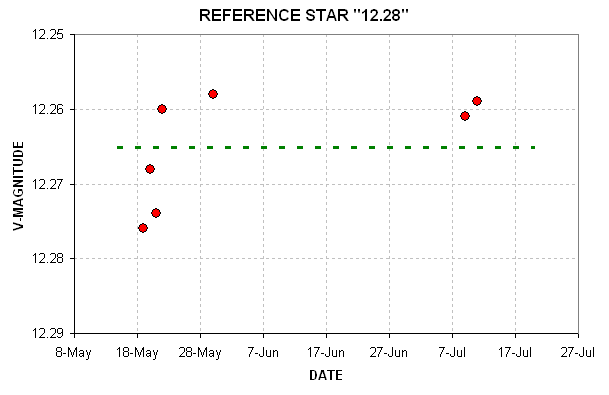
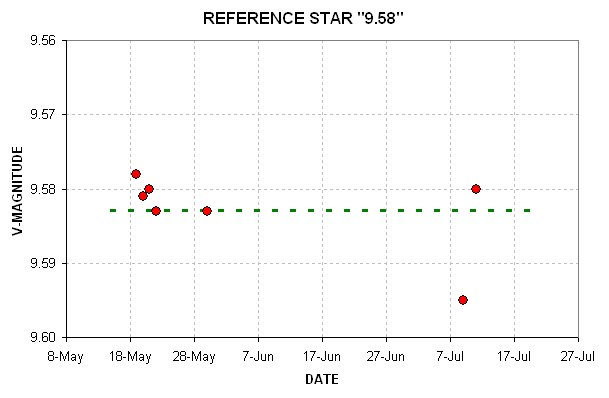
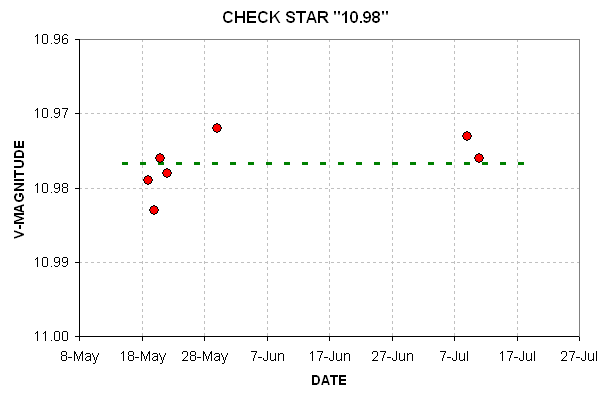
Variability of Other Reference Stars
I can't rule out variability of any of the other reference stars,
but if they're variable they sure don't show it in the following plots.
____________________________________________________________________
This site opened: May 19, 2005. Last Update: November 14, 2005