IAU Circular 8284 (dated 2004 February 9) announces a "new nebulosity" near M78, as reported by J. W. McNeil, Paducah, KY. It appears to be a "large reflection nebulosity" according to CCD red filter images taken by B. Reipurth and K. Meech (Univ. Hawaii). It has being referred to now as McNeil's Nebula.
Links internal to this web page:
False Color Images
Surrounding Nebulosity
Reference Star Selection
* Red Star Light Curves
Internal Checks of Data
Quality
Brightness of Nebulosity
* Light Echo Speculations
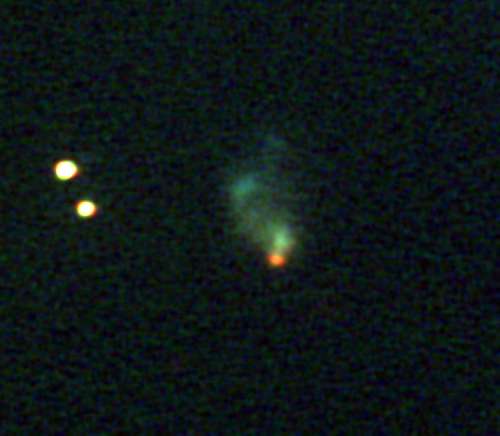
FALSE COLOR IMAGES OF RED STAR AND NEBULOSITY
Since the "source star" is greatly reddened, and is not even detectable with a B-filter, I have created false color images by treating I, R and V images as if they were R, G and B. I'll refer to these as "IRV false color."
Figure 1. IRV false color image. FOV = 3.7 x 3.2 'arc. As explained above, red is from the I-filter, green is from the R-filter and blue is from the V-filter. [Celestron CGE-1400, Cassegrain, focal reducer, AO-7 image stabilizer, SBIG ST-8XE CCD, color from combining R, V and B-filter images with exposure times 40, 15 and 28 min; 2004 February 14, 02 - 05 UT; Hereford AZ]
Even though the nebuosity is really red it appears to be green because
the red filter maps to green, etc. The only "message" from
this IRV false color image is that the star is very much redder
than the nebulosity.
I shall hereafter refer to the red source star as "LMZ 12", following
the suggestion of Reipurth and Aspin (2004).
Here's another IRV false color image, taken a few days earlier, and showing a larger sky area.
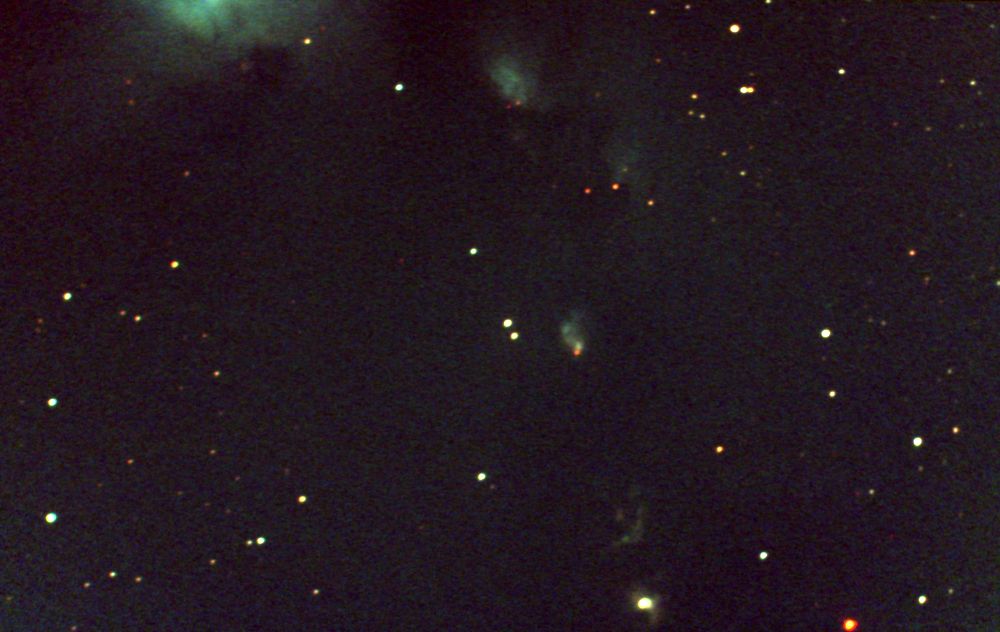
Figure 2. IRV false color image.. FOV is 23.2 x 14.6 'arc. [Celestron CGE-1400, Cassegrain, focal reducer, AO-7 image stabilizer, SBIG ST-8XE CCD, color from combining I, R and V-filter images with exposure times of 11, 14, 12 minute; 2004 February 10 UT, Hereford AZ]
REGION SURROUNDING "MCNEIL'S NEBULOSITY"
The following images show some of the M78 nebulosity near McNeil's Nebulosity.
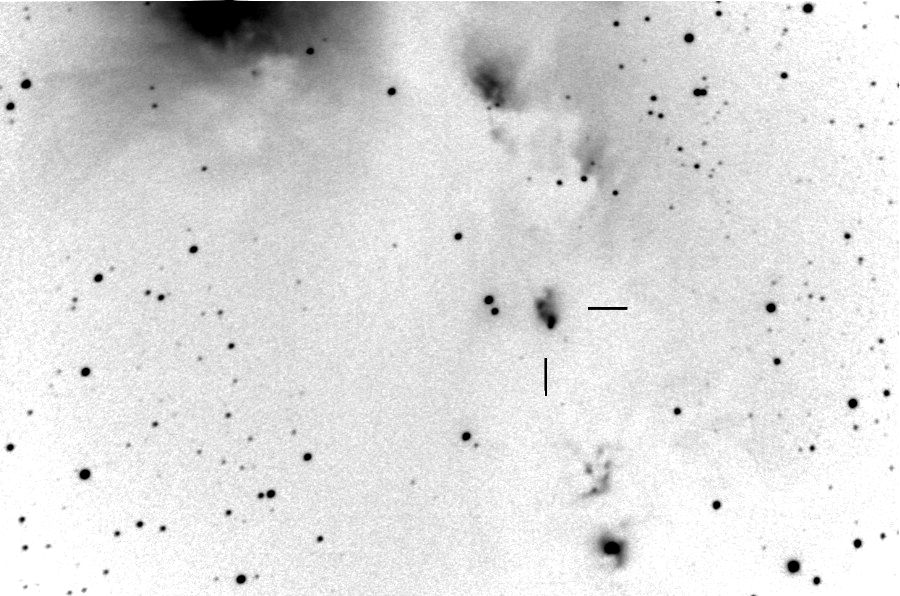
Figure 3. Negative of a set of unfiltered images totaling 27 minutes exposure. FOV = 23.5 x 15.5 'arc. The "new nebulosity" is indicated by the two lines. A corner of M78 is in the upper-left. North is up, east to the left. [Celestron CGE-1400, Cassegrain, focal reducer, AO-7 image stabilizer, SBIG ST-8XE CCD, Total exposure time is 27 minutes; 2004 February 12, 02.5 UT; Hereford AZ]
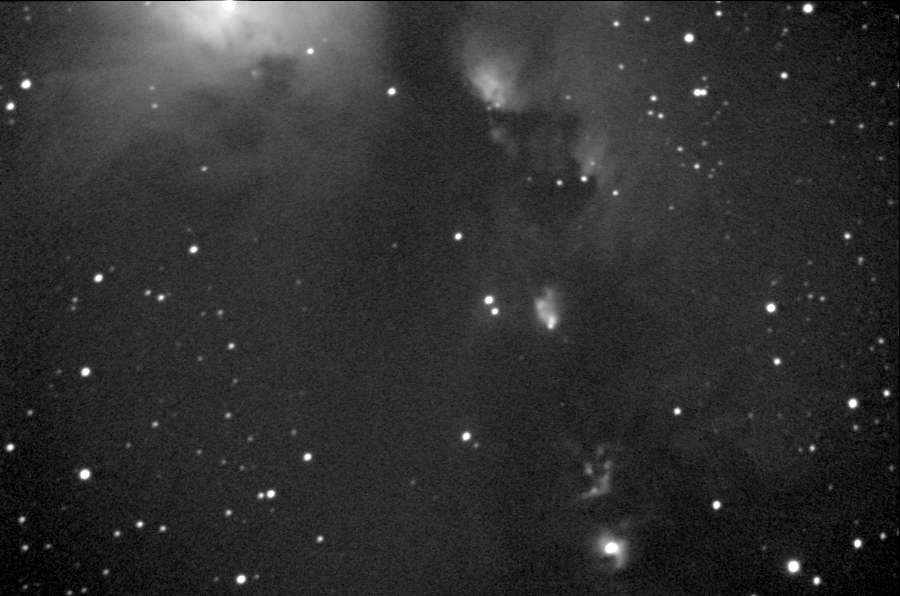
Figure 4. Same as above.
In order to monitor LZM 12 (the red source star in McNeil's Nebula) it is important to avoid the use of variable stars for reference stars. Since most stars are constant at the 0.1 magnitude level it is usually possible to identify variable stars by cross-comparing a set of several stars. I chose 5 candidate stars from Arne Henden's provisional photometric sequence for this purpose (shown in Fig. 10). Using all of them as provisional reference stars, and obtaining images for several dates, it is possible to calculate the RMS variation for each star and hope that only one or two "stand out" as having an excessive variation. In this case two stars had an excessive RMS about their average, so they were removed from the list of provisional non-variable stars in order to perform a second iteration using the other stars as the new set of provisional non-variable stars. The following graph shows the result of this final iteration.
Figure 5. I-filter magnitudes of the 5 candidate reference stars, using stars "D" and "J" as constant (Mi = 12.73 and 14.27 for "D" and "J" respectively). Stars "B" and "C" required sinusoidal fits while the others are adequately fit by constant values. Star letter designations are decoded in the text following Fig. 6.
In this figure it can be seen that all candidate reference stars are constant
except for stars "B" and "C", which vary with different patterns.
I conclude that among the 5 candidate stars for use as reference
stars only 3 are non-variable: A, D and J.
The above analysis has been expanded upon after 10 I-filter observing dates, and a new constant star has been selected as prefereable to Star "A". The three stars that I recommend for use as reference stars is shown in the next figure.
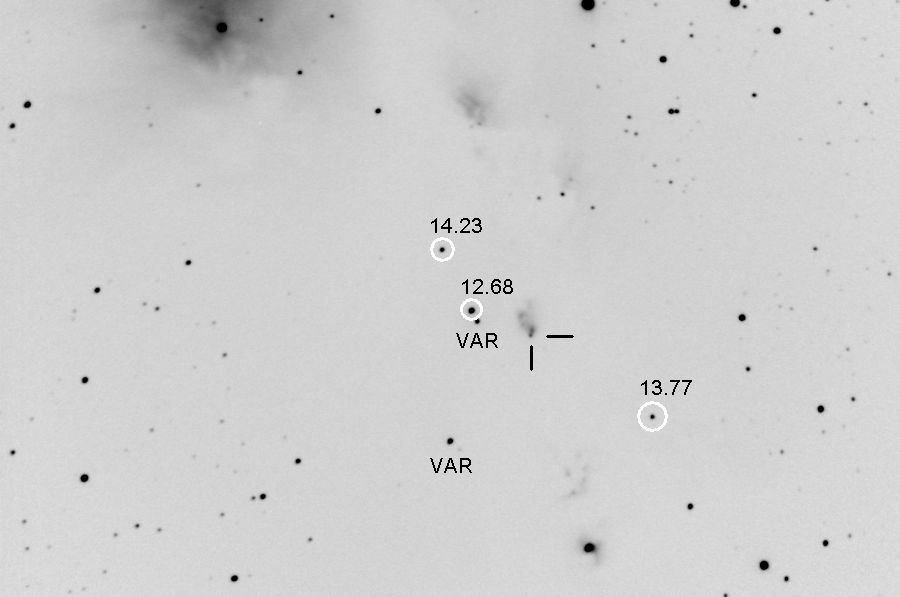
Figure 6. Suggested photometry sequence for I-filter observations.
The McNeil Nebula red source star "LZM 12" is at the intersection
of the two lines. Three stars have remianed constant during the first
10 I-filter observing dates and have the average I-filter magnitudes
indicated (RMS scatter for 10 dates is 0.040 magnitudes). The two
variable stars designated VAR have average I-filter magnitudes 13.45
(top) and 13.20 (bottom). The three suggested reference stars have
been zero shifted so that their magnitudes agree with Arne's sequence
(RMS difference = 0.01 mag). (This is an unfiltered image taken
February 12 UT.)
[In Fig. 5 I referred to stars A, B, C, D and J. I will
now identify these stars in Fig. 6. Star A is the bright star northwest
(upper-right) of the star labeled 13.77. Star B is the southern
variable (VAR), Star C is the northern variable (VAR), Star D is labeled
12.68, and Star J is labeled 14.23.]
LIGHT CURVE OF SOURCE STAR AT SOUTH END "LZM 12"
Arne Hendon has presented a provisional sequence for this region. I have used 3 stars in this sequence for determining R-band and I-band magnitudes of the southernmost red star (the putative source for the nebulosity). The measured and true (Arne) magnitudes for the reference stars exhibit a scatter of ~0.1 magnitude for both RED and INF. Since the nebulosity is close to LZM 12 on the north side I have "pixel edited the nebulosity away" in order to create a uniform brightness throughout the reference annulus. The following figure illustrates a result of this editing.
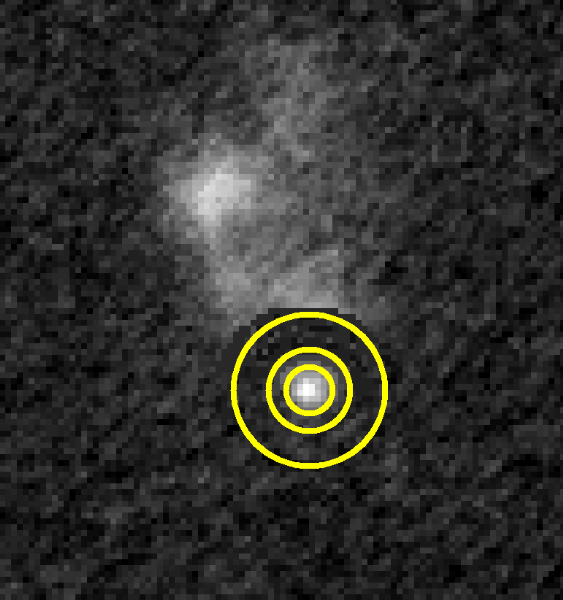
Figure 7. The photometry circles are centered on LZM 12 in this R-filter image (20-minute total exposure). Notice the pixel editing change to the nebulosity in the reference annulus north region. It doesn't matter that editing was crude within the gap annulus. Each pixel is 0.96 "arc in width. The signal circle radius, gap annulus width and reference annulus width values are 4, 3 and 6 pixels in this figure, which is a typical choice for the seeing conditions that existed on this night (FWHM = 3.3 "arc). [Celestron CGE-1400, focal reducer, SBIG AO-7 tip/tilt image stabilizer, SBIG ST-8XE CCD; 2004.03.16Z, Hereford, AZ]
The procedure of "editing pixels" is definitely not endorsed by professionals. Thankfully, I'm retired and am not bothered by the professional culture of "hypersensitivity to subjectivity" (and their fear of the personal pronoun and embrace of the passive verb). I claim that "if you know what you're doing, subjectivity is an important tool."
Every telescope/filter/CCD system will have a unique spectral response, casuing stars of one color to appear slightly brighter or faitner than others when compared with a standard system. I have not applied CCD Transformation Equation corrections for the observations on this web page. Therefore, my reference stars will have slightly different relative brightnesses from those measured by Arne Henden. The following I-filter image shows the set of reference stars that I've used for monitoring the brightness of the south end red source star. This set of magnitudes is "internally consistent" for my system, meaning that any single star could be used for establishing Mi values for any other star in the field.
Following are my measured magnitudes for LZM 12 after adopting I-band
reference star magnitudes 12.68, 14.23 and 13.77, and R-band reference star
magnitudes 13.80, 14.82 and 15.46. The column labeled Day# is "days after
Febriary 0, 2004."
I-BAND
YYYY.MM.DD
HH:MM Day#
Mi +/-
SEci SNR
2004.02.10, 05:23
UT 10.23 14.47 +/- 0.10 84
2004.02.14, 03:00 UT 14.13 14.47 +/- 0.07
126
2004.02.18, 02:45 UT 18.11 14.55 +/- 0.07
132
2004.02.22, 02:45 UT 22.11 14.60 +/- 0.08
95
2004.02.25, 03:35 UT 25.15 14.57 +/- 0.07
198
2004.02.27, 03:52 UT 27.16 14.52 +/- 0.06
245
2004.03.01, 04:28 UT 30.19 14.63 +/- 0.07
128
2004.03.15, 02:35 UT 44.11 14.74 +/- 0.10
72
2004.03.16,
03:12 UT 45.13 14.72 +/- 0.10 96
2004.03.28, 03:00 UT 57.15 14.55 +/- 0.09
104
2004.04.06,
03:15 UT 66.16 14.60 +/- 0.03 140
2004.04.13,
03:00 UT 73.13 14.69 +/- 0.04 109
2004.04.15, 02:55
UT 75.12 14.77 +/- 0.08 145
2004.04.19, 03:35
UT 79.15 14.605+/- 0.010 148
2004.04.24, 03:10
UT 84.13 14.40 +/- 0.10 115
2004.04.25, 03:10 UT 85.13
14.52 +/- 0.07 120
2004.04.27, 03:20 UT
87.13 14.68 +/- 0.15 64
R-BAND
2004.02.10, 02:53
UT 10.12 16.38 +/- 0.10 60
2004.02.14, 03:12 UT 14.13 16.26 +/- 0.09
63
2004.02.22, 03:05 UT 22.13 16.08 +/- 0.09
150
2004.02.25, 04:55 UT 25.20 16.62 +/- 0.09
82
2004.03.01, 04:25 UT 30.18 16.37 +/- 0.11
53
2004.03.16,
02:51 UT 45.12 16.53 +/- 0.09 64
2004.03.28, 03:40 UT 57.17
16.44 +/- 0.11 49
2004.04.06, 03:54 UT 66.16 16.64 +/- 0.15
30
SEci is an estimated "inter-calibration uncertainty"; it is the orthogonal sum of stochastic uncertainty (based on SNR) and components of calibration uncertainty that may vary from date to date. SEci does not include, for example, systematic calibration errors associated with my neglect of CCD transormation equation corrections for my instrument's spectral response (since CCD TE corrections will be the same for all dates provided I don't reconfigure my telescope system) .
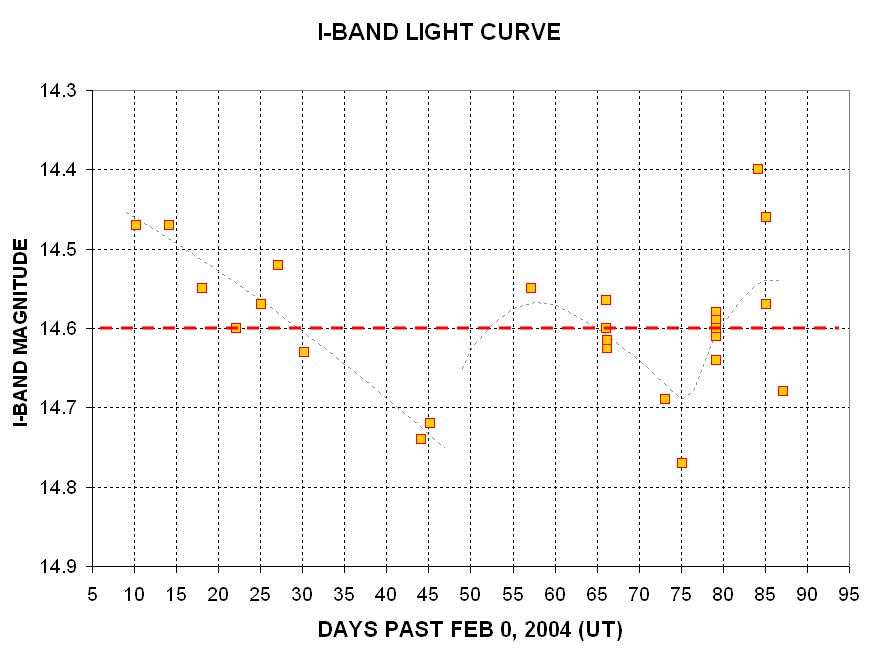
Figure 8. Light curve of star "LZM 12" using the I-filter measurements after adopting reference stars 12.68, 14.23 and 13.77 (I-filter). Two dates have especially good quality measurements (Day#66 and 79, each having equal weight to all data plotted for other dates). Two models are fitted to the data, a simple overall average (red dashed line) and a three component model (light dotted traces). The simple average red dashed line is preferred in the absenceof measurements by other observers confirming the 3-component trace.
Before the measurements on Day 79 I thought the two-component light curve interpretation was required by the data. However, there is such good agreement for the two dates when an extensive observing session and analysis was performed that I now believe the 2 and 3-component light curve traces as unlikely. Since I don't want to completely rule out the more complicatedlight curve traces I will retain a discussion of the "light echo" possibility that could account for them (presented as the last section of this web page).
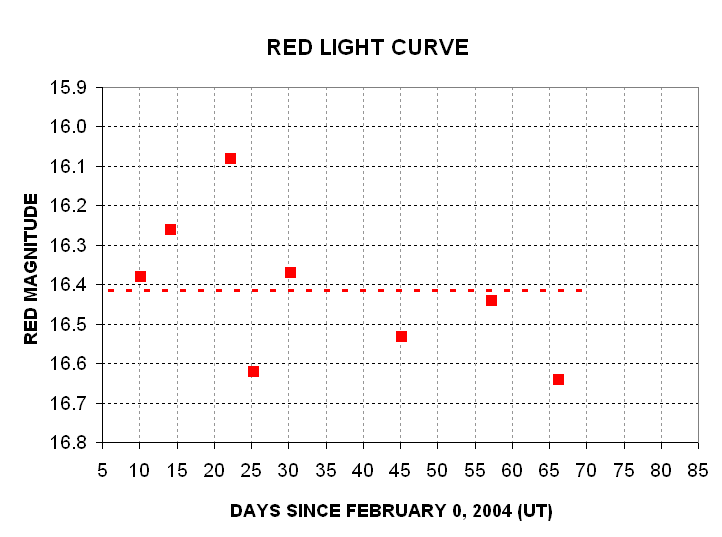
Figure 9. Light curve of the "red source star" using the R-filter
measurements after adopting the same three reference stars
as for I-filter except their magnitudes are adopted to be 13.80, 14.82
and 15.46 (versus Arne's 13.77, 14.87 and 15.44).
INTERNAL CHECKS RELATED
TO POSSIBLE AIR MASS DEPENDENCIES
The April 6 and April 19 measurements (Day 66 and 79) are good quality,
were made for a large range of air masses, and I have subjected them to
additional analyses to look for internal inconsistencies related to air
mass effects. The short answer is that none were found that would
invalidate the two light curves in the previous section.
The April 6 I-band observations were made over a large air mass range
(2.36 - 5.99) for the purpose of investigating air mass dependencies
for each of the three reference stars and LZM 12. The concern is prompted
by the unusually large extinction for most of the stars in this field,
and especially for LZM 12. With very reddened stars (due to high levels
of intervening dust extinction) there is always the possibility that the
effective wavelength for these stars is longer than for a normal star field,
and the question arises whether air mass effects will be more important
for the reddened star field than for normal star fields. To address
this question I present a plot of brightness versus air mass for the red
source star and the three reference stars used to establish LZM 12's magnitude.
Figure 10. Dependence of 3 reference stars and the red source
star brightness on air mass, based on measurements of April 6, 2004
(Day 66 on the scale of the previous figure).
Only one of the slopes in the above figure is statistically significant,
that for Ref1 (the brightest reference star), with a slope solution
+0.011 +/- 0.003 [mag/airmass]. LZM 12, for example, has a slope
fit of -0.008 +/- 0.014 [mag/airmass]. The R-I color values are (from
brightest to faintest in above figure) +1.08, +1.61, +0.66 (based on
Arne's sequence) and 1.83 (for LZM 12). The RMS deviations off the fitted
slopes obeys an expected pattern in which fainter stars have greater
measurement uncertainties. I conclude that for my observing system air
mass effects are too small to affect LZM 12 magnitudes that I have been
determining. (Incidentally, if my CCD transformation equation coefficients
departed form the desired values by large amounts the plot, above, it is
likely that the above plot would not look so good.)
The April 19 I-band measurements span an air mass range of 2.8 to 5.7
when atmospheric seeing afforded FWHM that ranged from 4.1 to 4.8 "arc. A
total of 44 were made using the tip/tilt image stablizer, which kept the
star field in the same location on the CCD chip for the entire observing
session. The following figure shows the intensity measurements for "Reference
Star 12.68" the 44 images ( after dark subtraction and flat fielding).
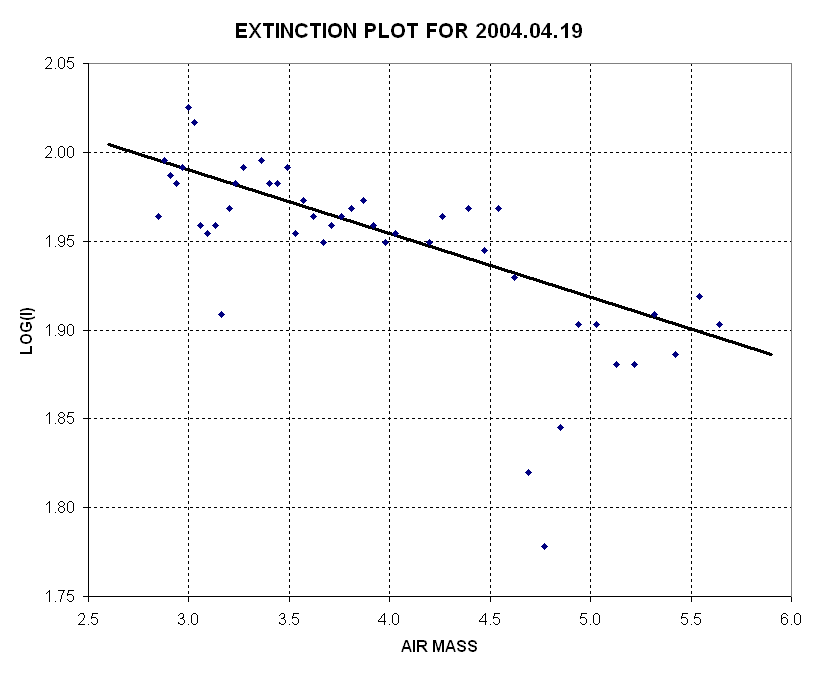
Figure 11. Intensity versus air mass for "Reference Star 12.68"
for the April 19 I-band observations. The slope of the fitted line is 0.090
[magnitudes/airmass].
This graph shows that on this date the reference star used to make the
plot faded with an extinction constant of about 0.090 [mag/airmass]. This
agrees with previous measurements. The reference star for these measurements
has B-V = 1.58 and R-I = 1.08 according to Arne's sequence. The star source
star "LZM 12" has R-I = 1.80 +/- 0.06, according to my measurements. The
other two reference stars used to calibrate LZM12 have R-I values of 0.658
(Reference Star having Mi=14.23) and 1.610 (reference star having Mi=13.77).
Thus, LZM 12 is redder than all of the reference stars used. This situation
will cause the LZM 12 measured I-band magnitude to depend on air mass at
some level. In order to evaluate the magnitude of this dependence it is necesssary
to plot apparent magnitude of LZM 12 versus air mass. The 44 images
were placed in 7 groups and median combined.
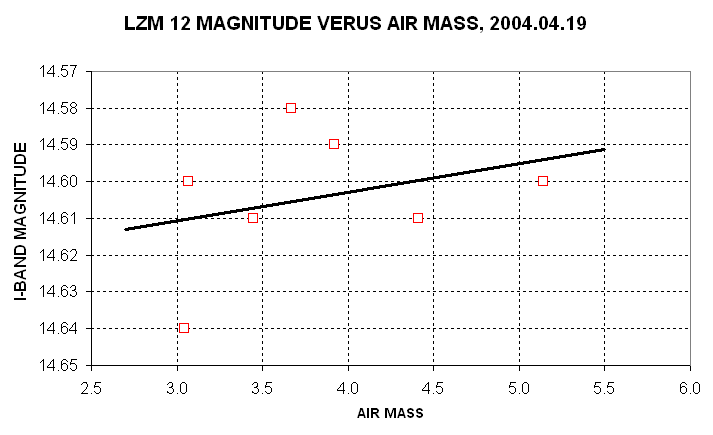
Figure 12. Source star LZM 12 I-band magnitude versus air mass
using Apriol 19 data. The leasst squares fit has slope = -0.008 +/- 011 [magnitude/airmass].
The measured dependence of LZM 12 brightness on air mass is statistically
insignificant. However, if the measured dependence were adopted then it
would be necessary to adopt a standard air mass and then adjust each observing
date's LZM 12 measurement to that air mass value, such as m = 2.5. Let's
adopt this air mass as a standard for the sake of evaluating the level of
corrections that might have to be applied. Some measurements in February
were made with m = 1.31, so they should be corrected downward (brighter)
by an amount 0.01 magnitude. This correction is much smaller than the uncertainty
(and scatter) of all measurements. I conclude that the air amss dependence
of all measurements made to date do not require an airmass correction to
compensate for the greater redness of LZM 12 in relation to the three reference
stars used in its measurement.
LIGHT ECHO SPECULATIONS
Prior to the April 19 measurements the following I-band light curve for
"LMZ 12" prompted Michael Richmond to speculate that maybe the "re-brightening"
after ~Day#47 was due to a "light echo."
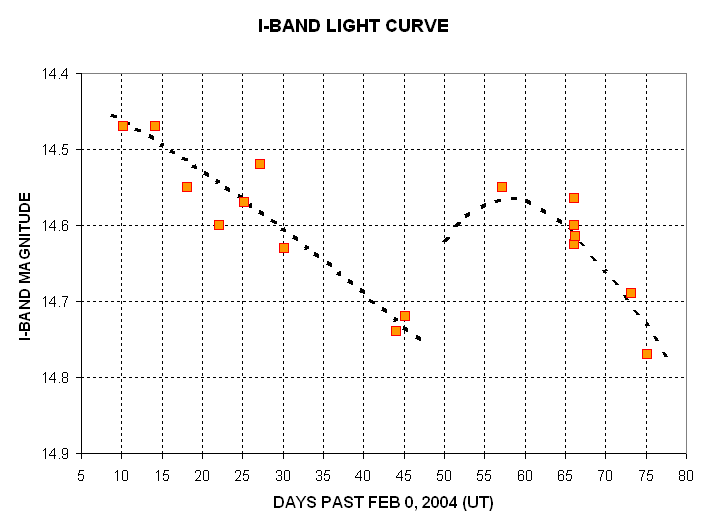
Figure 13. Light curve prior to April 19 measurements.
Although this two-component light curve model is rendered less likely by the April 19 measurements there is a small possibility that it is correct. Therefore I shall retain in this section a discussion of an investigation of other evidence that a "light echo" might have appeared after ~Day#47. If future measurements cast further doubt on a varying brightness for LZM 12 I will delete this section from the web page.
Referring to the I-filter light curve (above) one interpretation of the data is that there are two "outbursts." The first group of observations caught the outburst AFTER maximum, which might have occurred in January, 2004. The second "outburst" peaked at about March 29, 2004, and was followed by a fading with a rate comparable to the earlier fading. Michael Richmond has suggested that this "second outburst" might possibly be a "light echo." If so, then the reflecting cloud can be imagined to be more than one light month behind the source star, or two light months to the side, or some equivalent location on a parabolic surface. The projected brightness of the first outburst is ~1/3 magnitude fainter than the new outburst.
If this speculative interpretation is correct, then most of the current
flux is coming from a region with a cloud with a larger solid angle than
the first (star sized) one. Is there any evidence for a larger size after
Day50 than before?
First, consider the east/west response width of LZM 12 in comparison to
nearby stars. If there is currently a light echo then LZM 12 will appear
to have a broader angular width than nearby stars. The following figure shows
that in fact it does.
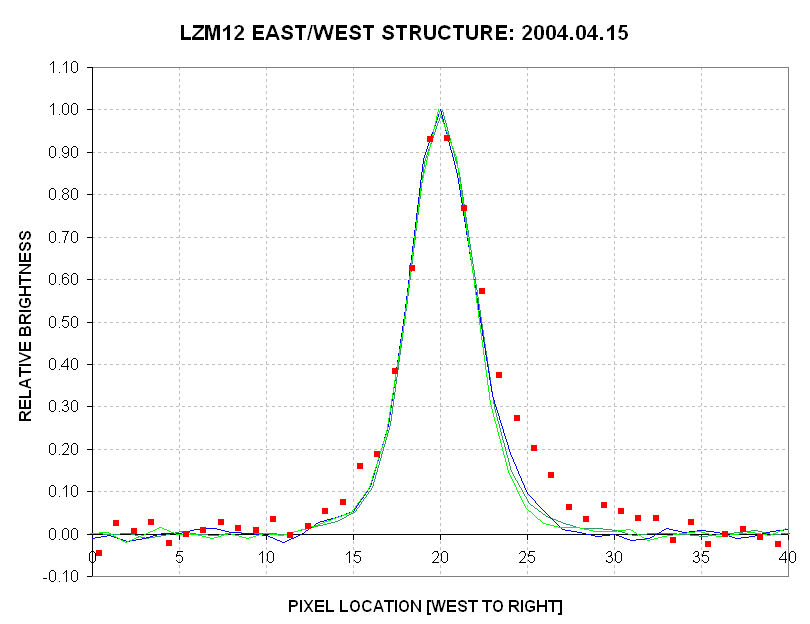
Figure 11. Apparent east/west response for red source star "LZM 12" (red squares) and 3 nearby stars (line traces) for Day75 . Each pixel is 0.96 "arc. The FHWM for stars is 4.25 "arc and for LZM 12 it is 4.73 "arc. [Based on 14 1-minute exposures, 2004.04.15 UT]
The observations for Day75 show a wider spatial distribution for the red
source star that is wider than for nearby stars. Orthogonal subtraction
of nearby star FWHM values from the apparent LZM 12 FWHM yields an estimated
actual LZM 12 FWHM = 2.1 +/- 0.4 "arc. Moreover, the flux distribution is
assymetric and exhibits a west wing. The simplest explanation is that there's
another component of lower total flux on the west (which might correspond
to LZM 12) and the main component is the reflected light from a dust cloud
that is located on the east side of LZM 12. (Note: Both images for this
date give the same qualitative result shown in Fig. 11.)
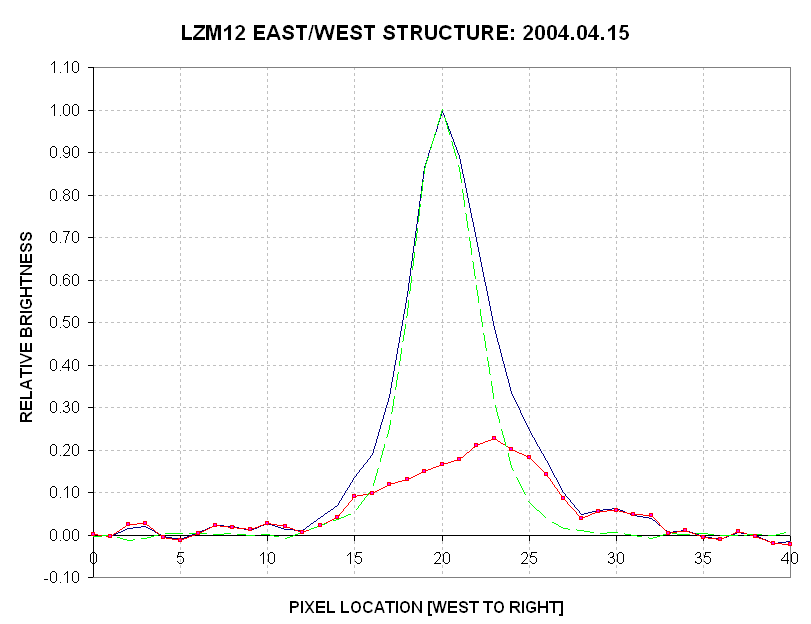
Figure 12. Suggested decomposition of Fig. 11 total apparent brightness
distribution (blue) for the region centered on star LZM 12 into two components,
one for only the star LZM 12 (green dash) and the other associated with
nebulosity (red) some of which might be a light echo. The PSD for this observign
session is the same as the blue trace, so the red trace representing nebulosity
is broader than actual due to the PSD having a finite width. (A 0.4 pixel
shift was needed for alignment of the star-only and LZM 12 profiles, which
appears to reduce "noise" for the LZM 12 trace.)
Of course, LZM 12 may appear to have a broader width due to nearby nebulosity
that is not producing a light echo. Therefore, itis necessary to compare
this apparent response of LZM 12 during the putative light echo period
with the response from before then.
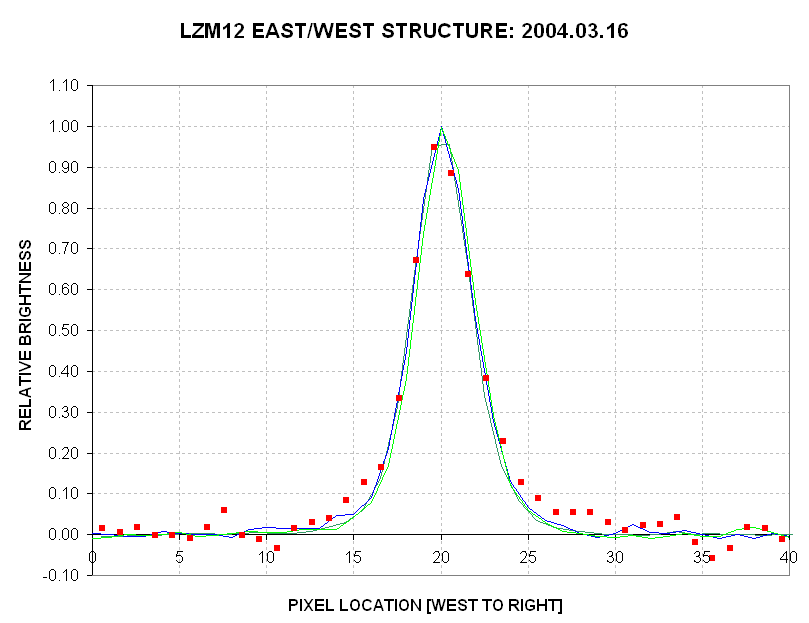
Figure 13. Brightness distribution before second "outburst" (light
echo), on March 16, 2004. The LZM 12 star region (red squares) and three
nearby stars (continuous traces) have different widths and levels in the
wings.
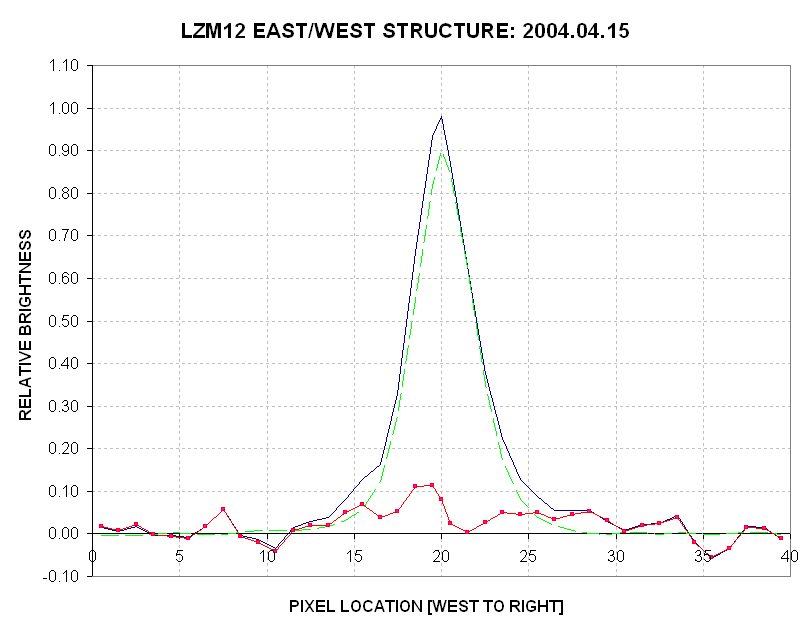
Figure 14. Suggested decomposition of Fig. 13 total apparent brightness
distribution (blue) for the region centered on star LZM 12 into two components,
one for only the star LZM 12 (green dash) and the other associated with
nebulosity (red). The PSD for this observign session is the same as the
green trace, so the red trace representing nebulosity is broader than actual
due to the PSD having a finite width.
As suspected if the second "burst" is a light echo, the nebulosity component
close to the star LZM 12 is smaller before the putative light echo than
afterwards. This is illustrated more clearly in the next figure, which
shows the nebulosity component before and after the second "burst."
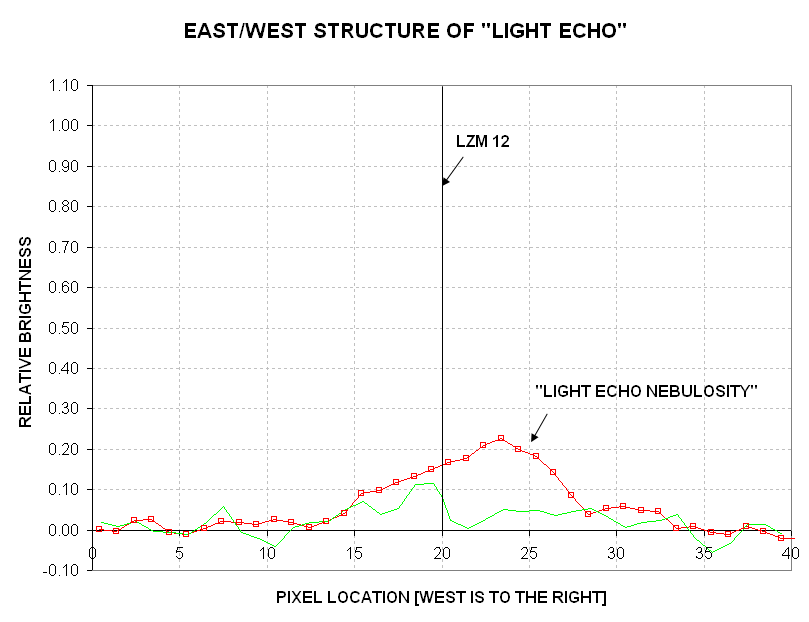
Figure 14. Suggested location of "light echo" nebulosity,
based on "before" and "after" nebulosity distributions along an east/west
line that goes through the star LZM 12. The red trace is for 2004.04.15
(Day75), the most recent observation date, and the green trace is for 2004.03.16
(Day45), the last day before the second "outburst."
As stated earlier, the distributions in the above figure have not be deconvolved
for my system PSD. However, the distribution that I identify with the "light
echo" is much brroader than the PSD, so a deconvolution would not change
the above plot significantly.
![]()
The following image shows the surface brightness of the nebulosity with a photometric red filter.

Figure 10. Surface brightness [magnitudes per square "arc] for three locations of the McNeil Nebulosity using a red filter. [9 minute total exposure, 14-inch Celestron CGE1400 telescope, AO-7 image stabilizer, Custom Scientific red filter, SBIG ST8XE CCD, 2004.02.22 UT, Hereford, AZ]
Calculating surface brightness from a reference star is non-trivial since the star is a point source and a nebulosity is uniformly bright across the ssignal circle aperture. For my system a correction of 3.32 magnitudes correction was required, which is based on my use of 5 pixel signal circle radius, a PSF with FWHM = 4.47 pixels, and an image scale of 0.97 "arc/pixel (i.e., must add 3.32 magnitudes to the naive reading on a distributed source). In making these surface brightness emasurements the reference annulus had to be "pixel edited" to background values (a subjective process, but unavoidable).
Another way to descibe the nebulosity's surface brightness is to state
that the brightest region ("19.0" in the above figure) yields
a maximum of 102 counts after 9 minutes total exposure with a 14-inch
Schmidt-Cassegrain aperture (10% blockage by the secondary)
and a red photometric filter in front of a SBIG ST8XE CCD set to
bin1x1 and cooled to -25 C. The nebulosity at location "19.0" has
a FWHM of 7"arc (after correcting for the 4.3"arc PSF FWHM at the
time of this observation), so if the "atmospheric seeing" had been
better the nebulosity would have produced only a slightly greater
counts maximum than 102. The broader nebulosity regions at "19.6" and
"20.0" produced excess counts of 56 and 35 counts.
OTHER WEB PAGES CONCERNED WITH McNEIL NEBULA REGION
Here's a great web page that summarizes many people's observations:
http://spiff.rit.edu/classes/phys440/lectures/new_star/new_star.html
http://xxx.lanl.gov/abs/astro-ph/0403667 (article by Reipurth and Aspin, 2004)
Return to my AstroPhotos
web page.
You may e-mail me at B L G A R Y @ u m i c h . e d u
This site opened: February 10, 2004. Last Update: August 25, 2006