VAR VUL 05 (M27)
Bruce L. Gary (GBL)
2005.09.25
List of Internal Links
2005.09.25 C filter
2005.09.18 C filter
2005.09.15 C filter
2005.09.13 C filter
2005.09.12 C filter
2005.09.01 BVRC filters (32-inch)
Henden's Photometric Sequence & Finder Chart
Flux Subtraction Procedure for Removing Effect of Star R
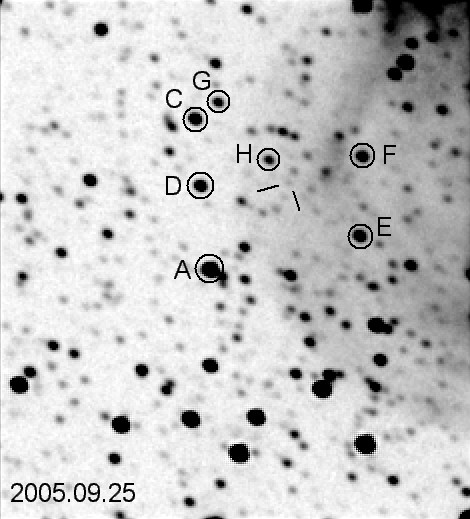
2005.09.25 UT. Clear filter, 18-minute
total exposure. FOV = 4.0 x
4.5, north up, east left. "VAR Vul 05" is so close to Star R that they
appear as one star. "VAR Vul 05" has CV = 20.5 +/-0.3, using a "flux subtraction" method, which assumes
values for Star R's mag & color (V=19.38 +/- 0.06, V-R = 0.18 +/- 0.10 and B-V
= +1.24 +/- 0.10), and assuming VAR's color (B-V = -0.56 +/- 0.15), and
assuming values for my telescope system's star color response (derived from the Henden sequence near the variable). [Celestron 14-inch, Hereford, AZ]
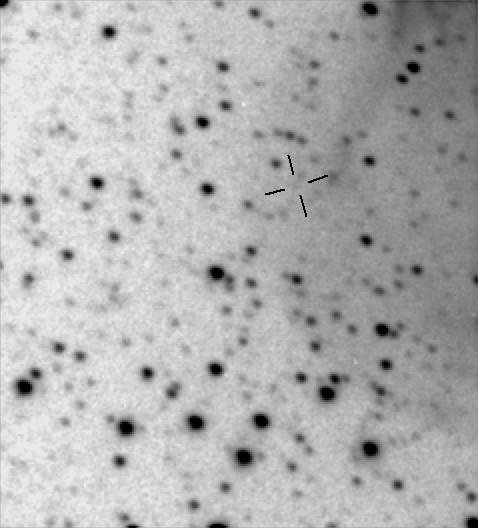
2005.09.18 UT. Clear filter, 18-minute
total exposure. FOV = 4.0 x
4.5, north up, east left. "VAR Vul 05" is so close to Star R that they
appear as one star. I haven't processed this image to establish a
magnitude for the variable but the image looks similar to those when
VAR Vul 05 had CV ~ 19 or 20. [Celestron 14-inch, Hereford, AZ]
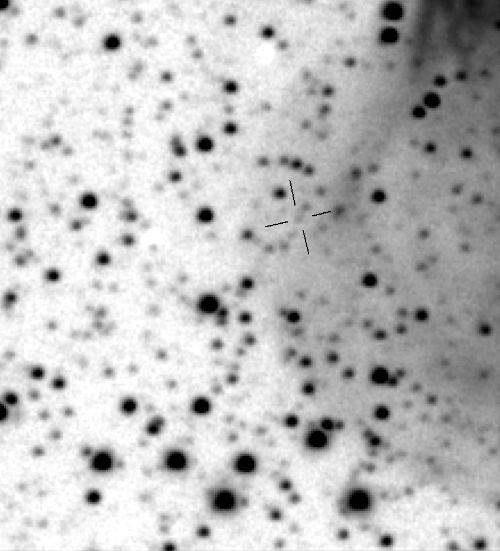
2005.09.15 UT. Clear filter, 20-minute total exposure. FOV = 4.0 x
4.5, north up, east left. "VAR Vul 05" has CV = 18.7 +/-0.4, assuming
Star R's mag & color (V=19.38 +/- 0.06, V-R = 0.18 +/- 0.10 and B-V
= +1.24 +/- 0.10), assuming VAR's color (B-V = -0.56 +/- 0.15) and
assuming values for my telescope system's star color response. [Celestron 14-inch, Hereford, AZ]
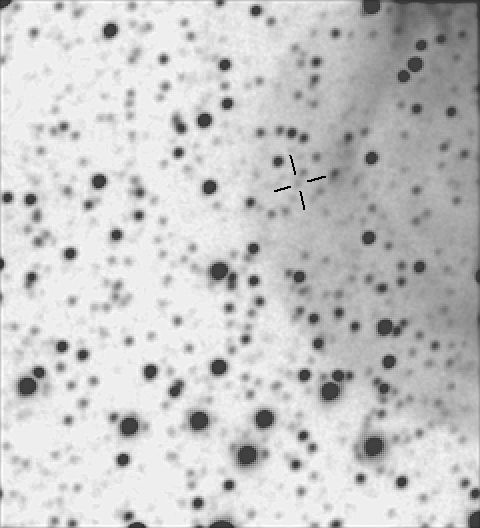
2005.09.13 UT Unfiltered, 48-minute total exposure. FOV = 4.1 x
4.6, north up, east left. "VAR Vul 05" has CV = 21.0 +/- 0.5, assuming
Star R mag's & color and my telescope system's star color response
characteristics. [Celestron 14-inch, Hereford, AZ]
2005.09.12 UT. Unfiltered, 70-minute exposure, 2005.09.12, 04 UT. FOV ~4 x 5 'arc, north up, east left. CV = 21.6 (68% probability that 20.9 < CV < 23.6), after
subtracting flux of unresolved star R (using predicted flux for the
star's magnitude and color). The variable is assumed to have a color
B-V = 0.56.
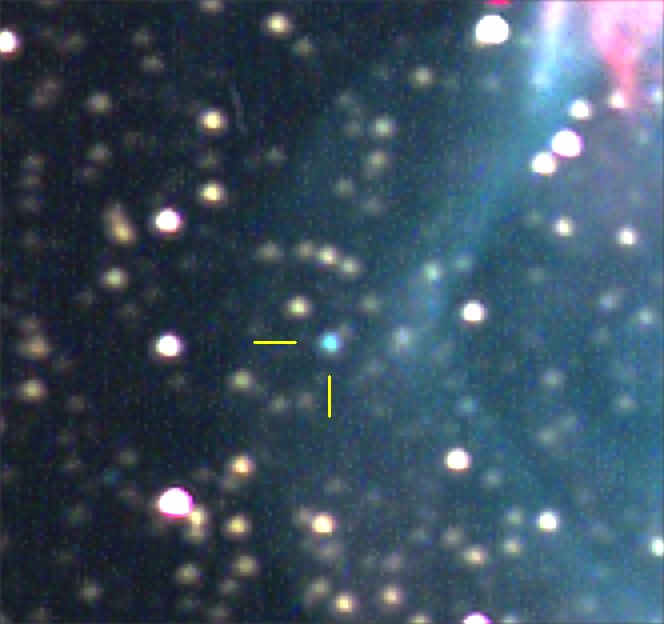
Figure 2. 2005.09.01 UT. The blue star at the line interection is VAR Vul 05. FOV = 2.9 x 2.6 'arc, northeast upper left. [2005.09.01, 06 UT; Dave Healy's Junk Bond Observatory 32-inch RC, Sierra Vista, AZ]
Variable's brightness is B = 17.58 +/- 0.05 (stochastic SE), V =
17.02 +/- 0.05, R = 16.87 +/- 0.05; therefore, B-V = +0.56 +/- 0.08 and
V-R = +0.15 +/- 0.07.
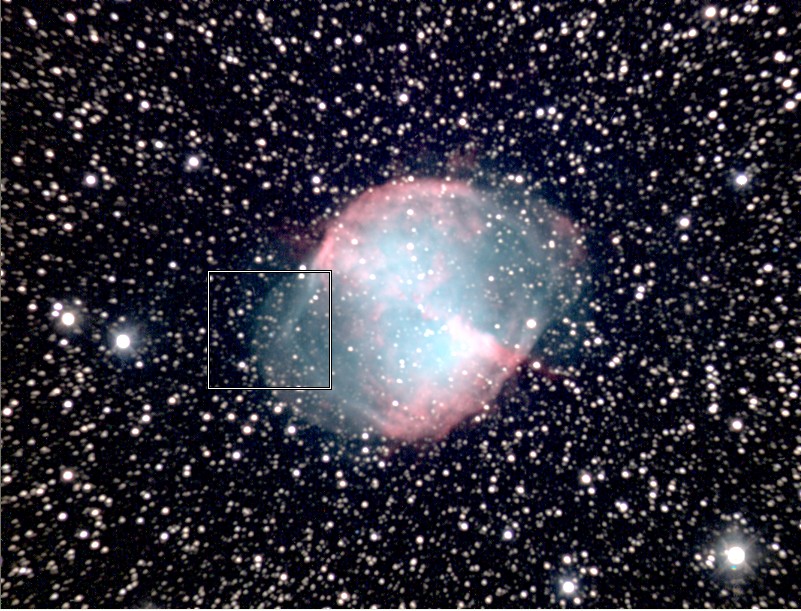
Figure 1. FOV = 18.0 x 14.0 'arc (crop of original), northeast at upperleft. The square shows the FOV of the previous image. [Same telescope, RGBL exposure times 6, 6, 6 and 10 minutes].
Henden's Photometric Sequence
The following high resolution image shows the stars included in Arne Henden's photometric sequence.
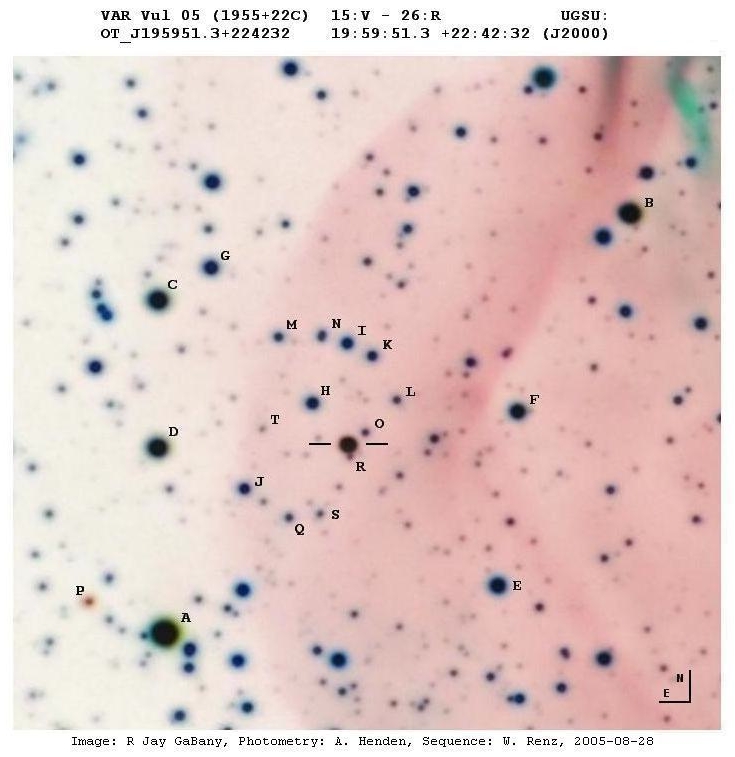
Figure 3. Finder chart for Arne Henden's photometric sequence
for the VAR Vul 05 region. Star "R" is 2.8 "arc south of the variable
VAR Vul 05 (indicated by horizontal lines).
And the next image shows the photometric sequence results that Arne produced.
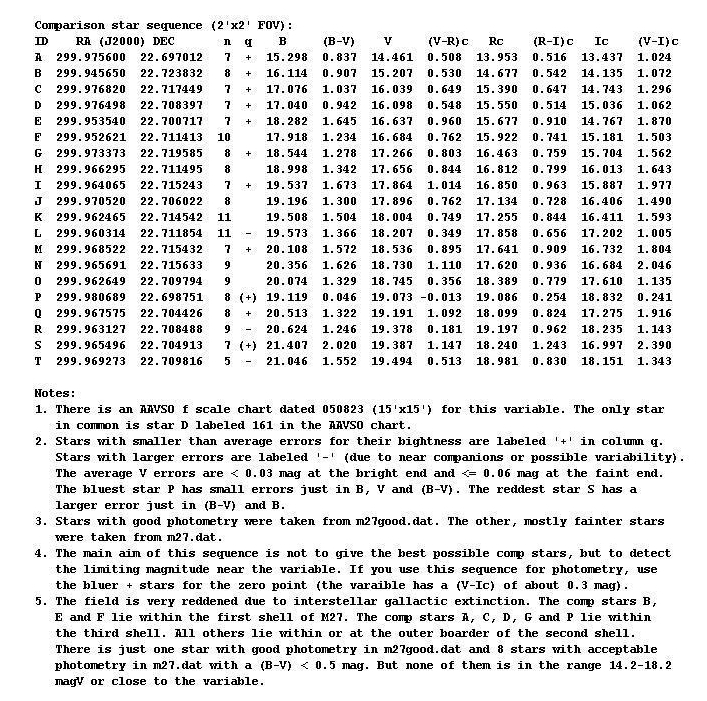
Figure 3. List of magnitude measurements (and colors) derived by Arne Henden.
Flux Subtraction Procedure for Removing Effect of Star R
I've written this section at the request of Wolfgang Renz, who probably
thought the "flux subtraction" procedure for removing the influence of
Star R would be fairly simple. Little did he know that it's quite
involved. I expect that all observers interested in the flux
subtraction procedure will give up after a couple paragraphs. That's
OK, I like writing.
The point-spread-function (PSF) for stars in images with exposure times
of 2 to 4 minutes have FWHM ~3.5 to 4.5 "arc. This barely allows me to
remove the effect of Star "O" but Star "R" is too close to the variable
to be excluded from my photometry measurement. Therefore, my photometry
aperture reading of star flux includes both the variable and Star "R."
This section describes a procedure I have used to calculate the
variable's flux, and hence magnitude. I will describe the procedure
using a specific example, an unfiltered image taken 2005.09.12 UT with
my 14-inch Celestron (next figure).
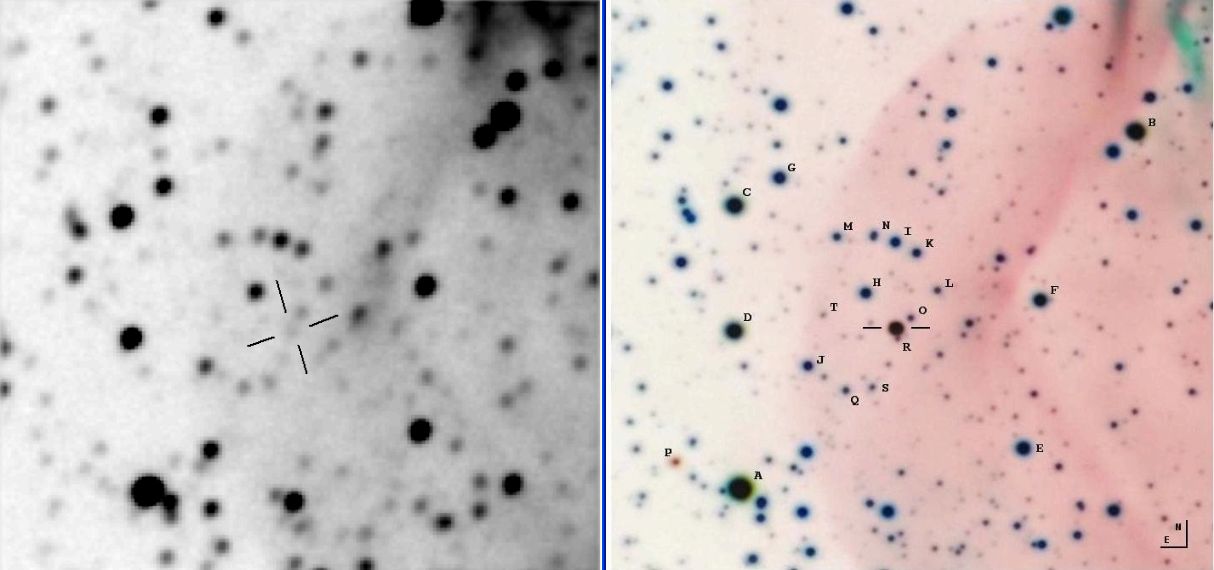
Figure 4. Left panel is my 2005.09.12 image (70-minute total
exposure time, 14-inch Celestron) cropped to show the same FOV as the
image by R. Jay GaBany used to identify the Henden photometric sequence
stars. My image has a PSF with FWHM = 4.0 "arc, and the cross-hairs show where Star R and the variable are located.
My procedure begins with a measurement of the flux (also called
"intensity" in MaxIm DL) of the combined "variable plus Star R" (which
are 2.8 "arc apart). In doing this I use a small aperture for two
reasons: 1) to avoid influence by Star "O" and 2) to increase SNR on
the flux measurement. Since a later step requires the use of a star's
flux with a large aperture I determine a "recovery fraction" for the
small aperture; this is a number less than 1 and it is determined using
a bright (unsaturated) star. For this example I chose photometer
settings that had a capture fraction f425 = 0.792 (where the 425 means
the signal aperture has a radius of 4 pixels, the gap has a width of 2
pixels, and the sky background annulus has a width of 5 pixels). The
0.792 means that whatever flux readings I make with this small aperture
must be divided by 0.792 in order to arrive at what would have been
measured if I had been able to use a larger photometer aperture. (This
may seem like a lot of extra work, but the SNR is 2.0 times greater by
using this small aperture, and to achieve that additional SNR without
employing small apertures would require a 4-times longer exposure.)
The next image shows the MaxIm DL photometry circles centered on the combined "variable plus Star R."
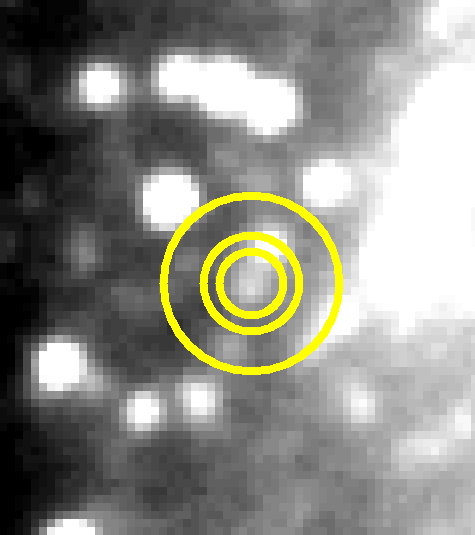
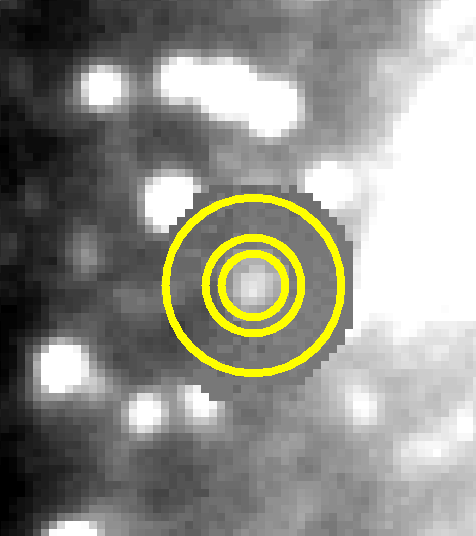
Figure 5. Placement of MaxIm DL aperture circles on the
combined "VAR Vul 05 and Star R" before editing (left panel) and after
(right panel) - gasp!
Notice that in the above figure's left panel the signal aperture circle
includes some of Star O, and the sky background annulus has several
interfering stars. This, clearly, is a job for PSF-fitting. However, I
don't have that software so I'm going to - now hold your breath - edit
pixels. Consider the "pixel edited" image in the right panel. Care must
be taken in determining the annulus-average sky background level to
achieve, and I usually take non-star contaminated locations at four
azimuth locations within the sky annulus then edit so that the average
background reads this value and has similar looking noise. Keeping
noise in the sky annulus region is needed if the indicated SNR is to
have meaning. I usually do this editing several times, trying to
achieve sky background brightness levels that are higher and lower than
I think applies to the star's location. These several readings, and the
SNR for each, are used to assign an uncertainty to the average measured
flux. For the edited version shown in right panel I got a reading of
747 +/- 22 counts (i.e., SNR = 33). Two other editing versions gave 728
+/- 26 and 741 +/- 22. The average is 739 +/- 24, which is the value
I'll adopt for this image.
Some of this flux can be attributed to Star R. According to Arne's
sequence Star R has V-mag = 19.38 +/- 0.06. What flux do I expect for
such a star?
If it were only that simple! These are unfiltered observations, so star
color is important. My telescope system (Celestron OTA, focal reducer,
tip-tilt image stabilizer, color filter wheel and CCD) responds to
stars in accordance with the following equation:
CV = 21.374 - 2.5 * LOG ( S / g ) - 0.15 * m + 0.54 * C
where CV is V-magnitude based on Clear filter observations,
S = flux using large
aperture; S = S' / f, where S' is flux with a small aperture and f =
recovery fraction for the small aperture used,
g = exposure time [seconds]
m = air mass,
C = star color, where C =
0.57 * (B-V) - 0.30, or C = V-R - 0.31, whichever is more convenient.
The constant 21.374 is a zero-shift parameter which is unique to my
system (for as long as the corrector plate stays clean); indeed, it
varies little over time (using Landolt fields for monitoring). The
coefficient 0.15 is a typical zenith extinction for my site (assuming
stars with a normal color). The coefficient 0.54 corrects for my
system's spectral response. Notice that star color C is defined so that
for most stars it is close to zero. The 0.54 coefficient remains
constant for long periods of time (but it changes whenever I change my
configuration, such as removing the focal reducer). A fuller
explanation of this equation can be found at PhotometryforSmarties.
As we will later see, the principal source of error in subtracting Star
R's flux is due to it's uncertain color. According to Arne's sequence
Star R has B-V = +1.25 +/- 0.12 and V-R = +0.18 +/- 0.09 (the SE values
are estimated, with guidance form his stated SE on faint star
magnitudes of +/- 0.06). On a diagram of V-R versus B-V for normal
stars these two colors are incompatible. All of the brighter stars in
the sequence have colors that are "behaved" - they fall on the normal
star scatter plot of V-R versus B-V colors. I suspect that one of the
magnitudes for Star R was influenced by the nearby variable (which I
suspect was bright when the sequence was made). For my work the most
likely candidate for poor results is always the blue filter; this may
be especially so for Star R since the nearby variable is blue. For
Arne's B-V color I calculate C = +0.41 +/- 0.07. For his V-R color I
calculate C = -0.13 +/- 0.09. The weighted average (twice the weight
for C based on V-R) is:
C = +0.05 +/- 0.08 (stochastic SE) +/- 0.28, 0.18 (systematic SE related to color ambiguity)
For this image, air mass m = 1.018, g = 120 seconds, f425 = 0.792, C
has been determined with associated uncertainties, so we are now ready
to answer the question: What flux assumptions (S') lead to CV = 19.38
+/- 0.06?
Using a spreadsheet it is quickly determined that S' = 527 +/- 22
(stochastic SE) +/- 103,45 (systematic SE related to color ambiguity).
The "Variable plus Star R" value for S' was determined (above) to be S'
= 739 +/- 24. Subtracting the predicted flux for Star R from this
yields:
VAR Vul 05 has S' = 212 +/- 31 (stochastic SE) +/- 45, 103 (systematic SE related to color ambiguity)
Using the spreadsheet with this flux for VAR VUl 05 yields:
CV = 20.35 +/- 0.73, 0.26 (orthogonal sum of all error sources)
The SE's are asymmetric due to the fact that I weighted C to favor the
value based on V-R instead of B-V. It may be interesting to list the
impacts on the final SE for each error source:
+/- 0.05 Pixel editing version SE
+/- 0.12 SNR for each pixel edited image
+/- 0.05 SE on varibale star's B-V (0.56 +/- 0.15)
+/- 0.06 SE on Star R's V-magnitude
+/- 0.11 SE on each of Arne's colors
+ 0.72 Allowing for B-V being correct
- 0.21 Allowing for V-R being correct
In other words, the uncertainty in determining the variable star's CV
magnitude is dominated by the uncertainty of the color of nearby Star R.
Anybody who has read this far qualifies for entering a contest where the winning prize is a Centurion 18 (my dream 'scope)!
________________________________________________________________
AstroPhotos
Pretty pictures
(plus links to my other astronomy pages)
First created: 2005.09.01 Last updated: 2005.09.25