| B |
V |
R |
I |
B-V | Comments |
|
| 1 |
17.20 +/- 0.07 |
16.26 +/- 0.05 | 15.81 +/- 0.04 |
15.27 +/- 0.05 | 0.94 +/- 0.10 | Don't use; variable! |
| 2 |
16.75 +/- 0.08 | 15.81 +/- 0.04 | 14.48 +/- 0.05 | (~1.7) | Don't use; very red! |
|
| 3 |
16.22 +/- 0.06 |
15.30 +/- 0.04 | 14.65 +/- 0.04 | 14.01 +/- 0.05 | 0.92 +/- 0.08 | Acceptable |
| 4 |
17.02 +/- 0.07 | 16.05 +/- 0.05 |
15.42 +/- 0.04 | 14.83 +/- 0.05 | 0.97 +/- 0.09 | Acceptable |
| 5 |
11.15 +/- 0.05 |
9.57 +/- 0.04 |
8.73 +/- 0.04 | 7.84 +/- 0.05 | 1.57 +/- 0.07 | OK (but red) |
| 6 |
13.90 +/- 0.05 |
12.55 +/- 0.04 |
11.78 +/- 0.04 | 11.05 +/- 0.05 | 1.35 +/- 0.06 | Acceptable |
| 7 |
13.70 +/- 0.05 |
13.13 +/- 0.04 |
12.74 +/- 0.04 | 12.31 +/- 0.05 | 0.57 +/- 0.06 | Acceptable |
| 8 |
16.33 +/- 0.06 |
15.69 +/- 0.05 |
15.28 +/- 0.04 | 14.80 +/- 0.05 | 0.64 +/- 0.08 | Acceptable |
| 9 |
13.31 +/- 0.05 |
12.72 +/- 0.04 |
12.32 +/- 0.04 | 11.90 +/- 0.05 | 0.59 +/- 0.06 | Acceptable |
| s1 |
16.12 +/- 0.05 |
15.27 +/- 0.04 |
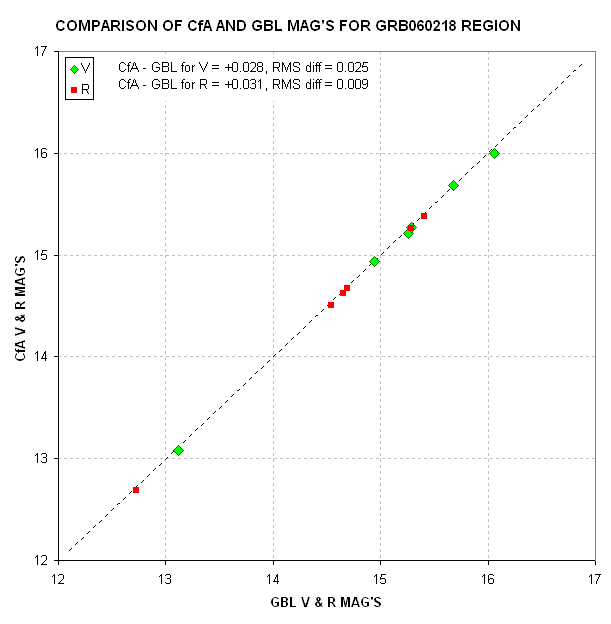
14.70 +/- 0.04 | 14.16 +/- 0.05 | 0.85 +/- 0.06 | SDSS star |
| s2 |
15.68 +/- 0.05 |
14.95 +/- 0.04 |
14.55 +/- 0.04 | 14.13 +/- 0.05 | 0.73 +/- 0.06 | SDSS star |
| s3 |
16.29 +/- 0.05 |
15.24 +/- 0.04 |
14.67 +/- 0.04 | 14.04 +/- 0.05 | 1.05 +/- 0.06 | SDSS star |
| s4 |
14.59 +/- 0.04 | 14.10 +/- 0.05 | SDSS star | |||
| s5 |
14.33 +/- 0.04 | 13.88 +/- 0.05 | SDSS star | |||
| GRB | 17.70 +/- 0.11 | 17.66 +/- 0.10 |
17.46 +/- 0.08 | 17.35 +/- 0.12 | 0.04 +/- 0.15 | 2006.02.25, 05 UT |
| Date |
B |
V |
R |
I |
V-R |
R-I |
Notes |
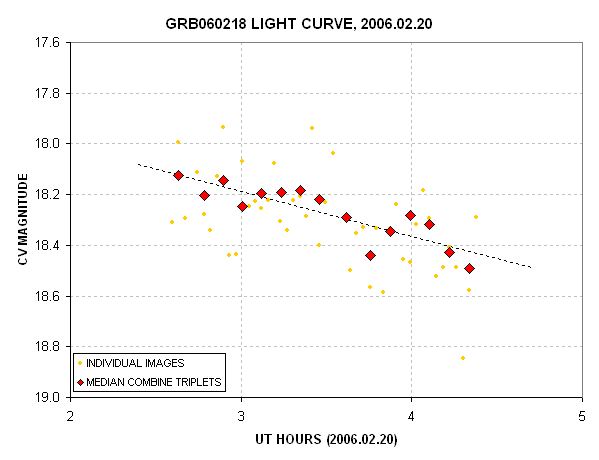
| 2006.06.20.117 |
18.00 +/- 0.05 | CV |
|||||
| 2006.06.20.171 | 18.25 +/- 0.05 | CV |
|||||
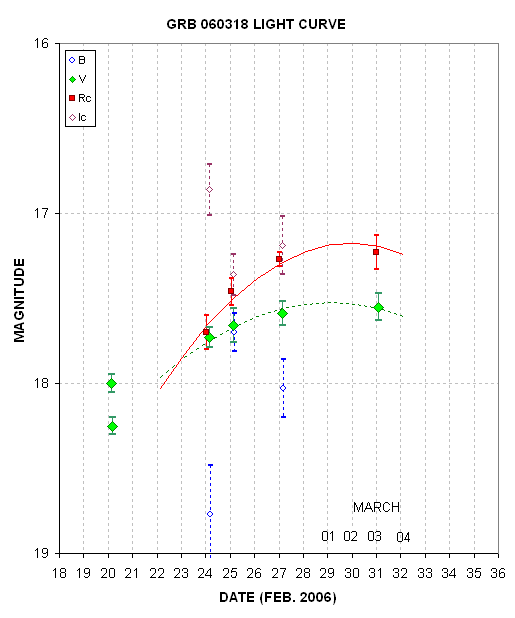
| 2006.02.24.133 |
18.77 +/- 0.29 |
17.73 +/- 0.06 | 17.70 +/- 0.10 | 16.86 +/- 0.15 |
+0.03 +/- 0.12 |
+0.84 +/- 0.18 | |
| 2006.02.25.136 |
17.70 +/- 0.11 | 17.66 +/- 0.10 |
17.46 +/- 0.08 |
17.36 +/- 0.12 |
+0.20 +/- 0.13 | +0.10 +/- 0.15 |
|
| 2006.02.27.125 |
18.03 +/- 0.17 |
17.59 +/- 0.07 |
17.27 +/- 0.04 |
17.19 +/- 0.17 |
+0.32 +/- 0.08 | +0.08 +/- 0.18 |
|
| 2006.03.03.085 |
17.55 +/- 0.08 |
17.23 +/- 0.10 |
|||||
| Star |
V |
Rc |
| 1 |
16.25 |
15.78 |
| 2 |
16.74 |
15.83 |
| 3 |
15.29 |
14.65 |
| 4 |
16.06 |
15.41 |
| 5 |
9.55 |
8.71 |
| 6 |
12.52 |
11.76 |
| 7 |
13.12 |
12.73 |
| 8 |
15.68 |
15.29 |
| 9 |
12.70 |
12.31 |
| s1 |
15.26 |
14.69 |
| s2 |
14.94 |
14.54 |
| s3 |
15.23 |
14.66 |
| s4 |
14.99 |
14.57 |
| s5 |
14.80 |
14.33 |
| G |
17.71 |