MIXING CONTOURS FOR ER961206 FILAMENT ENCOUNTER
Bruce L. Gary; 2006.06.18
A filament was encountered by the ER-2 during a altitude
excursions prior to landing in Hawaii on 1996.12.06. Temperature,
ozone, N2O are used to characterize the vertical structure of the filament. The ozone/N2O
mixing ratio is used to derive an altitude profile of the filament's
percentage of ambient versus original air. It is speculated that this
filament originated in the Arctic polar vortex. A temperature anomaly
is associated with the filament that is consistent with equatorward
movement while preserving potential vorticity. This association of
tracer and temperature features is similar to several filament
encounters on other ER-2 flights.
This web page is devoted to the analysis of a 1-hour portion of the
ER-2 flight
of 1996.12.06 from California to Hawaii. This flight segment is special
because it probed a filament in a way that allows for a quantitative
derivation of mixing percentages of ambient air with the filament's
original (vortex) air. The ER-2 conducted an altitude "dip" prior to
descent for landing in Hawaii, and this produced three altitude
profiles of the filament. The flight track is depicted in the following
figure.
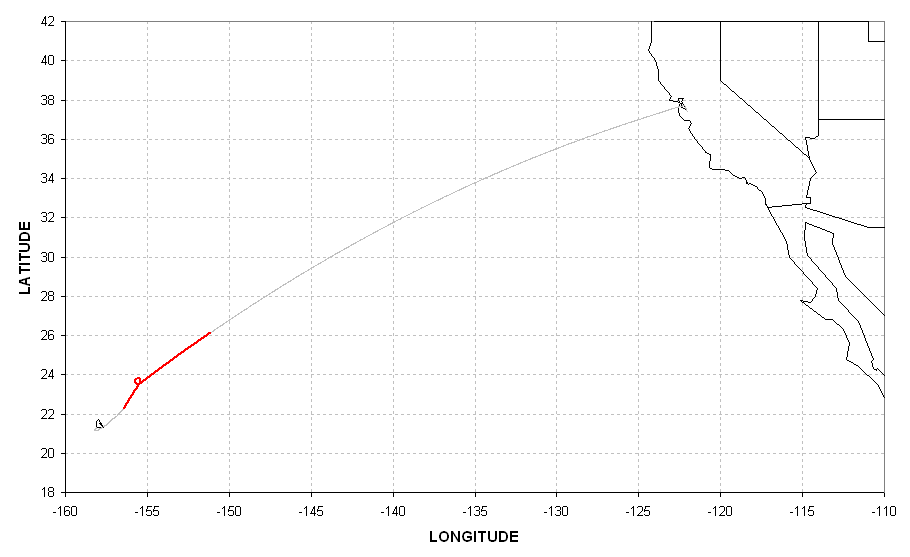 Figure 1. Flight track for ER061206 from California to Hawaii. Red portion is for the 70.4 to 74.4 ks "region of interest."
The next figure shows the ER-2 altitude and ozone mixing ratio during the 4 ksec time of interest.
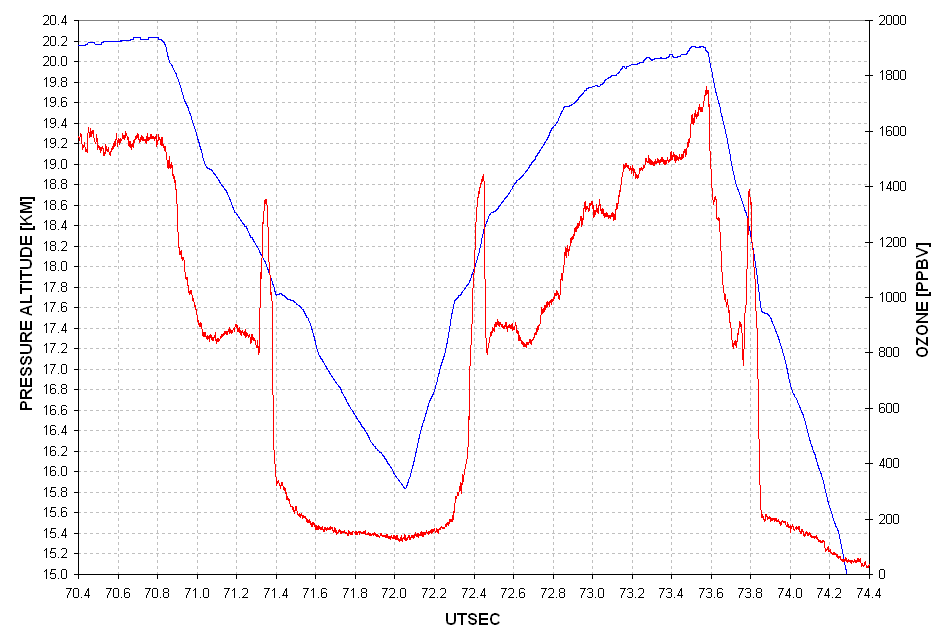
Figure 2. ER-2 altitude (blue) and ozone mixing ratio (red) during the "region of interest."
Note three high ozone encounters when the ER-2 flew through the 18 km
altitude region. The top of this anomalous ozone layer borders with
stratospheric air (~900 ppbv) whereas the bottom borders the
tropopause. This is shown more clearly in the next figure.
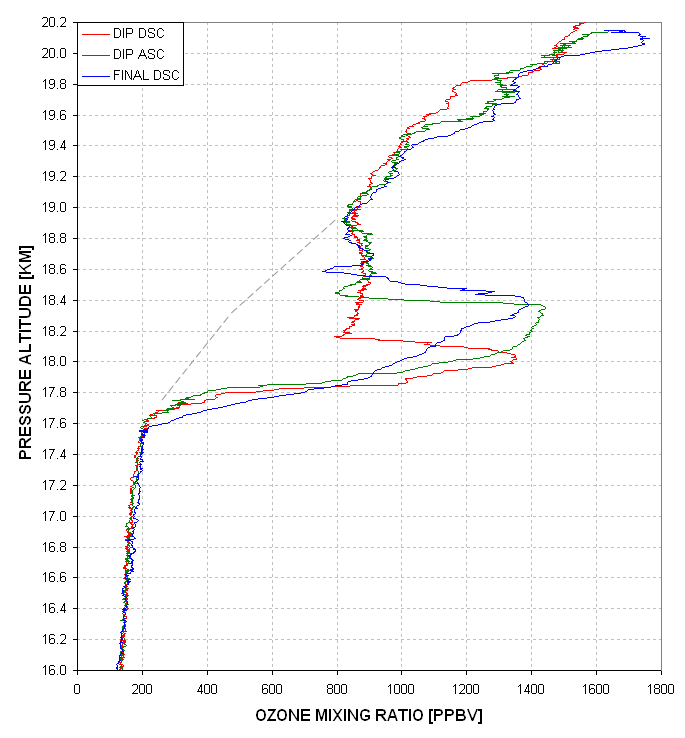 Figure 3. Ozone altitude profiles for the dip descent
(red), the dip ascent (green) and the final descent (blue). Grey dashed
lines indicate a subjective extrapolation of an "undisturbed" ozone
profile.
Figure 3. Ozone altitude profiles for the dip descent
(red), the dip ascent (green) and the final descent (blue). Grey dashed
lines indicate a subjective extrapolation of an "undisturbed" ozone
profile.
Note that the tropopause is at ~17.8 km, which means that the ER-2 is
flying in the tropics (i.e., the sub-tropical jet is north of the
region of interest). If the anomalous layer of high ozone above the
tropopause is a filament from the vortex edge then it is likely that a
lower portion of it has been "lost" to subtropical jet disruption prior
to the filaments arrival at this lower latitude "region of interest."
Also note that the anomalously high ozone layer is thinnest at the
northeast location
(dip descent) and thickest at the southwest location (during the final
descent).
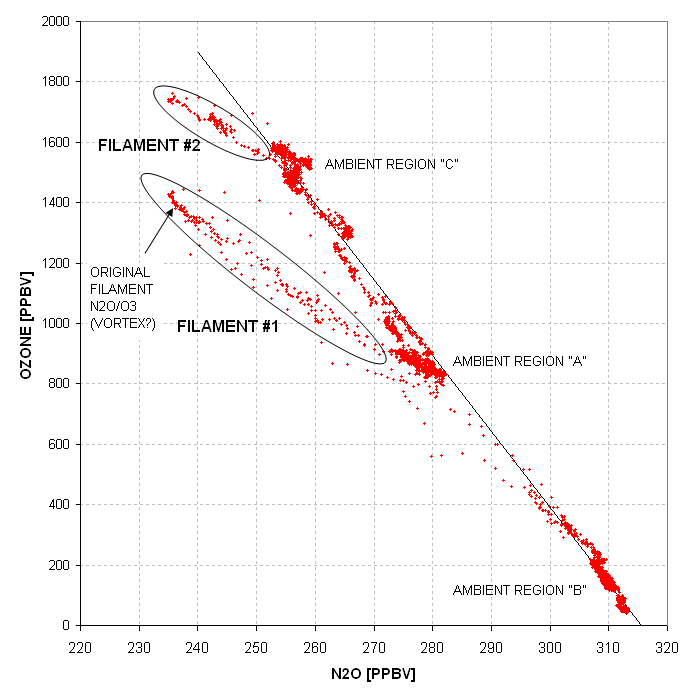 Figure 4. N2O/O3 mixing lines for the region of interest. The
long straight line represents "undisturbed ambient" air produced by
mixing of air from the tropical troposphere and stratosphere. Ambient
Region "A" data is from stratospheric air immediately above the
anomalous layer. Ambient Region "C" is from a higher altitude (~20 km).
The interval between "A" and "C" is normal lower stratosphere air.
Ambient Region "B" is normal tropical tropospheric air. Two filament
regions are identified. Filament #1 is from the anomalous "high ozone"
layer just above the tropopause ("vortex filament"); the upper-left end
of this mixing line is tentatively identified as original, undistured
vortex edge air. Filament #2 is from a small flight segment encountered
at the highest altitude before the dip.
Figure 4. N2O/O3 mixing lines for the region of interest. The
long straight line represents "undisturbed ambient" air produced by
mixing of air from the tropical troposphere and stratosphere. Ambient
Region "A" data is from stratospheric air immediately above the
anomalous layer. Ambient Region "C" is from a higher altitude (~20 km).
The interval between "A" and "C" is normal lower stratosphere air.
Ambient Region "B" is normal tropical tropospheric air. Two filament
regions are identified. Filament #1 is from the anomalous "high ozone"
layer just above the tropopause ("vortex filament"); the upper-left end
of this mixing line is tentatively identified as original, undistured
vortex edge air. Filament #2 is from a small flight segment encountered
at the highest altitude before the dip.
In this figure the long straight mixing line, including Ambient Regions
"A", "B" and "C", can be thought of as produced by normal exchanges of
air between the stratosphere and tropical troposphere. The two filament
mixing lines can be thought of as produced by the mixing of vortex edge
air and air in the lower stratosphere. The original N2O/O3 mixing ratio
of vortex edge air is to the "left" of the long straight
stratosphere/troposphere mixing line.
Consider the hypothesis that the upper-left most cluster of points
corresponds to vortex edge air. In other words, these points are 100%
vortex edge air. The rest of the points along the Filament #1 mixing
line are therefore less than 100% vortex edge air. A procedure for
assigning percentage vortex edge air is suggested in the next figure.
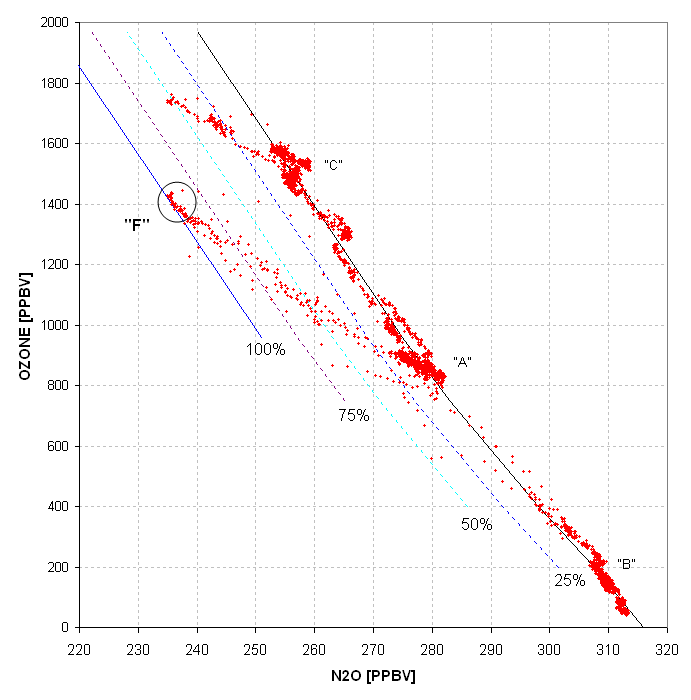 Figure 5. Hypothetical assignment of percentage vortex edge
air based on N2O/O3 location along the Filament #1 mixing line. The
N2O/O3 location "F" is suggested to correspond to vortex edge air.
Figure 5. Hypothetical assignment of percentage vortex edge
air based on N2O/O3 location along the Filament #1 mixing line. The
N2O/O3 location "F" is suggested to correspond to vortex edge air.
With this assumption it is possible to construct a vertical cross-section of percentage vortex edge air.
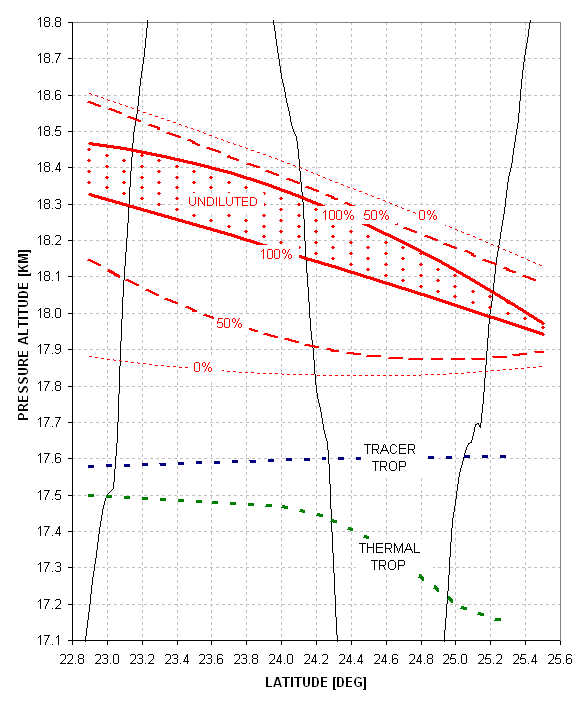 Figure 6. Vertical cross-section showing troposphere
percentage isopleths for Filament #1. "Undiluted corresponds to 100%
vortex edge air while 0% corresponds to ambient lower stratospheric
air. The "tracer tropopause" is defined by ozone mixing ratio and the
"thermal tropopause" is the standard one based on lapse-rates.
Figure 6. Vertical cross-section showing troposphere
percentage isopleths for Filament #1. "Undiluted corresponds to 100%
vortex edge air while 0% corresponds to ambient lower stratospheric
air. The "tracer tropopause" is defined by ozone mixing ratio and the
"thermal tropopause" is the standard one based on lapse-rates.
From this cross-section it can be sen that only a small layer of the
filament remains unaffected by mixing. Also, the northeast portion of
the filament is shallower and more eroded than the portion closer to
Hawaii. Note also that the tracer and thermal tropopauses differ by more than 100 meters.
It may be interesting to compare the temperature field in relation to the filament location. This is shown in the next figure.
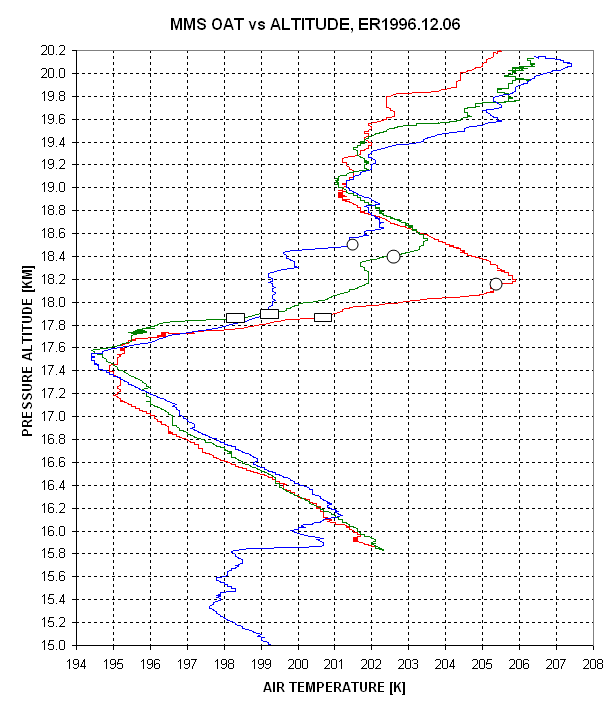
Figure 7. Temperature signature of the filament for
three altitude excursions. Circular and rectangular symbols mark the
high and low altitudes of the anomalously high ozone region.
This plot of temperature profiles shows that the filament, as
defined by molecular tracers, is thinner than the layer of air with
anomalously high temperature. One interpretation is that the filament
"dragged" air along as it moved equatorward, and as this expanded layer
moved in latitude it preserved potential vorticity (PV). Preserving PV
during an equatorward movement produces "filament spin-up" that
consists of a vertical compression accompanied by a horizontal
expansion (described in the next section). The vertical compression
causes an adiabatic heating at the upper boundary of the moving layer
of air, and at the lower booundary there may be an adiabatic cooling.
(This pattern has been observed by the MTP on several occasions while
flying between a polar vortex and the tropics.) The above figure does
indeed show an exces of warmth at the top of the filament and a
suggestion of coolling near the bottom. The next section describes
"filament spin-up."
Filament Spin Up Due to PV Conservation
Consider what might happen to a chunk of the vortex edge after it is
dislodged from the vortex by a planetary wave. As it moves equatorward
its slope will change due to differences in wind versus altitude. It
will also be streatched in other directions due to differences in wind
speed versus latitude. In the following figure keep in mind that the
horizontal and vertical axes are greatly different, so imagine that the
chunk of vortex air that is dislodged is really wider than it is
vertically thick.
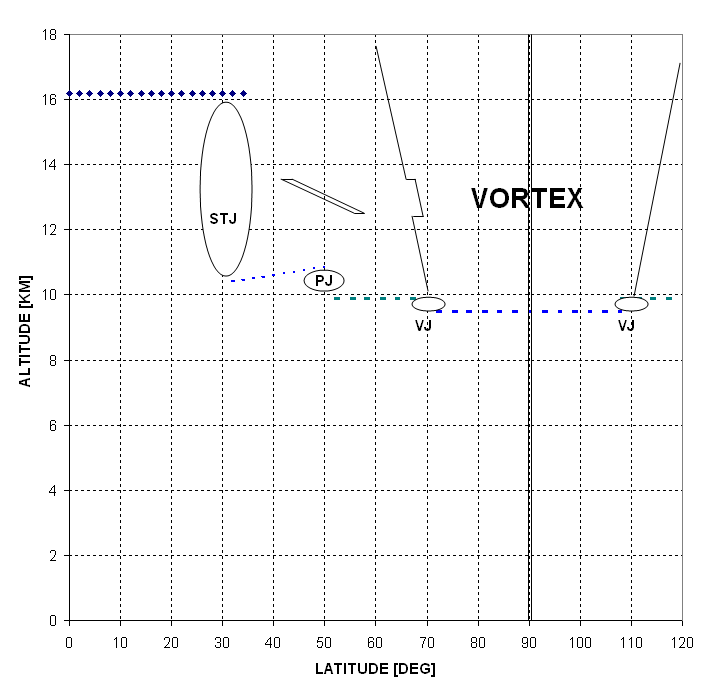
Figure 8. The farther the filament travels toward the equator
the more it resembles a "tilted pancake."
If an air parcel moves toward the equator it is traveling to lower latitudes,
and even if it is not subjected to wind field forces that distort its shape
the fact that the air parcel must retain its potenttial vorticity (PV) causes
it to become flatter and more spread out. The governing equation is:
PV = (-dTheta/dP) * ((dV/dx - dU/dy) + 2 * Omega *
sin Ø)
where PV = potential vorticity,
Theta = potential temperature = T [K]
* (1000 mb * P[mb] ) 0.286
P = pressure [mb],
V = eastward component of horizontal
wind,
U = northward component of horrizontal
wind,
Omega = earth's rotation rate [radians/second],
Ø = latitude,
x = east-pointing coordinate,
y = north pointing coordinate.
The term dTheta/dP is referred to as
"static stability," the term dV/dx - dU/dy is referred to as "relative
vorticity" and the term 2 * Omega * sin Ø is referred
to as the "coriolis parameter."
PV is a conserved property of an air parcel that does not
undergo irreversible interactions with its surroundings and does not gain
or lose energy through its parcel boundaries. For time scales that characterize
an air parcel's movement from the vortex edge to mid-latitudes it can be
said that the parcel's PV must be conserved unless it undergoes significant
mixing with the surrounding air.
Consider an air parcel that moves toward the equator, which
experiences a decreasing "coriolis parameter".
There are two ways to conserve PV during this latitude change:
1) Increase "relative vorticity" or
2) Increase "static stability."
It is not clear from the theory how this partitioning should
occur. This is a job for the observationalist, and this article presents
evidence that at least the "static stability" component changes as an air
parcel moves equatorward. To illustrate this situation let's shift our imagination
to the southern hemisphere, in aniticipation of a key MTP observation, and
consider that a chunk of the Antarctic vortex is torn off by mid-latitude
winds that "bang into" the vortex edge during a planetary wave meander.
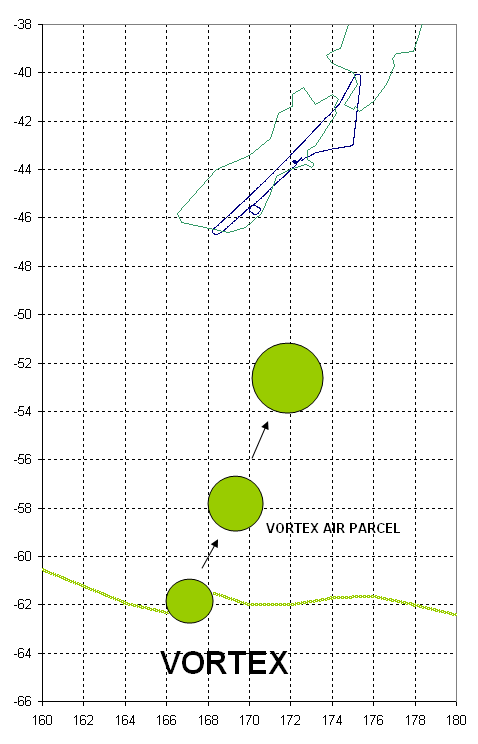
Figure 9. Depiction of a disk of vortex air being
dislodged from Antarctic vortex and moving equatorward. The disk-shaped air
parcel is shown at three hypothetical times during its motion toward New
Zealand. Flight track for ER-2 flight 1994.05.23 is shown (blue trace).
In the above figure the disk-shaped air parcel is shown as
expanding horizontally with time. As it undergoes this horizontal expansion
it also undergoes a vertical compression, as shown in the next figure.
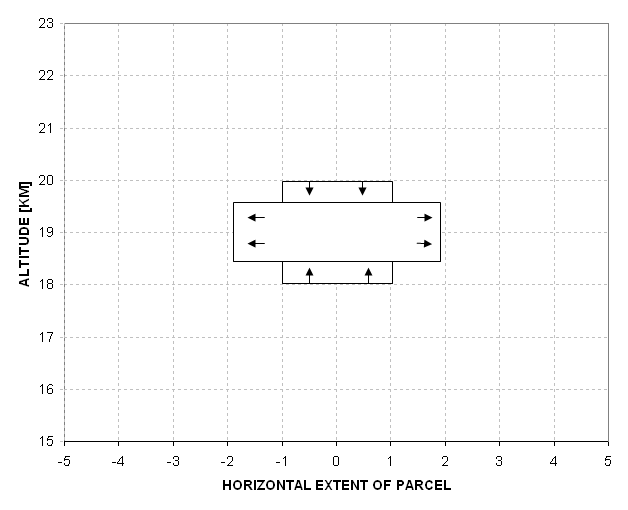
Figure 10. Depiction of how an air parcel vertically
compresses as it expands horizontally during equatorward movement.
In this figure showing simultaneous horizontal expansion and
vertical compression (preserving air parcel volume) it can be imagined that
the horizontal expansion is associated with a "spin-up" caused by an increase
in "relative vorticity." The vertical compression will increase static stability
since isentrope surfaces will be brought closer together as vertical compression
proceeds. This scenario therefore depicts a situation inwhich both "relative
vorticity" and "static stability" increase to counter the loss of the "coriolis
parameter" value, thus preserving PV.
It would be observationally difficult to detect a horizontal
expansion, or even the wind speed changes associated with the spin-up, but
it is easy for an MTP to detect the increase in static stability associated
with vertical compression. The following figure shows two concepts for what
might happen to the temperature field in the vicinity of the vertically compressing
disk-shaped vortex filament.
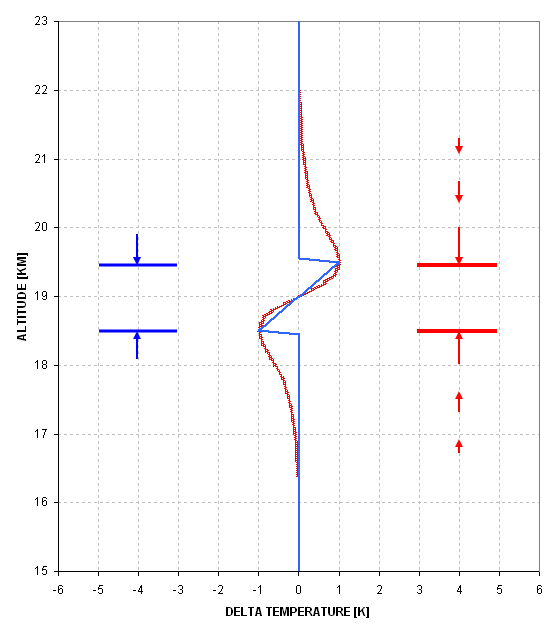
Figure 11. Two concepts for how the temperature
field could be distorted by the filament's vertical compression. The blue
trace is for no effect on the ambient air whereas the red trace assumes that
nearby ambient air above and below the filament partakes in some of the filament's
vertical compression.
Recall our implicit assumption that the vortex chunk of air
will move toward the equator after it is torn off the main vortex. If it
were simply entrained in the mid-latitude air adjoining the vortex edge then
it would only move equatorward as far as the meandering mid-latitude air
during its planetary wave motion, and in this case the air surrounding the
filament would undergo the same PV-conserving vertical compression and horizontal
expansion as the filament. But, if the chunk of vortex air that is destined
to become a mid-latitude filament moves through the mid-latitude air
mass once it has separated from the main vortex, and if this motion is toward
the equator, then the filament will undergo a PV-conserving vertical compression
that the ambient air it moves through does not experience. What could cause
the latter case to exist? Recall that the air in the vortex has a higher
PV than the air at mid-latitudes. PV is proportional to the product of horizontal
vorticity and vertical static stability. Since the static stability within
the vortex is lower than outside, there must be an excess of vorticity for
air within the vortex. It is this anomalously high vorticity of chunks of
vortex air that are torn from the main vortex that must cause the vortex
air to migrate equatorward (help, dynamicist!). Filaments of vortex air at
low mid-latitudes are an observational fact. The only matter in question
is whether the vortex air moves equatorward by a process of moving through
mid-latitude air or a process of being entrained by mid-latitude air that
is on its way toward the equator. Later I will claim that observed temperature
field distortions in relation to tracer-derived filament thickness can be
used to answer this question.
It is not necessary to resolve the question raised in the
previous paragraph to realize that encounters with filaments should be associated
with changes in air temperature. Specifically, the vertical gradient of temperature
should increase during flight within a filament. This is a prediction based
on basic atmospheric physics. The ER-2 has flown many missions in the vicinity
of a winter polar vortex, and these missions included instruments that measure
the tracers necessary to distinguish vortex air from mid-latitude air. Furthermore,
these missions also included the Microwave Temperature Profiler instrument,
which allows for the detection of changes in vertical temperature gradient.
<>
____________________________________________________________________
This site opened: June 18,
2006. Last Update: June 18,
2006