
DC971013 STRATOSPHERIC INTRUSION
AND CAT ENCOUNTER WHERE LAPSE RATE WAS ADIABATIC
2000 September 24
Introduction and Overview
This flight is included in the CAT analysis because of a very well documented measurement of lapse rate within a CAT patch. Because the CAT is associated with a stratospheric intrusion, a brief description of this unusual meteorological setting is also presented.
Figure 1. Flight track of DC971013, with tick marks every 2.0 ks. Over eastern Colorado the DC-8 descended from 33,000 feet to 21,000 feet, flew level over Kansas, then ascended to 37,000 feet over Missouri. Over Illinois a small descent and ascent was made in the presence of CAT. It is this last altitude change sequence that provides good quality lapse rate information in the presence of CAT. The stratospehric intrusion is flown through near the Kansas/Missouri border during the ascent.
Stratospheric Intrusion
The following figure illustrates MTP's isentrope steep slopes during pasage through a stratospheric intrusion.

Figure 2. IAC during intrusion encounter. Dashed lines are DIAL's stratospheric intrusion location (bottom, mid, top). Isentropes are 5 K apart.
The DIAL (Differential Absorption Lidar) was built and is operated by NASA's Langley Research Center, headed by Principal Investigator Ed Browell. The plotted intrusion boundaries are based on DIAL measurements of ozone mixing ratio. Ozone values between the dashed lines are high ozone, and therefore can be identified with a stratospheric origin.
Note that the isentropes within the intrusion slope downward as the flight progresses from left to right. There is approximate agreement of isentrope slope and intrusion slope in the lower half of the intrusion betweeen longitudes -94.7 and -92.8. This implies that this portion of the intrusion moved into place rapidly, before diabatic processes and mixing could occur. This same condition exists for the upper boundary of the intrusion from -93.8 to -92.8 degrees longitude.
Lest the reader disbelieves that the isentropes are sloped in this region, view the next figure, showing a larger span of longitudes.
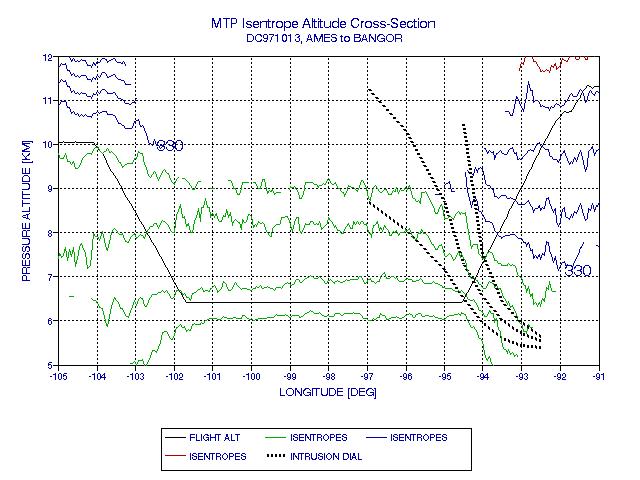
Figure 3. IAC during intrusion encounter. Dashed lines are DIAL's stratospheric intrusion location (bottom, mid, top). Isentropes are 5 K apart.
This figure has the 330 K isentrope labeled, and note how it slopes from about 11 km to 7.3 km while flying from a longitude of -105 to -92 degrees. This is evidence for a very contorted isentrope field, and is consistent with the message of Fig.2.
CAT Locations

Figure 4. DC-8 altitude and CAT intensity for a middle portion of the flight. CAT intensity is calculated to be 2.2 times the raw accelerometer counts peak-to-peak, since the DC-8 accelerometer is sampled once per 1.33 seconds. Altitude change intervals A, B and C are used for deriving T(z) in the next figure.
CAT is present above 10.6 km during the ascent (65.85 ks) and until 67.2 ks. Although the observer log refers to "light chop" this data would suggest the intensity was "light to moderate."
Lapse Rate Data

Figure 5. Plot of in situ air temperature versus altitude for regions A, B and C (located in the previous figure).
In this figure the thick red trace corresponds to turbulent region "B." The black dotted line is a fit to the upper red trace segment, using dT/dZ = -9.74 [K/km]. This compares favorably with the theoretical value: (dT/dZp)adiabatic = -9.728 [K/km] for a latitude of 39 degrees and altitude of 11.0 km (where g = 9.7669 [m/s2].
Thus, we can assume that a complete vertical mixing has occurred throughout the 400-meter layer at location "B." Can this assumption be tested? Yes. Let's look at the wind components to see if they exhibit any vertical gradients.

Figure 6. Wind components U, V and W versus time for locations A, B and C.
The U wind component exhibits a steady change in value with time, even during the altitude changes at A, B and C. This implies the presence of a horizontal gradient, and the fact that altitude changes do not "show up" implies that altitude gradients are no present. The prediction of complete vertical mixing is thus borne out by the data.
Conclusion
In situ measurements of dT/dZp within a CAT region confirm that CAT is able to produce a lapse rate equal to the adiabatic value. The agreement for a 400-meter layer, within which CAT was present everywhere, is good to approximately 1 part in 800! The data show that turbulence can accomplish complete vertical mixing of theta and wind components throughout a 400-meter thick layer.
___________________________________________________________________
This site opened: March 2, 2000. Last Update: September 25, 2000