
Index of Links Internal to This Web Page
Overview of Flight
Lapse Rate
Tropopause Altitude
Isentrope Altitude
Cross-Sections
RRi
U and V Fitting
Theta
Fluctuation Amplitudes
Conclusion
The flight of February 8, 1996 was a TOTE/VOTE ferry flight from Fairbanks, Alaska to Barber's Point, Hawaii. Two "moderate" encounters were reported by the MTP operator, Dr. M. J. Mahoney.
Figure 1. Flight track for DC960208, . Time ticks and "kilosecond" labels are shown at 2 ks intervals. The tropopause rises through the DC-8's altitude at 48.4 ks (50 degress latitude). Two wind maxima occur, one at 49 ks (49 degrees latitude) and a broader one from 55.5 ks to 56.9 ks (34.9 to 32.0 degrees latitude). Moderate turbulence occurs at 54 ks, with values exceeding 0.20 g-units from 53.44 to 54.36 ks). A "double tropopause" is present from 54.0 to 56.4 ks (latitude 38.0 to 32.8 degrees).
This flight track shows that the CAT encounter occurred over the ocean, just as a double tropopause was detected. The double tropopause feature is commonly detected by the MTP when flying near the sub-tropical jet, STJ. In this case, the STJ is located at 34 degrees latitude (about 56 ks), and the CAT is on the northern edge of the jet.

Figure 2. DC-8 altitude (black trace) and air temperature (red trace). The CAT encounter is shown by the red ovals.
Air temperature is variable prior to 48.4 ks, while flying in stratospheric air. After the tropopause rises through the DC-8's altitude at 48.4 ks, the air gets colder and also less variable. While approaching the STJ (at about 56 ks) air temperature rises steeply. The CAT encounter occurs during the steep rise of temperature on the northern edge of the jet.
The following figure shows the MTP-measured lapse rate, dT/dZp, and vertical accelerometer activity (peak-to-peak range per 16.6-second data cycle).

Figure 3. Accelerometer activity (red trace), Akk/DC8 (defined in the text), lapse rate (green trace, defined here as dT/dZp), and DC-8 pressure altitude (blue trace).
The accelerometer activity parameter Akk/DC8 is defined to be 1.5 times the peak-to-peak variation of the vertical accelerometer output during a 16.6-second data cycle. The vertical acceleromter readings are sampled at 12 Hz, which is too infrequent to capture all excursions, hence the 1.5 multiplication factor adjustment. For the ER-2 a multiplication adjustment was empirically found to be about 2.0, but for the DC-8 I have not yet performed an empirical calibration to establish the required multiplication adjustment; for now, I will conservatvely use 1.5.
Turbulence having Akk/DC8 = 0.52 g-units occurred at 54.163 ks. The CAT patch, from 53.3 to 56.2 ks is located within a region of vertical compression, as indicated by the higher than normal lapse rate. Note that all flight data after 48.4 ks is for flight within the troposphere, where a lapse rate of -8 [K/km] is typical. The region of CAT exactly corresponds to a region where dT/dZp is greater than this value, reaching -2 [K/km] at 55 ks.
A less intense CAT encounter occurs at 43.3 ks, recorded by the MTP operator as "moderate." The CAT encoutner at 54.2 ks was recorded as "very strong," which I take to mean "moderate to severe."
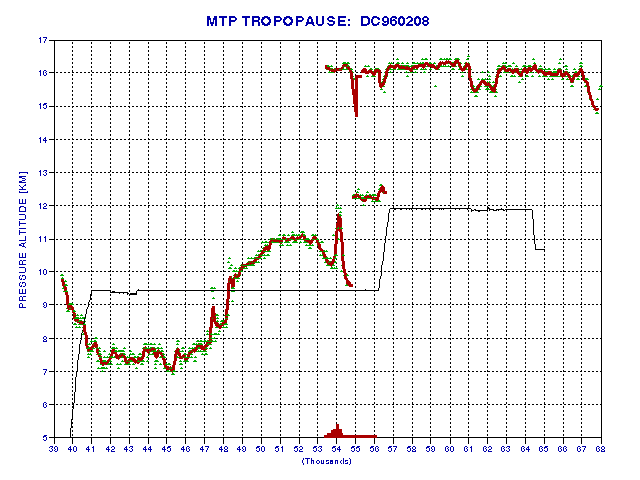
Figure 3a. Altitude of the MTP-determined tropopause. The green symbols are independnet tropopause determinations made every 16.6 seconds, and the thick red trace is a 11-point average of the former. Aircraft altitude is shown with a thin black trace, and the main CAT encounter is indicated by a pattern of red lines at the bottom.
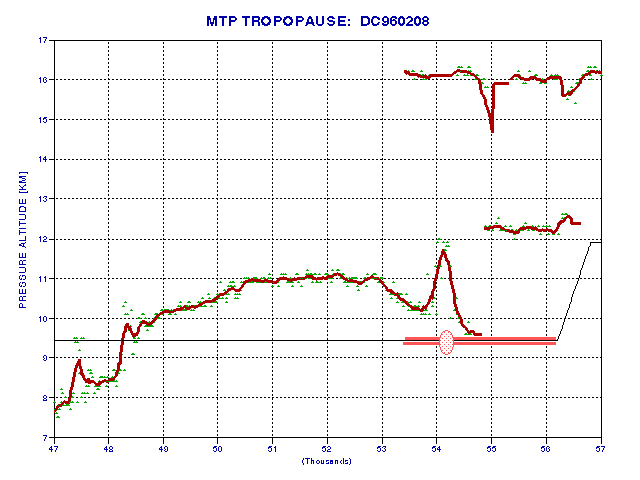
Figure 3b. Altitude of the MTP-determined tropopause for middle portion of flight. Turbulence is indicated by the light red lines next to the DC-8 alight altitude, and the strongest CAT encounter is indicated by the red oval.
This figure presents the tropopause altitudes determined by the MTP instrument. It is possibly significant that the CAT encounter occurred at a time when the tropopause trace makes an abrupt rise. It may also be significant that the CAT occurs within the double tropopause latitude region.
Isentrope Altitude Cross-Sections

Figure 4. IAC for entire flight. Isentrope surfaces are 5 K apart. Tropopause altitudes are shown with blue triangles.

Figure 5. IAC for middle portion of flight.

Figure 6. IAC for turbulent portion of flight. Turbulence is indicated by the red bar below flight level, and the most extreme CAT is represented by the red oval symbol.
The following figure plots RRi based on use of the DD (Difference Data for U and V) method for inferring vertical wind shear, VWS.

Figure 7. RRi using the DD method for inferring VWS. The false alarm rate is excessive, and is discussed in the text.
For all previous flights I've used the DD method for inferring VWS. The DD method appeared to have slightly better performance than the SR or DR methods. The DD mthod's RRi is a "failure" for this flight! It produces RRi values above 2.5 most of the time, so would be issuing false alarms almost continuously.
I suspect that this change in performance is related to the fact that this is the first time I've used the RRi analysis for tropospheric flight data!
One clue can be seen in Fig. 2. Notice the dramatic change in character of the temperatrue trace when crossing from the stratosphere into the troposphere, at 48.2 ks. The ever-present temperature fluctuations essentially disappear when entering tropospheric air. This must be caused, in large part, by the difference in lapse rate in the two regimes. For example, during this tropopause crossing dT/dZp changed from +2 [K/km] to -8 [K/km], as can be seen in Fig. 3. This change corresponds to a potential vertical gradient change from 12 [K/km] to 2 [K/km]. Vertical motions of a given amplitude would produce 6 tmes smaller variations in temperature in the troposphere compared with those produced in the stratosphere.
But even more important, probably, is that the "character" of vertical and horizontal motions is different in the two regimes. The relative merits of the DD, SR and MR methods for inferring VWS are dependent upon the presence or absence of correlated changes of temperature with wind speed components. If horizontal gradients have a different character in the troposphere compared to the stratospehre, and are related to vertical displacements differently, then the DD procedure for inferring VWS may not be optimum.
It is therefore important to re-explore the same several parameters that were investigated for the first ER-2 flight, namely DD's offset value (10 seconds was optimum for the stratosphere case), SR's chunk size, MR's chunk size, and the various methods for weighting chunk estimates of VWS in the multi-chunk weighted averaging process.
Some of this is within the scope of the present Phase I task. But much of it is not. On this web page I will explore the DD offset parameter.
Additional Analysis
The rest of this web page reports the results of Task #2 work, from September 1 to September 30.
I recently discovered that the wind data files archived for the TOTE/VOTE DC-8 flights is a much poorer quality product compared with the ER-2 wind data. During the TOTE/VOTE mission the MMS instrument was not included in the DC-8 instrument complement. The wind data files, DWyymmdd.DA1, were produced under the direction of Dr. Leonhard Pfister, Ames Research Center, and are based upon the lower quality wind data routinely generated by the DADS system. DADS is a facility system, and thus does not have a principal investigator and support team funded at the same level as that associated with the MMS instrument. The DADS data is adequate for the purposes for which it was intended, and unfortunately my RRi studies require the best possible wind data. Consequently, any RRi results generated for TOTE/VOTE DC-8 flights will be of lower quality than the ER-2 RRi data.
Since this flight, DC960208, has the most severe CAT encounter among those DC-8 flights for which observer reports are available, there is an incentive to TRY to generate RRi data from this flight. The remainder of this web page is based upon my attempt to rescue the DADS wind data for RRi use.
The next figure illustrates a problem with the DADS wind data, and my attempt to overcome the problem.

Figure 8. Sample of DADS wind U-component (thin red trace) and my "fitted" version (thick green trace).
Whereas the MMS data for the ER-2 has 1 Hz updates, with 0.1 [m/s] speed resolution, the DADS wind data for TOTE/VOTE has poorer temporal and speed resolution. There doesn't seem to be an obvious pattern to the quantizations, but visually it appears to be typically 5 seconds and 0.3 [m/s]. The abrupt changes can be expected to produce large and misleading correlations of U and V with both time and theta. This translates to poor quality VWS determinations, and poor quality RRi solutions. No doubt, some of the high values and spurious nature of the RRi plot in Fig. 7 can be attributed to this problem.
The thick green trace is my attempt to "recover" the missing structure of the DADS wind-versus-time data. It was produced by first generating triangular weighted averages of the original data, with time bases of 3 and 7 seconds. Then, a second pass of the data produced the green trace by multiplying the 3-point data by 2.5 and subtracting the 7-point data multiplied by 1.5. Clearly, this product will not recover all the structure that was lost in the DADS archiving process, but it reduces the abrupt changes, and also creates smoother peaks and valleys.

Figure 9. Sample of MMS data for the ER911102 flight, using scales identical to those of the preceding figure. The MMS-measured U-component (thin red trace) has been averaged to simulate the filtering that appears to be present in the DC960208 DADS data (thick green trace).
In viewing this figure one must ask "How much information about U correlations with theta could exist in the red trace fluctuations that are not present in the green trace fluctuations?" I will not re-analyze the ER911102 data using the smoothed (green trace) data, since I cannot be sure that this would be a fair comparison. This is because there are other differences between the two data types, such as the accuracy with which the winds are measured. The MMS team has always "calibrated" their measurement system by performing special box turns, and porpoise (altitude oscilation) maneuvers, which the DADS does not do. The people responsible for DADS would surely agree that the accuracy of the MMS winds are superior to those of DADS. The task of determining how these differences affect hte ability of inferring VWS from U and V correlations with theta is not a straightforward one, and I will not spend muc time second-guessing their magnitude.
Re-Analysis of DC960208 Using Fitted Winds
The DD method for inferring VWS from the correlation of U and V with theta has been performed again, using the "fitted" winds that endeavor to reconstitute temporal structure lost in the DADS sampling procedure. The RRi(t) results are essentially the same, with only slight differences from Fig. 7. I will not present the new results here. Rather, I will explore some new ways of handling the "fitted" U and V wind components that might produce better VWS and RRi results.
The remainder of my DC960208 analysis will be guided by the fact that the DD analyses, to date, have shown low levels of vertical wind shear prior to the main CAT encounter, and for as long as low levels of VWS continue to be borne out by the data this flight will qualify as failing to provide CAT warnings using RRi thresholds. Therefore, my task will be to evaluate the notion that VWS at approximately 53 ks is too low to allow for RRi vaslues high enough to provide CAT warnings. I shall adopt the philosophy that methods that overestimate VWS can be used to place upper limits on VWS, and can therefore be used to condemn the RRi CAT warning hypothesis, for this one flight case.
The DD method for inferring VWS errs in the direction of overestimating VWS, since it does not permit any of the varaitions of U and V to be accounted for by horizontal gradients. Therefore, my present goal permits the use of DD methods for inferring VWS. So far, I have used one DD algorithm (explained at DD Method). I shall now explore other algorithms based on the DD concept. To save time, I shall do this using spreadsheets (not QuickBASIC programs) - which are often the most efficient analysis tool when single case scenarios are to be evaluated. Finally, I will perform these analyses on the "fitted" winds.
But wait...
Theta Fluctuation Amplitudes for DC960208
Before proceeding with more VWS analyses, maybe we should determine if theta fluctuations for DC960208 are at all comparable to thjose for the ER-2 flights; for if they're not, due to instrument time constants, for example, then using the DC-8 DADS winds for inferring VWS might be hopeless.

Figure 10. Histograms of theta fluctuations (10-second time base differences) for a typical ER-2 flight and the DC-8 flight currently under analysis. The population standard deviations are 0.226 K and 1.21 K.
Bingo! The DADS theta fluctuations are much less than those encountered by the ER-2! This could explain why WVS and RRi were poorly behaved for DC960208! But why are the theta fluctuations so small?
Is there a way to predict theta fluctuation amplitude for this DC-8 flight? There may be. In the past I have analyzed the amplitude of isentrope altitude "wrinkles" for horizontal spatial scales within the range 20 to 400 km, using MTP data for both the ER-2 and DC-8. Specifically, I subtracted a synoptic scale fit to the isentrope altitude data and constructed histograms of the resultant differences. The histograms can be characterized by a "full-width at half-intensity" parameter, which I call MFA, for Mesoscale Fluctuation Amplitude. On average, the DC-8 data has MFA values 61% of the ER-2 MFA values. Since MFA evaluations have been made for a variety of seasons, latitudes and underlying terrain, I have been able to "model" these dependencies. This MFA model is described at MFA Model.
Even though the 10-second theta difference data samples smaller spatial scales than that sampled by MFA (2 km instead of 20 to 400 km), it would be interesting to know what the MFA model predicts for the ratio of MFAs corresponding to the conditions for DC960208 and ER911102. At DC-8 altitudes, at mid-latitudes, in the winter, and over the ocean (conditions that apply to DC960208), the model predicts MFA = 74 meters. At ER-2 altitudes, at mid-latitudes, during the winter, and over mountainous terrian (conditions that apply to ER911102), the model predicts MFA = 173 meters. If the 2-km isentrope wrinkles scale with altitude, latitude, season and underlying topography in the same way as the 20 to 400 km isentrope wrinkles, then the 10-second theta differences for DC960208 would be 43% of the amplitude of the 10-second differences for ER911102. The observed 10-sec theta difference for DC960208 is 19% of the ER911102 10-second difference. In other words, DC960208 exhibits a 10-second difference statistic that is less than half of what one would predict, assuming that 20 to 400 km spatial scale wrinkle amplitudes can be used to predict 2-km scale wrinkle amplitude.
This lower than expected theta fluctuation may be due to instrumental time constants. Since theta requires the useof both pressure and air temperature, the slowest probe will dictate theta response time. In order to infer VWS from in situ data it is neccessary that all the probes have response times much shorter than 10 seconds, and this includes the wind probes, the pressure probe, and the temperature probe. If any one of these probes has a slow response, or if the analysis procedure that is used to produce archived data creates an artificially slow response, then the VWS and RRi method for predicting CAT will not work.
When I chose to analyze DC960208 I did not know that MMS data was not available for the flight. Because I have no experience trying to infer VWS from any other system than the MMS, I should have been prepared to encounter unforeseen problems using DADS temperatures and winds. Given that the observed theta fluctuations are less than half of what I would expect for the conditions that existed for this flight, I must suspect that the DADS theta and wind data cannot be used for inferring VWS and RRi. I have many DC-8 flights with MMS temperature and wind data. Therefore, I shall suspend analysis of DC960208, even though it has a "moderate to severe" level of CAT, and proceed with an analysis of DC-8 flights that have MMS wind and temperature data.
Return to Home Page of this web site
____________________________________________________________________
This site opened: August 27, 2000. Last Update: September 18, 2000